
11 KiB
Name
多时间框架RSI均线交叉策略Multi-Timeframe-RSI-Moving-Average-Crossover-Strategy
Author
ChaoZhang
Strategy Description
 [trans]
概述
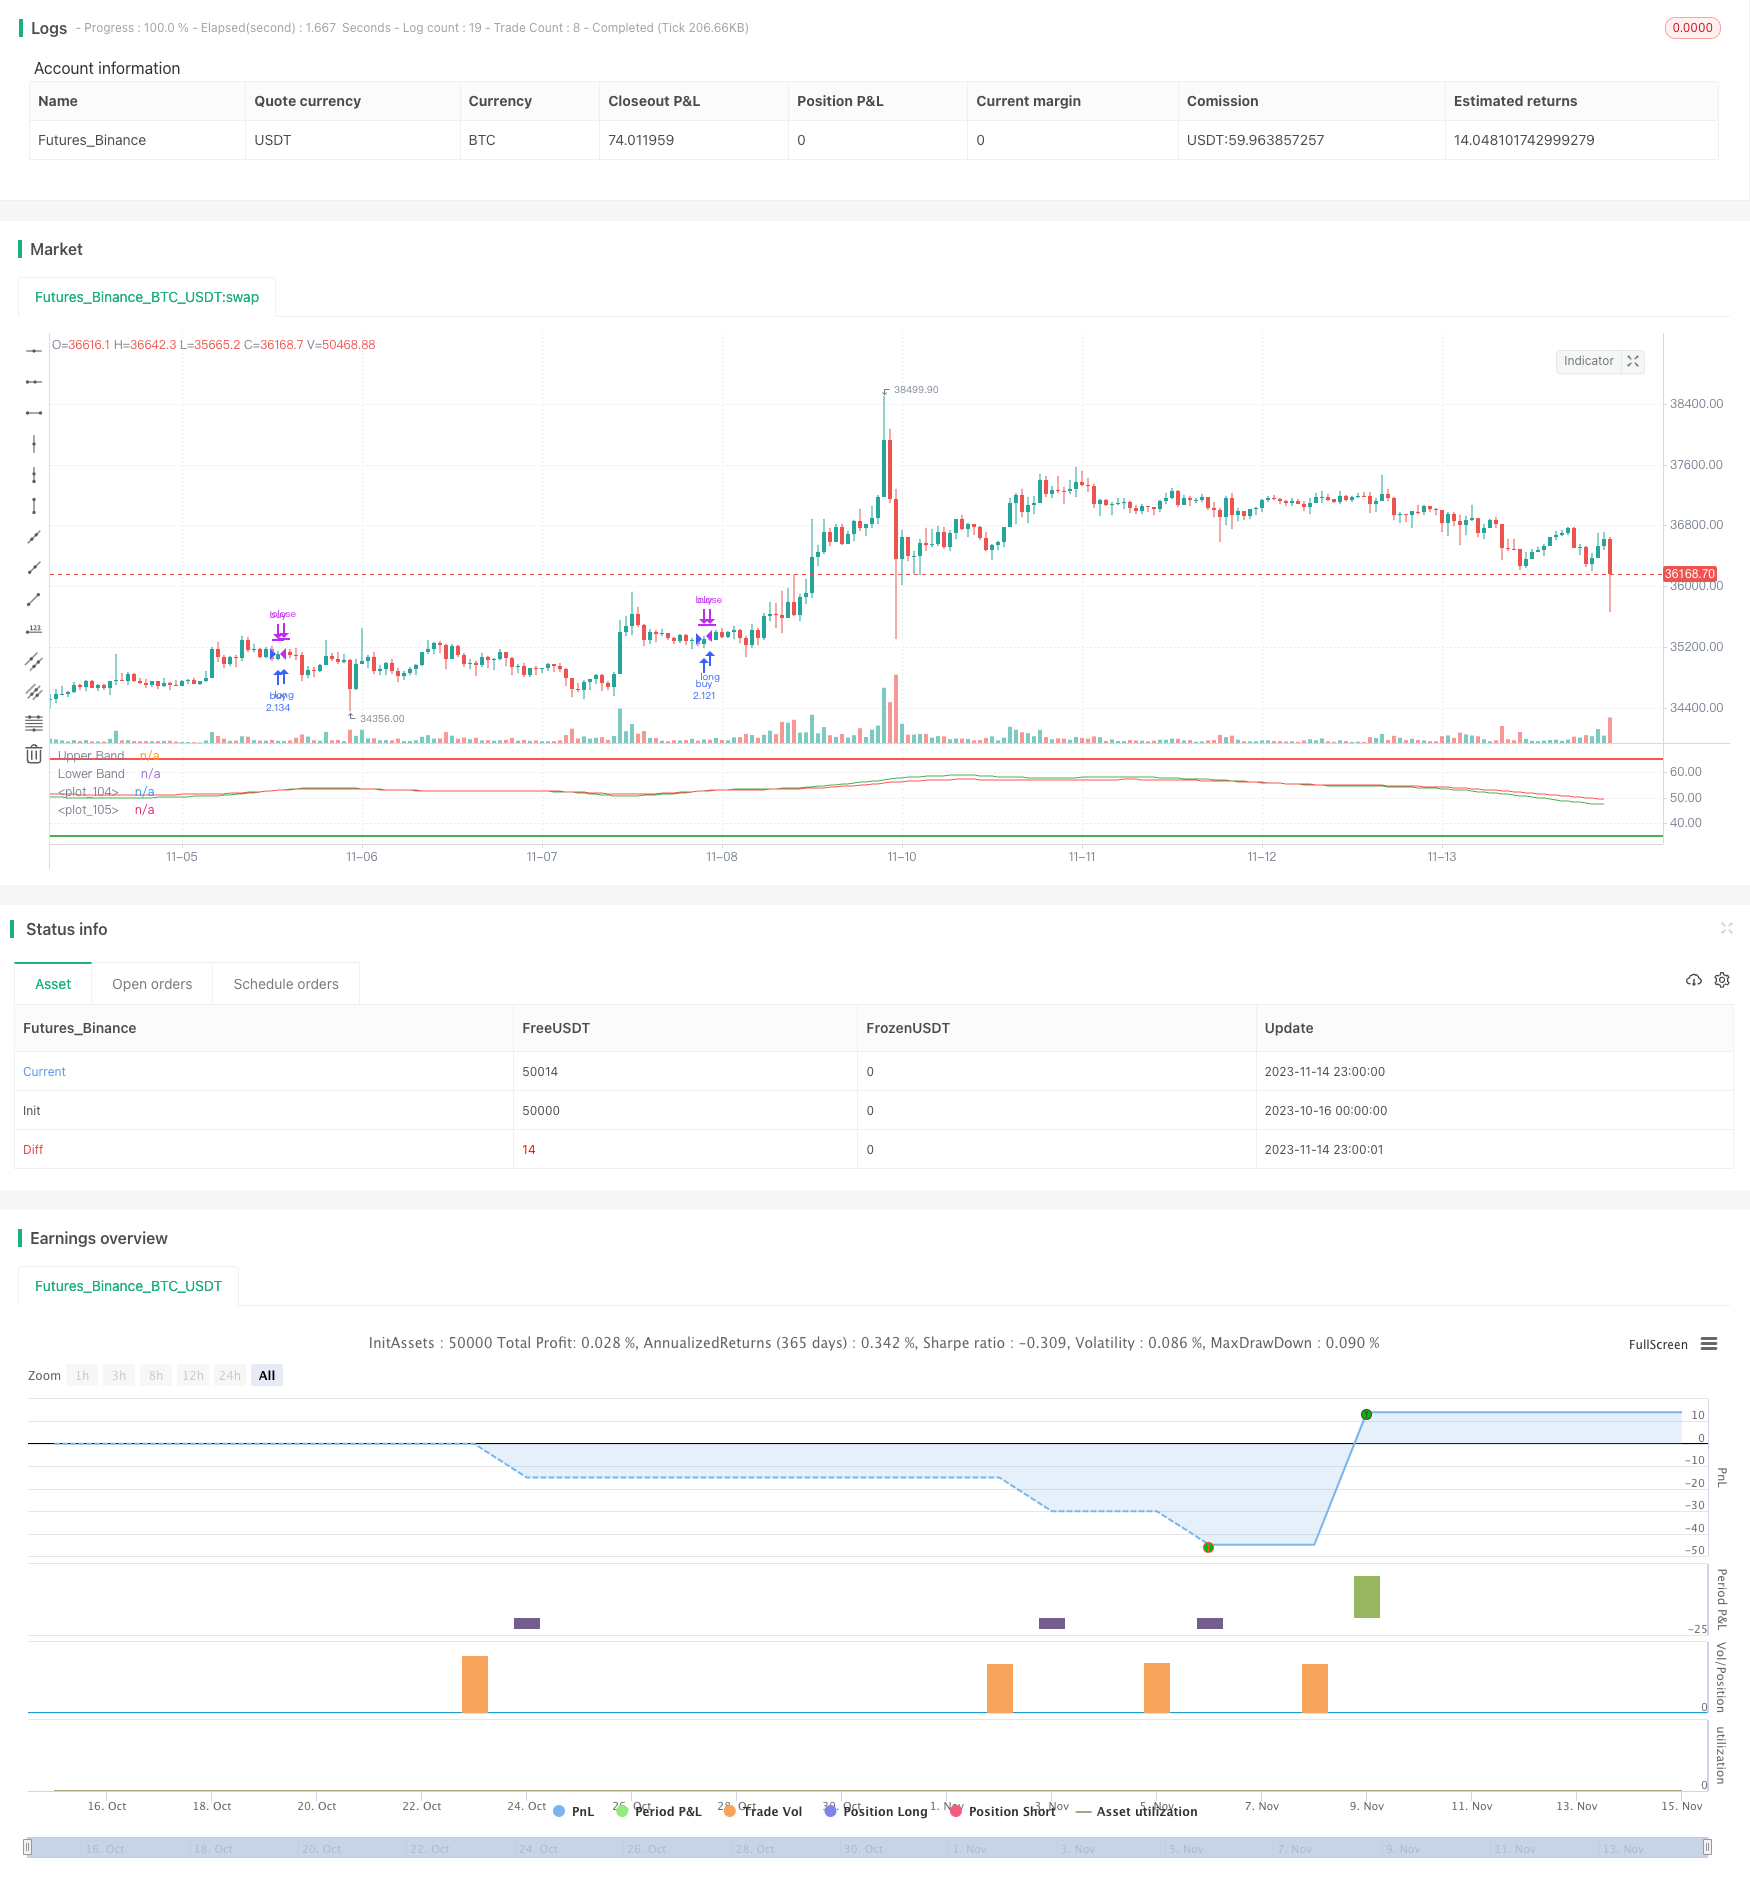
多时间框架RSI均线交叉策略是一种多时间框架的趋势跟踪策略。该策略同时使用多个时间框架的RSI指标,并对每个时间框架的RSI进行加权移动平均处理,最终合并为两个综合信号指标,当两个信号指标发生金叉时做多,发生死叉时做空,属于典型的双均线交叉策略。
原理
该策略首先在多个时间框架(1分钟、5分钟、15分钟等)分别计算RSI指标,然后对每个时间框架的RSI进行长度为15的加权移动平均(VMA)处理,得到各个时间框架的RSI均线。
之后,把所有时间框架的RSI均线进行等权重合并,分别合并成快线和慢线两个信号。快线长度为100周期的EMA,慢线长度为150周期的EMA。
当快线从下向上突破慢线时产生买入信号;当快线从上向下突破慢线时产生卖出信号。这样,多时间框架RSI的综合交叉信号,可以有效跟踪趋势,同时过滤掉短期市场噪音。
优势
-
多时间框架综合,可以平滑价格曲线,有效过滤假突破。
-
RSI指标可以反映超买超卖状态,避免追高杀跌。
-
双均线较单一均线系统有更好的持仓效果。
-
采用VMA而不是SMA,可以降低短期波动对均线的影响。
风险
-
多时间框架策略,对参数调优要求较高,不当设置可能进场过早或过晚。
-
均线系统对曲线拟合效果不佳,在趋势转折点表现较差。
-
RSI指标容易形成背离,应注意反转信号。
解决方法:调整时间框架参数设置;结合其他指标判断趋势,如MACD等;警惕RSI背离信号出现。
优化方向
-
优化时间框架的数量及参数设置,使之更好地捕捉趋势。
-
考虑加入止损机制,以控制风险。
-
结合其他指标判断趋势和背离,提高决策质量。
-
测试不同持仓周期参数,寻找最佳持仓效果。
总结
多时间框架RSI均线交叉策略通过多个时间范围内RSI指标的综合判断,利用均线系统平滑价格曲线并产生交易信号,属于典型的多时间框架趋势跟踪策略。该策略优势在于可以有效跟踪趋势同时过滤噪音,但需要注意参数调优和风险控制。通过进一步优化,该策略可以成为一个较强的趋势跟踪体系。
||
Overview
The Multi-Timeframe RSI Moving Average Crossover Strategy is a trend following strategy across multiple timeframes. It uses RSI indicators on multiple timeframes and takes a weighted moving average of each timeframe's RSI. The final signals are generated by combining all RSI moving averages into two comprehensive indicators and trading the crossover signals, which is a typical dual moving average crossover system.
Principles
This strategy first calculates RSI indicators on multiple timeframes (1-min, 5-min, 15-min, etc). Then it takes 15-period VMA (weighted moving average) of the RSI for each timeframe to get the RSI moving average lines.
After that, all the RSI moving averages from different timeframes are combined equally into two signals - fast line and slow line. The fast line is a 100-period EMA and the slow line is a 150-period EMA.
When the fast line crosses above the slow line, a buy signal is generated. When the fast line crosses below the slow line, a sell signal is generated. By combining multi-timeframe RSI in this way, the crossover signals can effectively track trends while filtering out short-term market noise.
Advantages
-
Combining multiple timeframes can smooth price curves and avoid false breakouts effectively.
-
RSI indicates overbought/oversold levels, avoiding chasing new highs/lows.
-
Dual moving averages have better holding effect than a single moving average system.
-
Using VMA instead of SMA reduces the impact of short-term fluctuations.
Risks
-
Multi-timeframe strategies require extensive parameter tuning, improper settings may cause missing good entries or late entries.
-
Moving averages have poor curve fitting, underperform at trend turning points.
-
RSI divergence happens frequently, reversal signals should be watched.
Solutions: Optimize timeframe parameters; Combine with other indicators like MACD to determine trends; Watch out for RSI divergence signals.
Optimization Directions
-
Optimize the number of timeframes and parameter settings to better capture trends.
-
Consider adding stop loss to control risks.
-
Combine other indicators for better decision on trends and divergences.
-
Test different holding period parameters for best holding effect.
Conclusion
The Multi-Timeframe RSI Moving Average Crossover Strategy generates trading signals by combining RSI indicators from multiple timeframes using a moving average system, which is a typical multi-timeframe trend following strategy. Its strength lies in effectively tracking trends and filtering out noise, but parameter tuning and risk control need attention. With further optimization, it can become a robust trend following system.
[/trans]
Strategy Arguments
| Argument | Default | Description |
|---|---|---|
| v_input_1 | 1 | Res 01 |
| v_input_2 | 5 | Res 0 |
| v_input_3 | 15 | Res 1 |
| v_input_4 | 15 | Res 2 |
| v_input_5 | 15 | Res 3 |
| v_input_6 | 30 | Res 4 |
| v_input_7 | 45 | Res 5 |
| v_input_8 | 60 | Res 6 |
| v_input_9 | 15 | lengthRSI |
| v_input_10 | 15 | lengthMA |
| v_input_11 | 100 | lengthFMA |
| v_input_12 | 150 | lengthFMA2 |
| v_input_13 | true | Long trades 0 or 1 |
| v_input_14 | false | Short trades 0 or 1 |
| v_input_15 | true | From Month |
| v_input_16 | true | From Day |
| v_input_17 | 2020 | From Year |
| v_input_18 | true | Thru Month |
| v_input_19 | true | Thru Day |
| v_input_20 | 2112 | Thru Year |
| v_input_21 | true | Show Date Range |
| v_input_22 | 10 | Long Stop Loss (%) |
| v_input_23 | 10 | Short Stop Loss (%) |
Source (PineScript)
/*backtest
start: 2023-10-16 00:00:00
end: 2023-11-15 00:00:00
period: 1h
basePeriod: 15m
exchanges: [{"eid":"Futures_Binance","currency":"BTC_USDT"}]
*/

//@version=4
strategy(title="RSI multitimeframe SMA crossover", shorttitle="RSI multitimeframe strategy", default_qty_type= strategy.percent_of_equity, margin_long=50, default_qty_value=150)

res1 = input(title="Res 01", type=input.resolution, defval="1")
res2 = input(title="Res 0", type=input.resolution, defval="5")
res3 = input(title="Res 1", type=input.resolution, defval="15")
res4 = input(title="Res 2", type=input.resolution, defval="15")
res5 = input(title="Res 3", type=input.resolution, defval="15")
res6 = input(title="Res 4", type=input.resolution, defval="30")
res7 = input(title="Res 5", type=input.resolution, defval="45")
res8 = input(title="Res 6", type=input.resolution, defval="60")


lengthRSI = input(15, minval=1)
lengthMA = input(15, minval=1)
lengthFMA = input(100, minval=1)
lengthFMA2 = input(150, minval=1)
Long_yes = input(defval=1, title="Long trades 0 or 1", minval=0, maxval=1)
Short_yes = input(defval=0, title="Short trades 0 or 1", minval=0, maxval=1)
src = close

// === INPUT BACKTEST RANGE ===
fromMonth = input(defval = 1,    title = "From Month",      type = input.integer, minval = 1, maxval = 12)
fromDay   = input(defval = 1,    title = "From Day",        type = input.integer, minval = 1, maxval = 31)
fromYear  = input(defval = 2020, title = "From Year",       type = input.integer, minval = 1970)
thruMonth = input(defval = 1,    title = "Thru Month",      type = input.integer, minval = 1, maxval = 12)
thruDay   = input(defval = 1,    title = "Thru Day",        type = input.integer, minval = 1, maxval = 31)
thruYear  = input(defval = 2112, title = "Thru Year",       type = input.integer, minval = 1970)

// === INPUT SHOW PLOT ===
showDate  = input(defval = true, title = "Show Date Range", type = input.bool)

// === FUNCTION EXAMPLE ===
start     = timestamp(fromYear, fromMonth, fromDay, 00, 00)        // backtest start window
finish    = timestamp(thruYear, thruMonth, thruDay, 23, 59)        // backtest finish window
window()  => time >= start and time <= finish ? true : false       // create function "within window of time"


// stop loss
longLossPerc = input(title="Long Stop Loss (%)", type=input.float, minval=0.0, step=0.5, defval=10) *
   0.01
longStopPrice = strategy.position_avg_price * (1 - longLossPerc)

shortLossPerc = input(title="Short Stop Loss (%)", type=input.float, minval=0.0, step=0.5, defval=10) *
   0.01
shortStopPrice = strategy.position_avg_price * (1 + shortLossPerc)


rsi1 = rsi(src, lengthRSI)
MA1 = vwma(rsi1, lengthMA)


outD1 = security(syminfo.tickerid, res1, MA1)
outD2 = security(syminfo.tickerid, res2, MA1)
outD3 = security(syminfo.tickerid, res3, MA1)
outD4 = security(syminfo.tickerid, res4, MA1)
outD5 = security(syminfo.tickerid, res5, MA1)
outD6 = security(syminfo.tickerid, res6, MA1)
outD7 = security(syminfo.tickerid, res7, MA1)
outD8 = security(syminfo.tickerid, res8, MA1)


//plot_d0 = outD0
//plot_d1 = outD1
//plot_d2 = outD2
//plot_d3 = outD3
//plot_d4 = outD4
//plot_d5 = outD5
//plot_d6 = outD6

out_multi = ema(outD1+outD2+outD3+outD4+outD5+outD6+outD7+outD8, lengthFMA)
out_multi2 = ema(outD1+outD2+outD3+outD4+outD5+outD6+outD7+outD8, lengthFMA2)
//out_multi1 = outD2+outD3+outD4
//out_multi2 = outD4+outD5+outD6

//col0 = outD0 < 20 ? color.lime : outD0 > 80 ? color.red : color.blue
//col1 = outD1 < 20 ? color.lime : outD1 > 80 ? color.red : color.blue
//col2 = outD2 < 20 ? color.lime : outD2 > 80 ? color.red : color.blue
//col3 = outD3 < 20 ? color.lime : outD3 > 80 ? color.red : color.blue
//col4 = outD4 < 20 ? color.lime : outD4 > 80 ? color.red : color.blue
//col5 = outD5 < 20 ? color.lime : outD5 > 80 ? color.red : color.blue
//col6 = outD6 < 20 ? color.lime : outD6 > 80 ? color.red : color.blue


// plot(plot_d0,linewidth=2, color=col0)
// plot(plot_d1, linewidth=2, color=col1)
// plot(plot_d2,linewidth=2, color=col2)
// plot(plot_d3,linewidth=2, color=col3)
// plot(plot_d4,linewidth=2, color=col4)
// plot(plot_d5,linewidth=2, color=col5)
// plot(plot_d6,linewidth=2, color=col6)

long=(out_multi/8)
short=(out_multi2/8)

plot(long, linewidth=1, color=color.green)
plot(short, linewidth=1, color=color.red)

long1=crossover(long,short)
short1=crossunder(long,short)

h0 = hline(65, "Upper Band", color=color.red, linestyle=hline.style_solid, linewidth=2 )
h1 = hline(35, "Lower Band", color=color.green, linestyle=hline.style_solid, linewidth=2)


strategy.entry("buy", strategy.long, when=long1 and window() and Long_yes > 0)
if strategy.position_size > 0
    strategy.exit(id="XL STP", stop=longStopPrice)
strategy.close("buy",when=short1 )

strategy.entry("sell", strategy.short, when=short1 and window() and Short_yes > 0)
if strategy.position_size < 0
    strategy.exit(id="XS STP", stop=shortStopPrice)
strategy.close("buy",when=long1 )
Detail
https://www.fmz.com/strategy/432341
Last Modified
2023-11-16 16:28:22