
9.3 KiB
Name
多时间框架趋势追踪日内scalping策略Multi-Timeframe-Trend-Tracking-Intraday-Scalping-Strategy
Author
ChaoZhang
Strategy Description
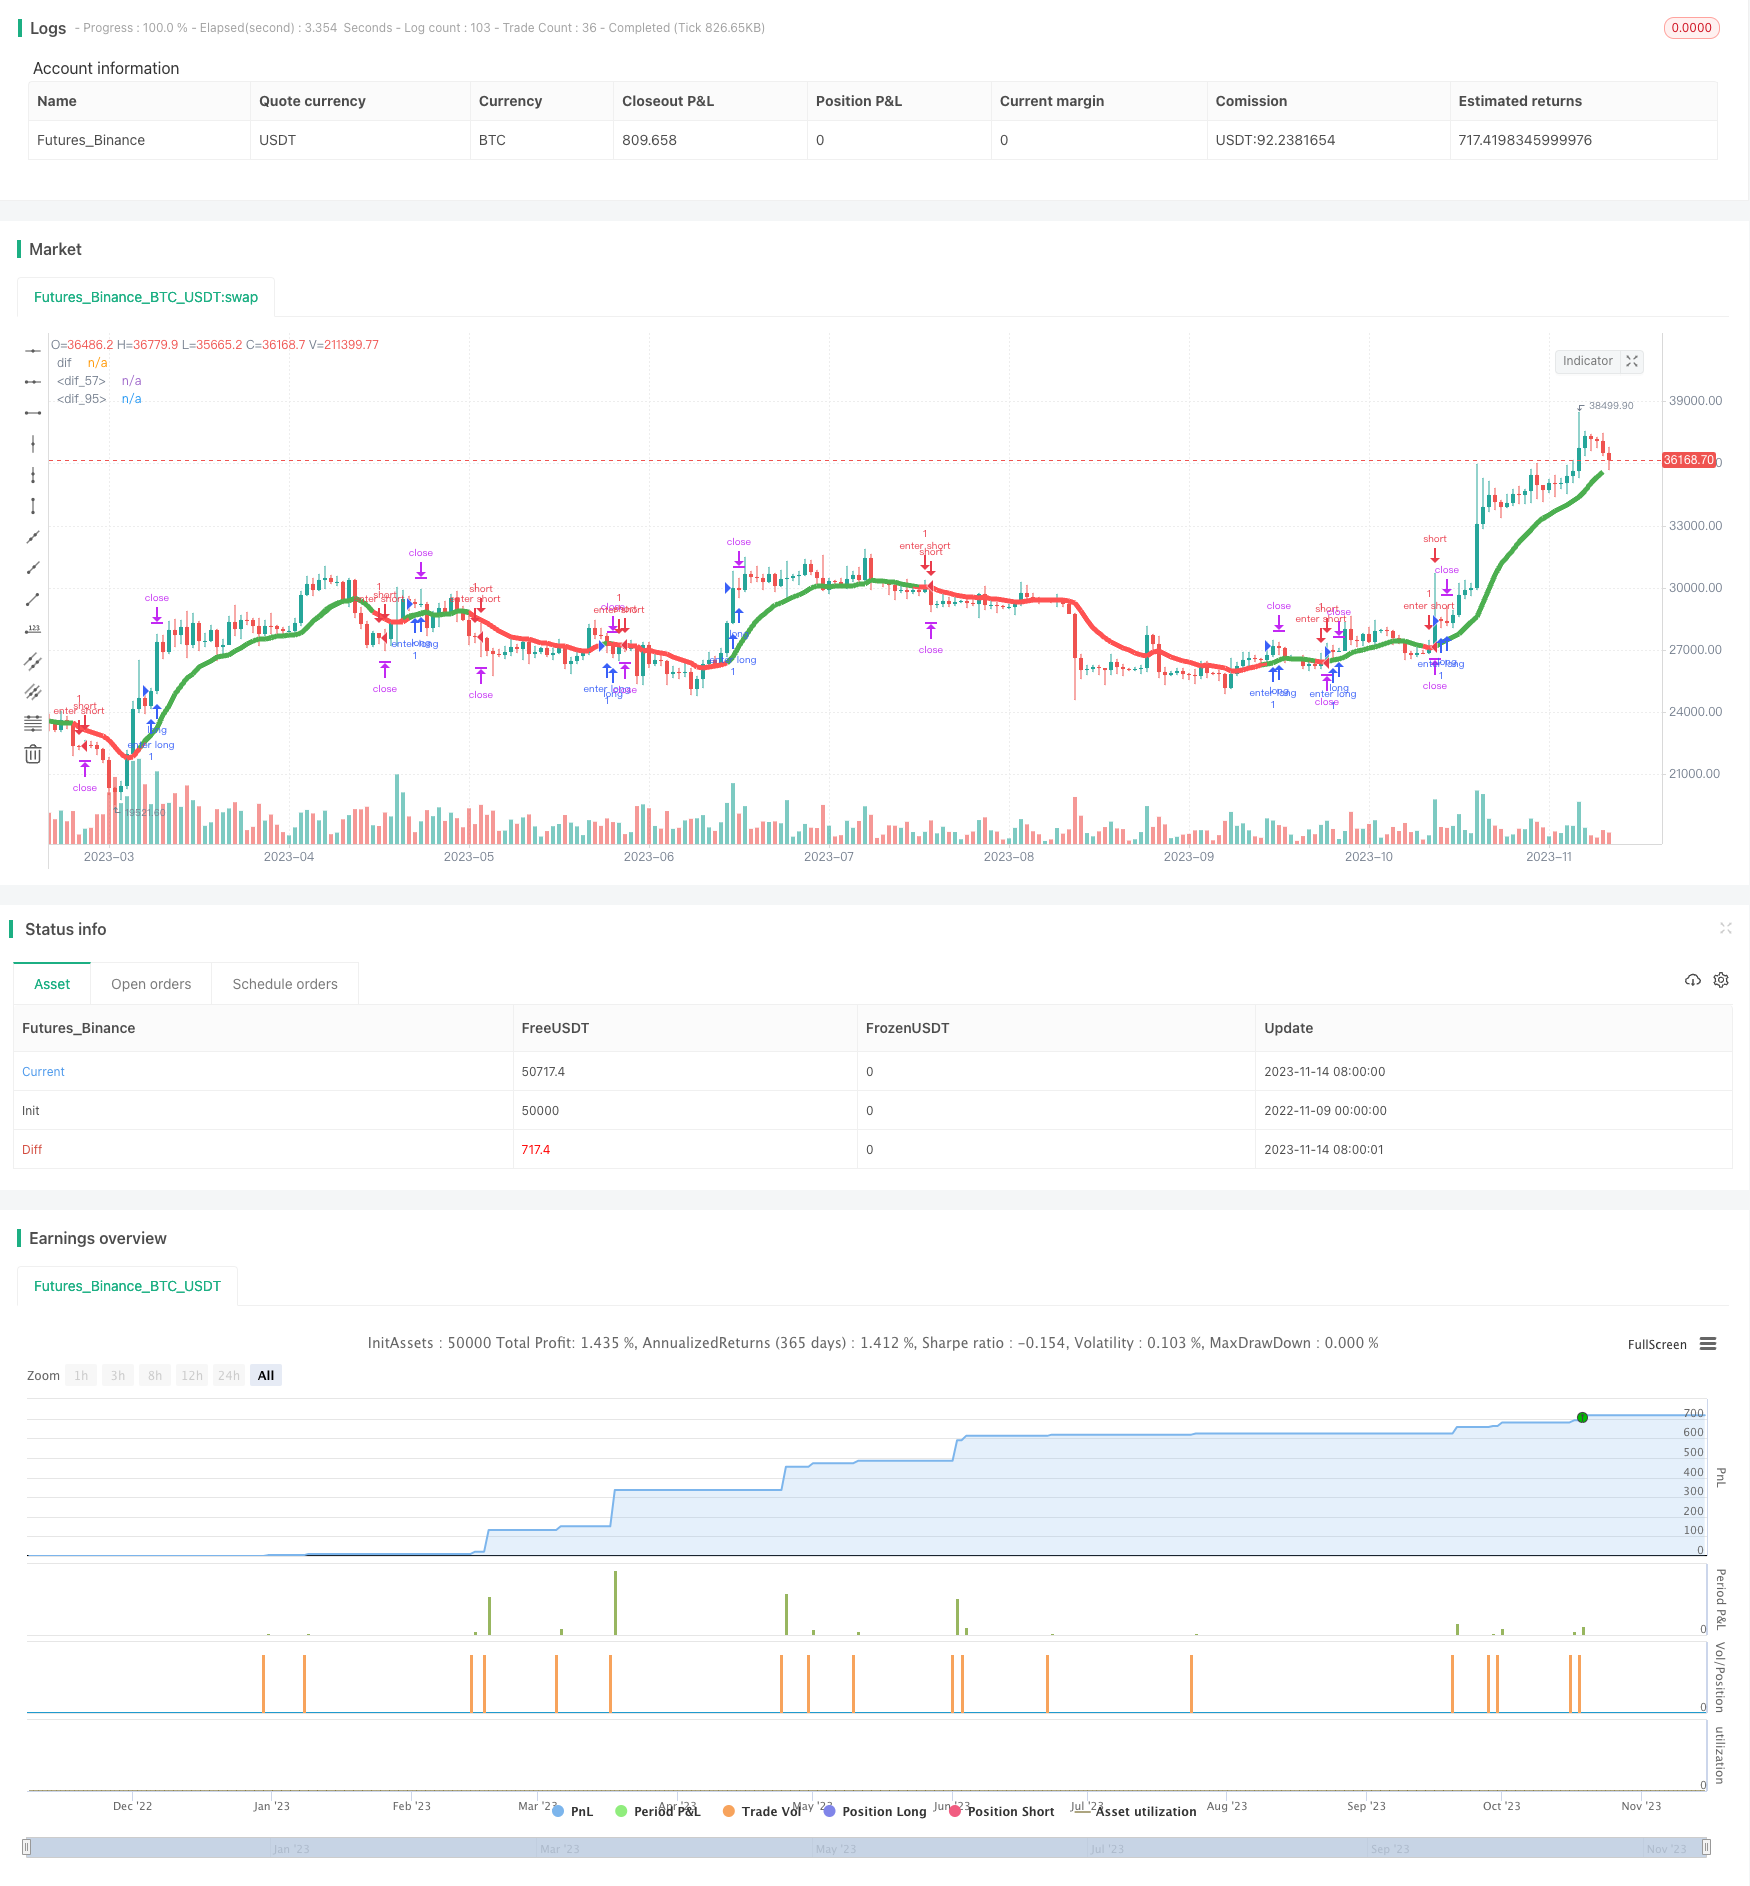 [trans]
概述
本策略通过结合多个时间框架的移动平均线指标,实现多时间框架之间的趋势一致性判断,在日内采取scalping操作策略,追捧趋势获得利润。
策略原理
本策略使用5分钟、15分钟、30分钟和60分钟四个时间框架的8期和20期移动平均线构建交易信号。当较短期的8日移动平均线上穿20日移动平均线时产生买入信号;当8日移动平均线下穿20日移动平均线时产生卖出信号。
策略要求5分钟、15分钟、30分钟和60分钟时间框架的交易信号必须一致时才发出交易指令。也就是说,只有当这四个时间框架的移动平均线都符合买入信号或者卖出信号时,才会进行买入或者卖出操作。
在进入仓位后,策略会以固定盈利点位设置止盈单,实现日内的scalping操作。
具体来说,策略通过调用security函数获取不同时间框架下的移动平均线数据。计算出5分钟、15分钟、30分钟和60分钟的8日与20日平均线差值,并绘制差值曲线。
根据差值曲线是否上穿零轴判断买入和卖出信号。并设定多个标志位islong和isshort来记录每个时间框架下的交易信号。最终在islong和isshort的状态满足要求时发出入场和出场指令。
在入场后,策略通过strategy.exit函数设置固定点数止盈,实现scalping操作。
优势分析
本策略具有以下优势:
-
多时间框架设计,通过不同周期指标的综合判断,能够有效过滤假断和减少交易频率。
-
日内scalping策略,Profit优化,能够持续获得小利润累积。
-
代码结构清晰,每个部分功能明确,易于理解和优化。
-
条件设置合理,可有效控制交易风险。
风险分析
本策略也存在一定的风险:
-
多时间框架设计虽然可以过滤部分噪音,但也可能错过部分细节导致签到不明显的趋势变化。
-
日内scalping带来频繁交易,需要考虑交易成本控制。
-
固定止盈点位设置不够灵活,无法根据市场变化调整。
-
依赖指标产生交易信号,存在被愚弄的可能。
优化方向
本策略可以从以下几个方面进行优化:
-
增加更多不同周期时间框架的指标判断,使信号更稳定可靠。
-
优化止盈策略,根据ATR动态设定止盈点位。
-
加入附加条件过滤入场时机,例如交易量放大、突破历史极值等。
-
优化移动平均线的周期参数,寻找最佳参数组合。
-
增加机器学习模型判断指标信号的可靠性,避免被套利。
总结
本策略整体来说是一个典型的多时间框架趋势追踪策略,日内采取scalping方式获利。策略思路清晰,代码结构合理,值得进一步测试和优化。通过一定的优化调整,本策略可以成为一个非常实用的日内scalping策略模板。 ||
Overview
This strategy combines moving average indicators across multiple timeframes to determine trend consistency and takes scalping actions during the day to follow the trend and make profits.
Strategy Logic
This strategy uses 8-period and 20-period moving averages on the 5-minute, 15-minute, 30-minute and 60-minute timeframes to generate trading signals. A buy signal is generated when the 8-period MA crosses above the 20-period MA. A sell signal is generated when the 8-period MA crosses below the 20-period MA.
The strategy requires consistent signals across the four timeframes before issuing a trade order. A buy or sell order is placed only when the moving averages align on all four timeframes.
Once entered into a position, the strategy sets a fixed profit target to take profits intraday.
Specifically, the strategy uses the security() function to retrieve MA values from different timeframes. It calculates the difference between the 8-period and 20-period MAs on the 5-min, 15-min, 30-min and 60-min charts.
Buy and sell signals are determined by whether the difference line crosses above/below the zero line. Multiple islong and isshort flags are used to record the signal on each timeframe. Orders are placed when the islong and isshort conditions are met.
After entering a trade, the strategy uses strategy.exit() to set a fixed profit target for scalping.
Advantage Analysis
The advantages of this strategy include:
-
Multi-timeframe design filters noise and reduces trade frequency.
-
Intraday scalping with profit optimization accumulates small gains consistently.
-
Clear code structure, easy to understand and optimize.
-
Reasonable conditions help control risk.
Risk Analysis
Potential risks of this strategy:
-
Multi-timeframe may miss subtle trend changes.
-
Frequent scalping trades increase costs.
-
Fixed profit target lacks flexibility.
-
Depends on indicators, risks being fooled.
Optimization Directions
Possible optimizations:
-
Add more timeframes for more robust signals.
-
Dynamic profit target based on ATR.
-
Additional filters like volume increase or history extremes.
-
Optimize MA periods for best parameters.
-
Add machine learning to judge signal reliability.
Summary
Overall this is a typical multi-timeframe trend tracking strategy using intraday scalping. The logic is clear and code well structured. With proper optimization it can become a very practical scalping strategy template.
[/trans]
Strategy Arguments
| Argument | Default | Description |
|---|---|---|
| v_input_1 | false | Zeige alle (Show all) Candles/Bars? |
| v_input_2 | 52 | Profit |
| v_input_3 | 2e-05 | ATR |
Source (PineScript)
/*backtest
start: 2022-11-09 00:00:00
end: 2023-11-15 00:00:00
period: 1d
basePeriod: 1h
exchanges: [{"eid":"Futures_Binance","currency":"BTC_USDT"}]
*/

//@version=2
strategy(title="PeBAS $JPY Scalper 15m ",overlay=true)
zeigeallebars= input(false, title="Zeige alle (Show all) Candles/Bars?")
profitwert=input(52, title="Profit")
myatr=  input(title="ATR", type=float, defval=0.00002, minval=0.00001,step=0.00001)


//Plot  EMA-Differenz Aktueller Timeframe

dif=(ema(close,8)+ema(close,20))/2
mcolor=ema(close,8) > ema(close,20) ? green : red
bs = ema(close,8) > ema(close,20) ? true : false
ThisATR=atr(16)

//trans = zeigeallebars == true ? 00 : 100
//plot(dif,"dif",color=mcolor,linewidth=6,transp=trans)


//1M EMA
htf_ma1Mema8 = ema(close, 5)
htf_ma1Mema20 = ema(close, 20)
ema81m=request.security(syminfo.tickerid, "1", htf_ma1Mema8)
ema201m=request.security(syminfo.tickerid, "1", htf_ma1Mema20)
dif1M = (ema81m + ema201m) / 2
Close1M = request.security(syminfo.tickerid, "1", close)
color1=ema81m > ema201m ? green : red
//plot(dif1M,"dif",color1,linewidth=6)
//plotshape(1, style=shape.cross, color=color1,location=location.top)
ls1 = ema81m > ema201m ? 1 : 0


//5M EMA

htf_ma5Mema8 = ema(close, 8)
htf_ma5Mema20 = ema(close, 20)
ema85m=request.security(syminfo.tickerid, "5", htf_ma5Mema8)
ema205m=request.security(syminfo.tickerid, "5", htf_ma5Mema20)
dif5M = (ema85m + ema205m) / 2

color5=ema85m > ema205m ? green : red
plot(dif5M,"dif",color5,linewidth=5)
ls5 = ema85m > ema205m ? 1 : 0
alert1= ema85m > ema205m and ema85m[1] < ema205m[1] ? 1 : 0
islong5 = ema85m > ema205m ? 1 : 0
isshort5 = ema85m < ema205m ? 1 : 0

//15M EMA

htf_ma15Mema8 = ema(close, 8)
htf_ma15Mema20 = ema(close, 20)
ema815m=request.security(syminfo.tickerid, "15", htf_ma15Mema8)
ema2015m=request.security(syminfo.tickerid, "15", htf_ma15Mema20)
dif15M = (ema815m + ema2015m) / 2

color15=ema815m > ema2015m ? green : red
plot(dif15M,"dif",color15,linewidth=3)
ls15= ema815m > ema2015m ? 1 : 0
alert2= ema815m > ema2015m and ema815m[1] < ema2015m[1] ? 1 : 0
islong15 = ema815m > ema2015m ? 1 : 0
isshort15 = ema815m < ema2015m ? 1 : 0


//30M EMA
htf_ma30Mema8 = ema(close, 8)
htf_ma30Mema20 = ema(close, 20)
ema830m=request.security(syminfo.tickerid, "30", htf_ma30Mema8)
ema2030m=request.security(syminfo.tickerid, "30", htf_ma30Mema20)
dif30M = (ema830m + ema2030m) / 2

color30=ema830m > ema2030m ? green : red
ls30= ema830m > ema2030m ?1 : 0
islong30 = ema830m > ema2030m ? 1 : 0
isshort30 = ema830m < ema2030m ? 1 : 0


//60M EMA

htf_ma60Mema8 = ema(close, 8)
htf_ma60Mema20 = ema(close, 20)
ema860m=request.security(syminfo.tickerid, "60", htf_ma60Mema8)
ema2060m=request.security(syminfo.tickerid, "60", htf_ma60Mema20)
dif60M = (ema860m + ema2060m) / 2

color60=ema860m > ema2060m ? green : red
ls60= ema860m > ema2060m ?1 : 0

islong60 = ema860m > ema2060m ? 1 : 0
isshort60 = ema860m < ema2060m ? 1 : 0

plot(dif60M,"dif",color60,linewidth=3,transp=70)

islong = islong5 ==1 and islong15 ==1 and islong60 ==1 and year > 2017 ? 1 : 0
isshort = isshort5 ==1 and isshort15 ==1 and  isshort60 ==1 and year > 2017 ? 1 : 0


condition2l= 0
condition2s = 0

c= alert1 == alert2  and alert1[1] != alert2[1] ? 1 : 0
alertcondition(c, title='Da tat sich was ', message='Da tat sich was!')

strategy.entry("enter long", strategy.long,1,when = islong ==1 and islong[1] == 0  )
strategy.entry("enter short", strategy.short,1,when = isshort == 1  and isshort [1] == 0)
strategy.exit("close",profit=profitwert)
strategy.exit("close",profit=profitwert)
Detail
https://www.fmz.com/strategy/432362
Last Modified
2023-11-16 17:47:06