
8.4 KiB
Name
多时间框架底部反转策略The-Multi-Timeframe-Bottom-Reversal-Strategy
Author
ChaoZhang
Strategy Description
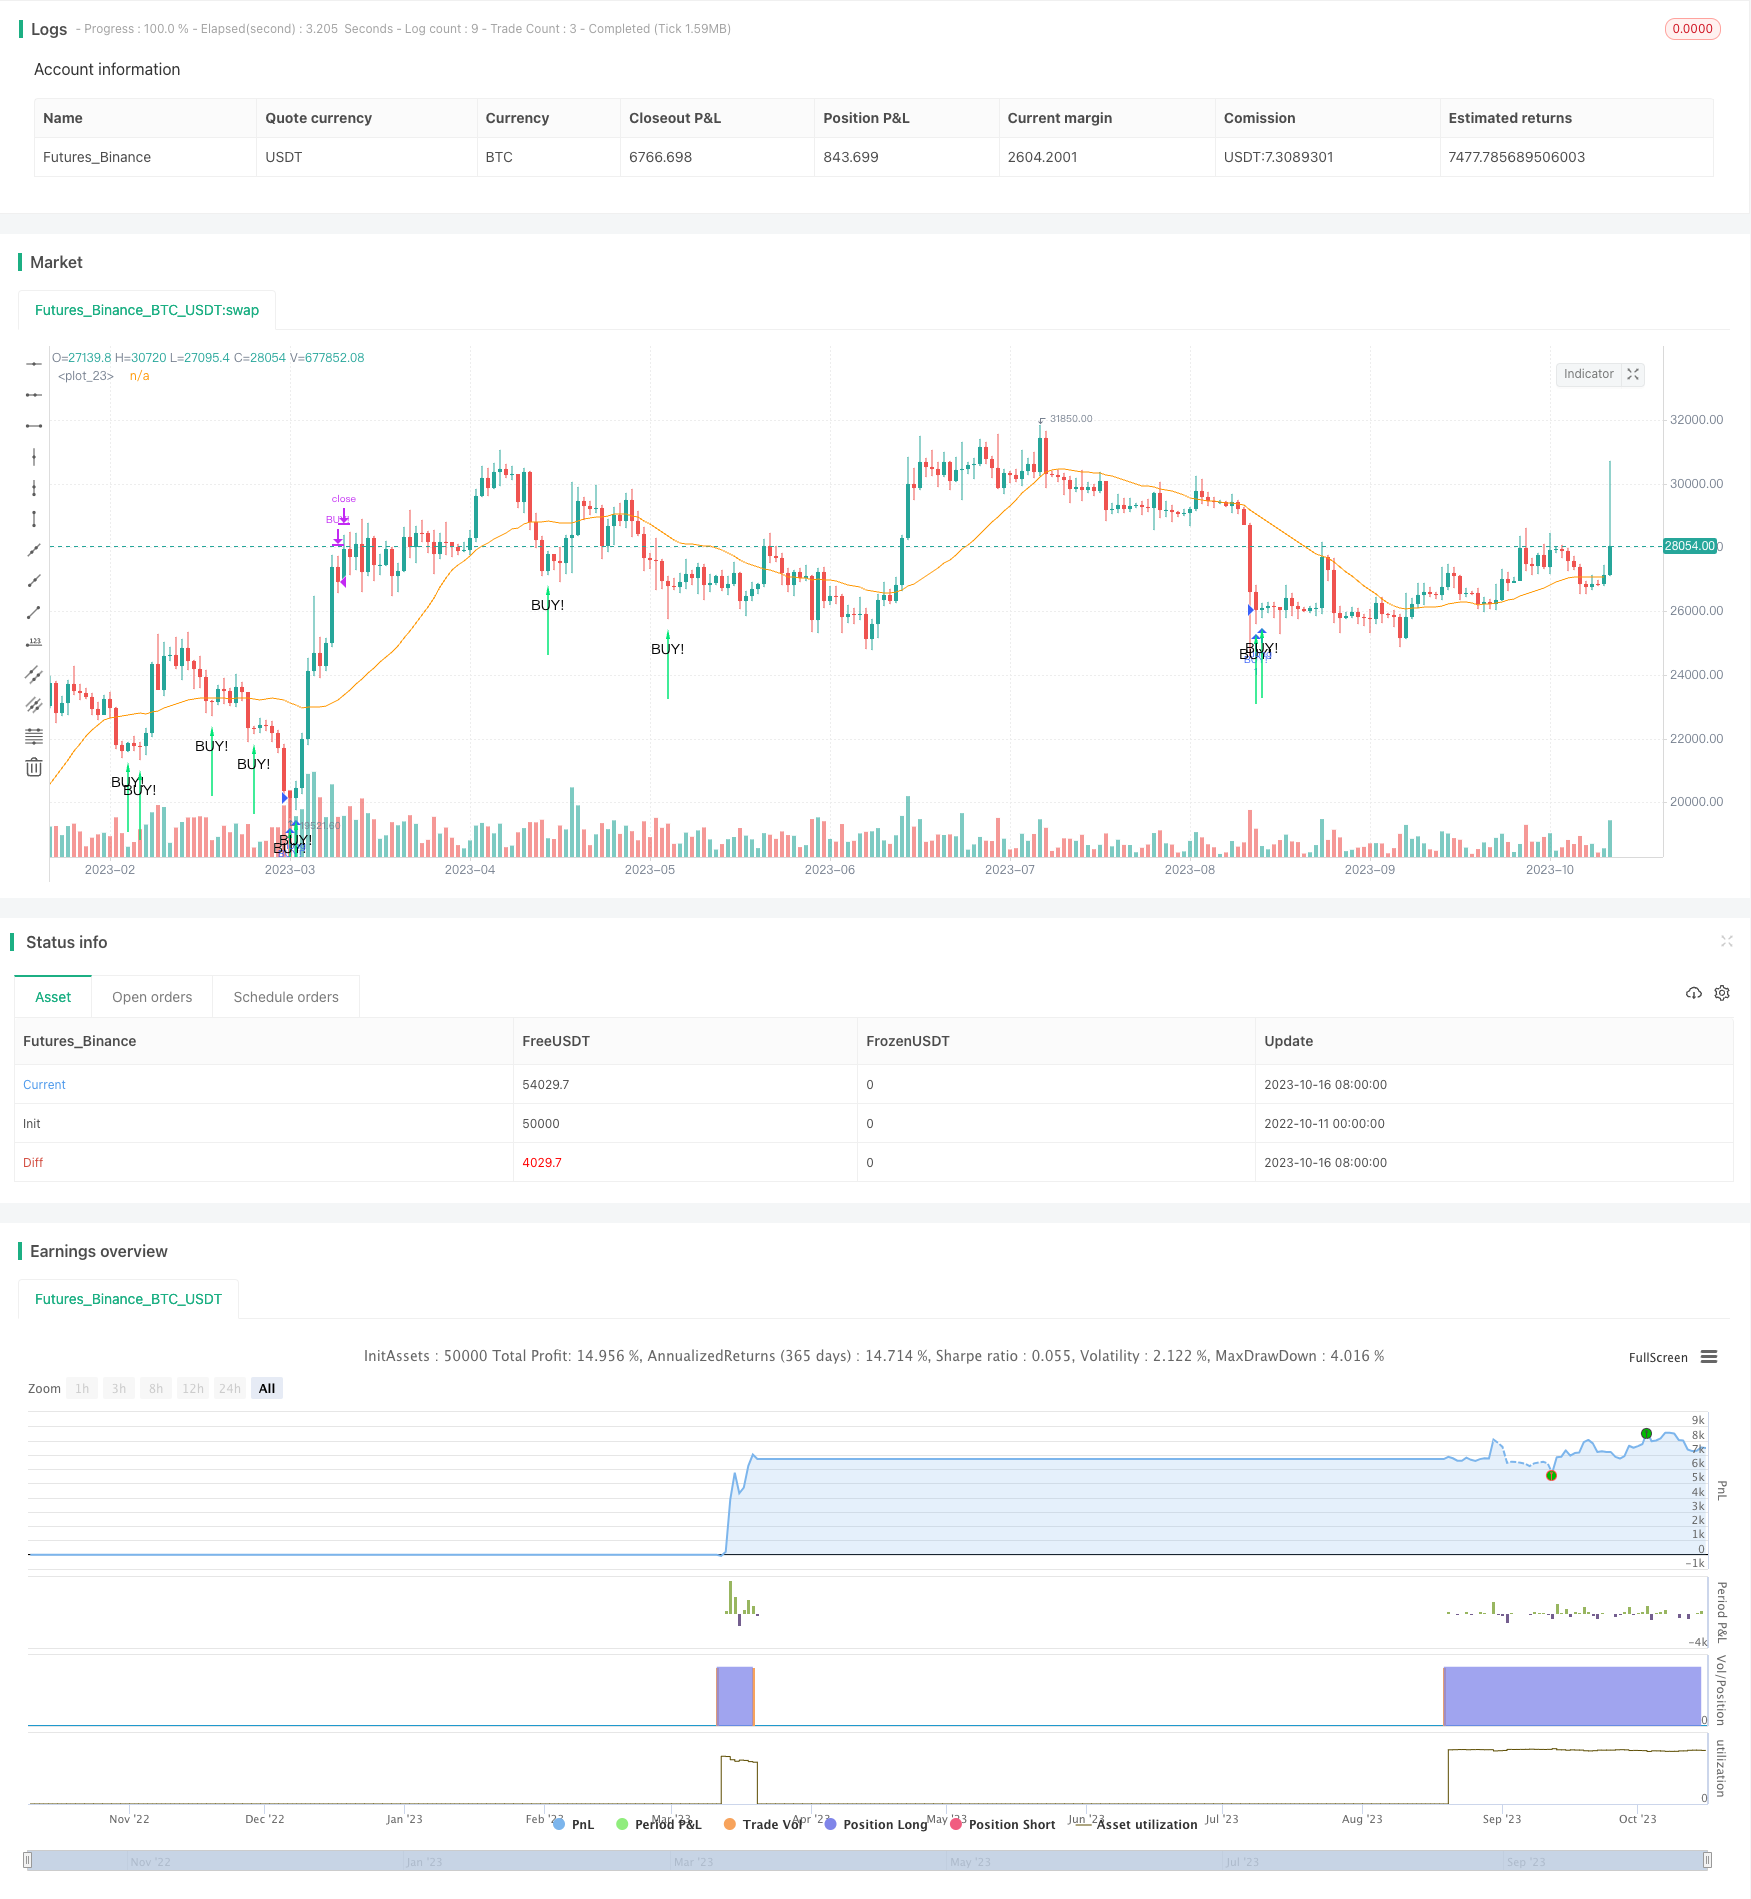
[trans]
概述
该策略利用多个底部形态指标的组合来识别大幅反转的时机,采取趋势追踪止损策略,目标获利超过止损。
原理
该策略主要基于以下几个指标判断底部反转:
-
底部敏感度指标(Noro's BottomSensivity):判断K线是否出现特定底部形态。
-
确定性意愿指数(CVI):判断多空心理面临转变。
-
终极指标(UCS):判断超跌脱离均线的情况。
-
收益率指标(RSI):判断超卖情况。
-
形态组合:包括烛形、图钉等多种底部形态。
该策略将多个底部指标组合使用,当满足策略参数设置的底部形态数量时,产生买入信号。为过滤假突破,策略还加入RSI指标判断,只有在超卖时才会触发买入。
用户可以自定义配置各个底部判断指标的使用与参数,实现了高度的灵活性。同时,策略加入SMA均线过滤,避免在趋势下方做多。
优势
-
利用多个指标判断,提高確定性
-
可自定义指标参数,适应不同品种
-
SMA均线过滤,避免追顶
-
可配置仅红K线入场,降低风险
-
可启用弹窗报警,实时监控
风险
-
多指标组合判断可能错过底部
-
底部形态不一定持续反转
-
需要关注交易量能否支撑反转
优化方向
-
优化指标参数配置,调整适应不同品种
-
增加仓位管理,通过加仓降低成本价
-
增加止损策略,跟踪趋势止损
总结
该策略充分利用多指标判断提高底部识别准确性,通过趋势跟踪止损锁定盈利,可有效控制风险。但仍需关注交易量能否支撑起反转趋势。用户可以根据品种特点优化参数,以适应不同市场环境。
||
Overview
This strategy combines multiple bottom pattern indicators to identify major reversal opportunities, adopting a trend following stop loss strategy to target profits exceeding stop loss.
Principle
The strategy mainly uses the following indicators to determine bottom reversal:
-
Bottom Sensivity Indicator (Noro's BottomSensivity): Detect specific bottom patterns on the candlestick chart.
-
Certainty of Volition Index (CVI): Determine the shift in bullish/bearish sentiment.
-
Ultimate Cycle Signal (UCS): Detect oversold below the moving average.
-
Relative Strength Index (RSI): Identify oversold conditions.
-
Pattern Combination: Including candlestick, pin bar and other bottom patterns.
The strategy combines multiple bottom indicators, generating buy signals when the number of bottom patterns meets the parameter settings. To filter false breaks, RSI is also used to trigger buy only in oversold conditions.
Users can customize the usage and parameters of each bottom indicator, providing high flexibility. The SMA filter avoids buying into a downtrend.
Advantages
-
Improved accuracy using multiple indicators
-
Customizable parameters suit different products
-
SMA filter prevents buying tops
-
Optional red candles only reduce risk
-
Alerts allow realtime monitoring
Risks
-
Multiple indicators may miss bottoms
-
Bottom patterns do not always reverse
-
Need to watch if volume supports reversal
Enhancement
-
Optimize parameters for different products
-
Add position sizing to lower cost basis
-
Implement stop loss to lock in profits
Summary
The strategy effectively identifies bottoms with multiple indicators, controlling risk with trend following stop loss. But volume support needs monitoring. Users can optimize parameters per product characteristics.
[/trans]
Strategy Arguments
| Argument | Default | Description |
|---|---|---|
| v_input_1 | 35 | overSold |
| v_input_2 | 70 | overBought |
| v_input_3 | 3 | Bottom-Sensivity |
| v_input_4 | 25 | SMA Length |
| v_input_5 | 3 | Bars of Locomotive |
| v_input_6 | true | Use bottom-pattern Locomotive? |
| v_input_7 | true | Use bottom-pattern Pin-bar? |
| v_input_8 | true | Use bottom-indicator CVI? |
| v_input_9 | true | Use bottom-indicator UCS? |
| v_input_10 | true | Use bottom-indicator WVF? |
| v_input_11 | true | Use bottom-indicator RSI? |
| v_input_12 | false | Only red candles? |
| v_input_13 | true | Use SMA Filter? |
| v_input_14 | false | Show SMA Filter? |
Source (PineScript)
/*backtest
start: 2022-10-11 00:00:00
end: 2023-10-17 00:00:00
period: 1d
basePeriod: 1h
exchanges: [{"eid":"Futures_Binance","currency":"BTC_USDT"}]
*/

// the original indicator is Noro's BottomSensivity v0.6
//@version=4
strategy("Noro's BottomSensivity v0.6 strategy + rsi + Alarm", shorttitle="Bottom 0.6 StRsiAlarm", overlay=true)

overSold = input(35)
overBought = input(70)
botsens = input(defval = 3, minval = 1, maxval = 4, title = "Bottom-Sensivity")
smalen = input(defval = 25, minval = 20, maxval = 200, title = "SMA Length")
bars = input(defval = 3, minval = 2, maxval = 4, title = "Bars of Locomotive")
useloc = input(true, title = "Use bottom-pattern Locomotive?")
usepin = input(true, title = "Use bottom-pattern Pin-bar?")
usecvi = input(true, title = "Use bottom-indicator CVI?")
useucs = input(true, title = "Use bottom-indicator UCS?")
usevix = input(true, title = "Use bottom-indicator WVF?")
usersi = input(true, title = "Use bottom-indicator RSI?")
usered = input(false, title = "Only red candles?")
usesma = input(true, title = "Use SMA Filter?")
showsma = input(false, title = "Show SMA Filter?")

//SMA Filter
sma = sma(close, smalen)
colsma = showsma == true ? red : na
plot(sma, color = colsma)

//VixFix method
//Start of ChrisMoody's code
pd = 22
bbl = 20
mult = 2
lb = 50
ph = .85
pl = 1.01
hp = false
sd = false
wvf = ((highest(close, pd)-low)/(highest(close, pd)))*100
sDev = mult * stdev(wvf, bbl)
midLine = sma(wvf, bbl)
lowerBand = midLine - sDev
upperBand = midLine + sDev
rangeHigh = (highest(wvf, lb)) * ph
rangeLow = (lowest(wvf, lb)) * pl
//End of ChrisMoody's code

//Locomotive mmethod
bar = close > open ? 1 : close < open ? -1 : 0
locob = bar == 1 and bar[1] == -1 and bar[2] == -1 and (bar[3] == -1 or bars < 3) and (bar[4] == -1 or bars < 4) ? 1 : 0

//PIN BAR
body = abs(close - open)
upshadow = open > close? (high - open) : (high - close)
downshadow = open > close ? (close - low) : (open - low)
pinbar = open[1] > close[1] ? (body[1] > body ? (downshadow > 0.5 * body ? (downshadow > 2 * upshadow ? 1 : 0 ) : 0 ) : 0 ) : 0

//CVI method
//Start of LazyBear's code
ValC=sma(hl2, 3)
bull=-.51
bear=.43
vol=sma(atr(3), 3)
cvi = (close-ValC) / (vol*sqrt(3))
cb= cvi <= bull ? green : cvi >=bear ? red : cvi > bull ? blue : cvi < bear ? blue : na
bull1 = cvi <= bull
bear1 = cvi >= bear
bull2 = bull1[1] and not bull1
bear2 = bear1[1] and not bear1
//End of LazyBear's code

//UCS method
//Start of UCS's code
ll = lowest(low, 5)
hh = highest(high, 5)
diff = hh - ll
rdiff = close - (hh+ll)/2
avgrel = ema(ema(rdiff,3),3)
avgdiff = ema(ema(diff,3),3)
mom = ((close - close[3])/close[3])*1000
SMI = avgdiff != 0 ? (avgrel/(avgdiff/2)*100) : 0
SMIsignal = ema(SMI,3)
ucslong = SMI < -35  and mom > 0 and mom[1] < 0 ? 1 : 0
//End of UCS's code

//RSI method
//Chris Moody's code
up = rma(max(change(close), 0), 2)
down = rma(-min(change(close), 0), 2)
rsi = down == 0 ? 100 : up == 0 ? 0 : 100 - (100 / (1 + up / down))
rsib = rsi < 10 ? 1 : 0
//Chris Moody's code

//sum
locobot = useloc == false ? 0 : locob
vixfixbot = usevix == false ? 0 : wvf >= upperBand or wvf >= rangeHigh ? 1 : 0
cvibot = usecvi == false ? 0 : bull2 == true ? 1 : 0
ucsbot = useucs == false ? 0 : ucslong == 1 ? 1 : 0
rsibot = usersi == false ? 0 : rsib
pinbot = usepin == false ? 0 : pinbar
score = vixfixbot + locobot + cvibot + ucsbot + rsibot + pinbot

//arrows
bottom = usered == false ? usesma == false ? score >= botsens ? 1 : 0 : high < sma and score >= botsens ? 1 : 0 : usesma == false ? score >= botsens and close < open ? 1 : 0 : high < sma and score >= botsens and close < open ? 1 : 0
plotarrow(bottom == 1 ? 1 : na, title="Buy arrow", colorup=lime, maxheight=60, minheight=50, transp=0)
data = bottom == 1
plotchar(data, char=" ", text="BUY!", location=location.belowbar, color=green, size=size.small)


//Market buy and exit
strategy.entry("BUY!", strategy.long, when =(bottom == 1) and(rsi(close,14)<overSold))
strategy.close("BUY!", when = (crossunder(rsi(close,14), overBought)))
alarm = bottom == 1 and(rsi(close,14)<overSold)
alertcondition(alarm == 1,title="BUY+RSI",message="BUY+RSI")
Detail
https://www.fmz.com/strategy/429577
Last Modified
2023-10-18 12:27:29