
12 KiB
Name
基均线回环策略Kijun-Loopback-Strategy
Author
ChaoZhang
Strategy Description
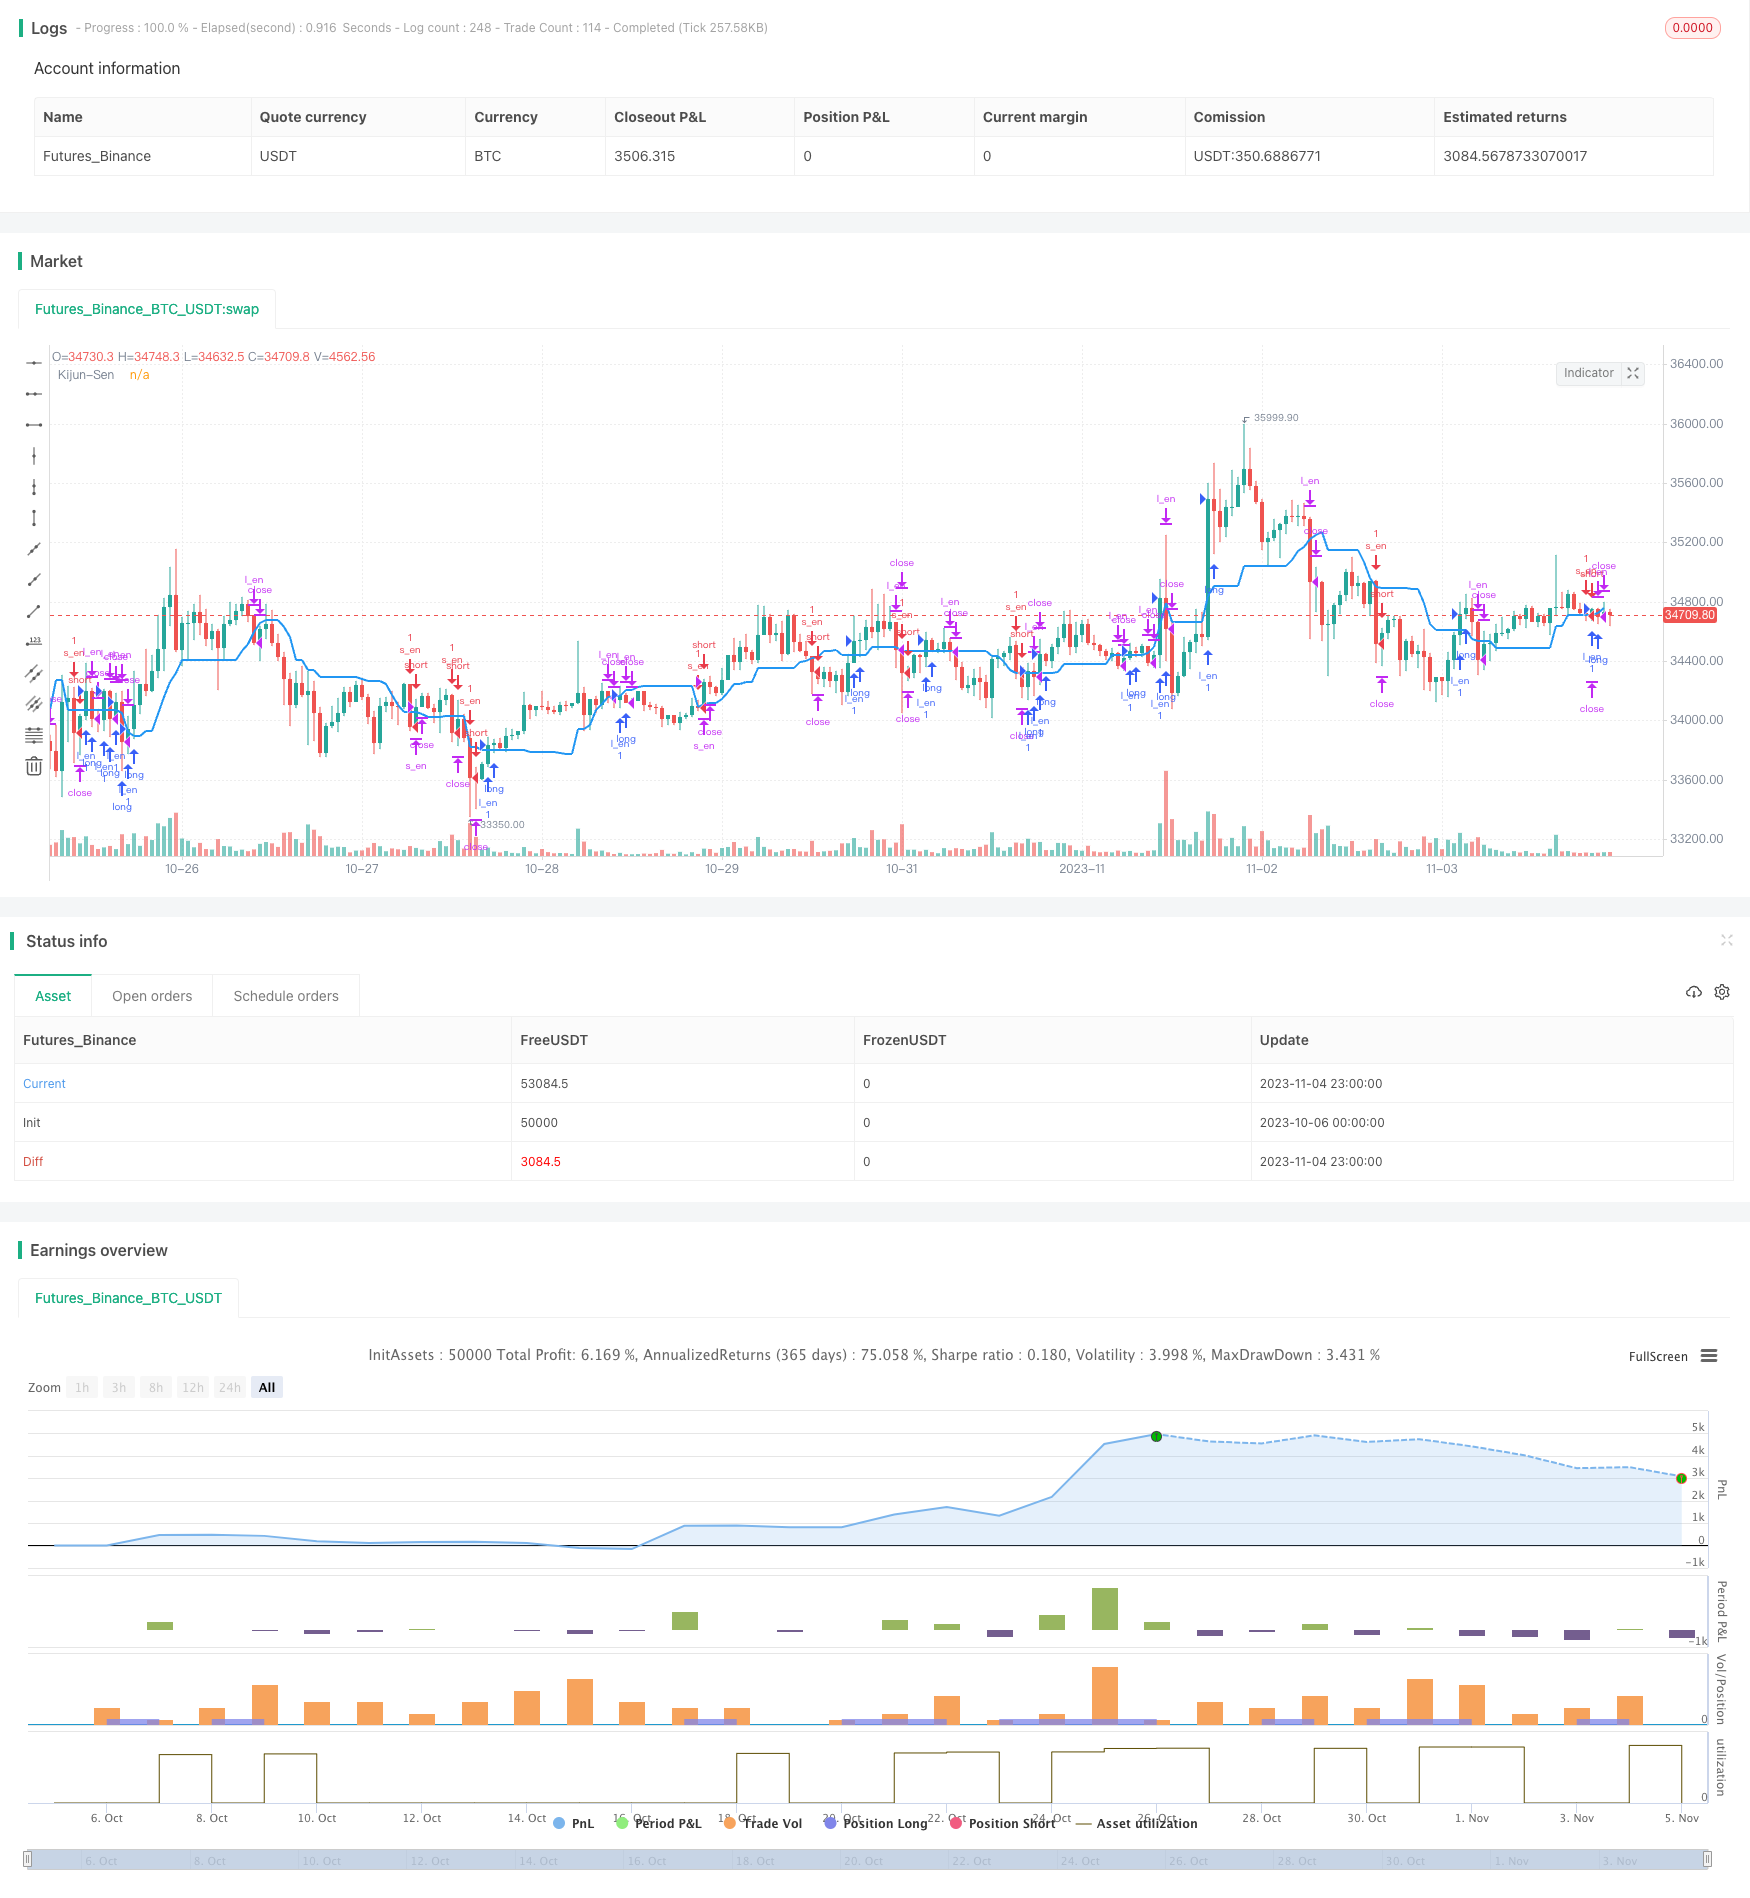 [trans]
概述
基均线回环策略利用Ichimoku云图指标中的基均线(Kijun Sen),根据价格与基均线的交叉做多做空,属于趋势跟随策略。该策略通过基均线的回环来捕捉趋势的转折点,具有趋势捕捉能力强、回撤可控等优势。
策略原理
基均线回环策略使用Ichimoku云图的基均线(Kijun Sen)作为决策的基准线。基均线是根据一定周期内的最高价和最低价计算出的平均线。当价格从基均线下方上穿时,做多;当价格从基均线上方下穿时,做空。这样,就利用基均线的回环来判断价格趋势的转折点,实现趋势跟随。
具体来说,策略通过Base Long和Base Short两个条件判断基均线的回环。Base Long条件为开盘价低于基均线且收盘价高于基均线,表示基均线上穿;Base Short条件为开盘价高于基均线且收盘价低于基均线,表示基均线下穿。当触发Base Long时,做多入场;当触发Base Short时,做空入场。平仓条件则为价格重新跨过基均线,如价格跌破基均线则平多单,价格涨破基均线则平空单。
这样,策略就利用基均线的回环来捕捉价格趋势的转折点,实现了趋势跟随。
优势分析
基均线回环策略具有以下优势:
-
捕捉趋势转折能力强。基均线能很好地反映价格趋势,其回环代表价格趋势的转折,策略能及时捕捉转折点,实现趋势跟随。
-
回撤风险可控。策略通过基均线来限制回撤范围,比简单移动平均线策略更可控回撤风险。
-
实现简单。该策略仅需要基均线一个指标,逻辑简单明了,易于实现。
-
适用范围广。可应用于不同周期和各种主流交易品种,适用面较广。
-
数据需求量小。该策略仅需要价格数据,不需要大量指标计算,数据需求量小。
风险分析
基均线回环策略也存在以下风险:
-
容易产生过多交易信号。基均线存在频繁回环的情况,会导致过于频繁交易,增加交易费用和滑点损失。
-
回撤控制能力有限。基均线能一定程度控制回撤范围,但在价格剧烈波动时,回撤可能依然较大。
-
容易产生错误信号。基均线近期内频繁上下穿越时,会产生错误信号,入场方向与趋势不符。
-
效果与品种相关性较大。不同品种基均线运行效果差异较大,需要针对品种调整参数。
-
仅考虑单一指标。基于单一指标设计,容易受到指标失效的影响。
对应解决方法:
-
优化参数,降低交易频率。
-
增加止损止盈策略,进一步控制回撤。
-
加入过滤器,避免错误信号。
-
针对品种调整参数设置。
-
结合多个指标进行决策。
优化方向
基均线回环策略可从以下方面进行优化:
-
加强趋势判断能力。可引入其他趋势判断指标,如MACD,布林线等,避免基于单一指标出现错误信号。
-
优化参数设置。可通过调整基均线参数,平衡获利速度和胜率。也可以测试不同止损止盈策略。
-
引入交易量特征。根据交易量情况过滤信号,避免不合理信号。
-
多品种通用参数。通过机器学习等方法,获得不同品种通用的参数范围,减少人工调参工作。
-
优化入场时机。可引入其他指标判断力度,选择力度较强的时机入场。
-
优化止损策略。进一步优化止损策略,在保证胜率的前提下尽量减少不必要止损。
-
引入风险管理机制。根据不同市场环境调整仓位和止损策略,主动控制风险。
总结
基均线回环策略利用基均线的回环判断价格趋势,具有捕捉趋势转折、回撤可控等优势。但也存在产生错误信号、回撤控制有限等风险。未来可从优化参数设置、加入辅助判断指标等方面进行改进,使策略更稳健可靠。总体来说,基均线策略较简单实用,适当优化后可成为量化交易的基础策略之一。 ||
Overview
The Kijun Loopback strategy utilizes the Kijun-sen line from the Ichimoku Cloud indicator to determine long and short positions based on price crossover of the Kijun-sen line. It is a trend following strategy. By capturing loopbacks of the Kijun-sen line, this strategy aims to identify trend reversal points effectively with advantages like strong trend catching capability and controllable drawdowns.
Strategy Logic
The Kijun Loopback strategy uses the Kijun-sen line from the Ichimoku Cloud as the baseline for decisions. The Kijun-sen is an average line calculated from the highest and lowest prices over a given period. When the price crosses above the Kijun-sen line, a long position is opened. When the price crosses below the Kijun-sen line, a short position is opened. In this way, the loopbacks of the Kijun-sen line are used to detect turning points in the price trend for trend following.
Specifically, the strategy determines Kijun-sen loopbacks using the Base Long and Base Short conditions. The Base Long condition is open < Kijun-sen and close > Kijun-sen, indicating an upcross of the Kijun-sen line. The Base Short condition is open > Kijun-sen and close < Kijun-sen, indicating a downcross. When Base Long triggers, a long position is opened. When Base Short triggers, a short position is opened. The exit conditions are when the price re-crosses the Kijun-sen in the opposite direction, i.e. close below the Kijun-sen for long trades and close above for short trades.
Thus, the loopbacks of the Kijun-sen line are used to catch trend reversal points for trend following.
Advantage Analysis
The Kijun Loopback strategy has the following advantages:
-
Strong capability in catching trend reversals. The Kijun-sen line reflects price trends well. Its loopbacks represent trend reversals. The strategy can timely catch reversal points for trend following.
-
Controllable drawdown risks. The strategy uses the Kijun-sen to limit drawdown ranges, better than simple moving average strategies.
-
Simple to implement. The strategy needs only one indicator, the Kijun-sen. The logic is simple and clean.
-
Wide applicability. It can be applied on different timeframes and major trading instruments.
-
Low data demand. The strategy needs only price data, without heavy indicator computations.
Risk Analysis
The Kijun Loopback strategy also has the following risks:
-
Tendency to generate excessive trading signals. Frequent Kijun-sen loopbacks can lead to over-trading, increasing costs from commissions and slippage.
-
Limited drawdown control capability. The Kijun-sen can only limit drawdowns to some extent. Drawdowns may still be significant under extreme price swings.
-
Prone to wrong signals. Frequent crosses of the Kijun-sen may generate wrong signals with trend direction.
-
Performance variance among instruments. The Kijun-sen effectiveness varies significantly for different instruments. Parameter tuning is needed for each instrument.
-
Reliance on a single indicator. The single indicator design exposes the strategy to invalidations.
Solutions:
-
Optimize parameters to reduce trade frequency.
-
Add stop loss/profit taking to further control drawdowns.
-
Add filters to avoid wrong signals.
-
Tune parameters by instrument.
-
Incorporate more indicators in decision making.
Enhancement Directions
The Kijun Loopback strategy can be enhanced in the following aspects:
-
Strengthen trend determination. Incorporate additional trend indicators like MACD, Bollinger Bands to avoid reliance on a single indicator.
-
Optimize parameter settings. Adjust Kijun-sen period to balance win rate and profit speed. Test different stop loss/profit taking approaches.
-
Introduce volume analysis. Filter signals by volume to avoid unreasonable trades.
-
Parameter optimization across instruments. Use machine learning to obtain optimal parameter ranges for different instruments.
-
Improve entry timing. Add momentum indicators to enter on stronger momentum.
-
Refine stop loss strategy. Optimize stops to reduce unnecessary stop outs while maintaining win rate.
-
Incorporate risk management mechanisms. Dynamically adjust position sizing and stop loss based on changing market conditions for active risk control.
Summary
The Kijun Loopback strategy captures trend reversals using Kijun-sen loopbacks. It has advantages like strong trend catching and controllable drawdowns. But risks like wrong signals and drawdown control limitations exist. Future enhancements may include parameter optimization, adding auxiliary indicators etc. Overall, the Kijun strategy is simple and practical. With proper enhancements, it can become a solid core strategy in quantitative trading.
[/trans]
Strategy Arguments
| Argument | Default | Description |
|---|---|---|
| v_input_1 | 14 | Average True Range Period |
| v_input_2 | 20 | Kijun Sen Period |
| v_input_3 | 4 | Risk % |
| v_input_4 | 30 | Equity Protection % |
| v_input_5 | 1.5 | Average True Range multiplier |
| v_input_6 | 100 | Target TP in Points |
Source (PineScript)
/*backtest
start: 2023-10-06 00:00:00
end: 2023-11-05 00:00:00
period: 1h
basePeriod: 15m
exchanges: [{"eid":"Futures_Binance","currency":"BTC_USDT"}]
*/

//@version=4
strategy("Master VP","MVP",true)

//INDICATOR---------------------------------------------------------------------
    //Average True Range (1. RISK)
atr_period = input(14, "Average True Range Period")
atr = atr(atr_period)

    //Ichimoku Cloud - Kijun Sen (2. BASELINE)
ks_period = input(20, "Kijun Sen Period")
kijun_sen = (highest(high, ks_period) + lowest(low,ks_period))/2
base_long = open < kijun_sen and close > kijun_sen
base_short = open > kijun_sen and close < kijun_sen

//TRADE LOGIC-------------------------------------------------------------------
    //Long Entry
    //if -> WPR crosses below -39 AND MACD line is less than signal line
l_en = base_long
    //Long Exit
    //if -> WPR crosses above -14
l_ex = close < kijun_sen
    //Short Entry
    //if -> WPR crosses above -39 AND MACD line is greater than signal line
s_en = base_short
    //Short Exit
    //if -> WPR crosses under -14
s_ex = close > kijun_sen
strategy.initial_capital = 50000
//MONEY MANAGEMENT--------------------------------------------------------------
balance = strategy.netprofit + strategy.initial_capital //current balance
floating = strategy.openprofit          //floating profit/loss
risk = input(4,"Risk %")/100           //risk % per trade
equity_protector = input(30,"Equity Protection %")/100  //equity protection %
stop = atr*100000*input(1.5,"Average True Range multiplier")    //Stop level
target = input(100, "Target TP in Points")  //TP level
    //Calculate current DD and determine if stopout is necessary
equity_stopout = false
if(floating<0 and abs(floating/balance)>equity_protector)
    equity_stopout := true

    //Calculate the size of the next trade
temp01 = balance * risk     //Risk in USD
temp02 = temp01/stop        //Risk in lots
temp03 = temp02*100000      //Convert to contracts
size = temp03 - temp03%1000 //Normalize to 1000s (Trade size)
if(size < 1000)
    size := 1000            //Set min. lot size

//TRADE EXECUTION---------------------------------------------------------------
strategy.close_all(equity_stopout)      //Close all trades w/equity protector
is_open = strategy.opentrades > 0

if true
    strategy.entry("l_en",true,oca_name="a",when=l_en and not is_open)  //Long entry
    strategy.entry("s_en",false,oca_name="a",when=s_en and not is_open) //Short entry

    strategy.exit("S/L","l_en",loss=stop, profit=target)      //Long exit (stop loss)
    strategy.close("l_en",when=l_ex)            //Long exit (exit condition)
    strategy.exit("S/L","s_en",loss=stop, profit=target)      //Short exit (stop loss)
    strategy.close("s_en",when=s_ex)            //Short exit (exit condition)

//PLOTTING----------------------------------------------------------------------
plot(kijun_sen,"Kijun-Sen",color.blue,2)
Detail
https://www.fmz.com/strategy/431282
Last Modified
2023-11-06 16:46:45