
19 KiB
Name
基于TFO和ATR的趋势跟踪止损策略TFO-and-ATR-Based-Trend-Tracking-Stop-Loss-Strategy
Author
ChaoZhang
Strategy Description
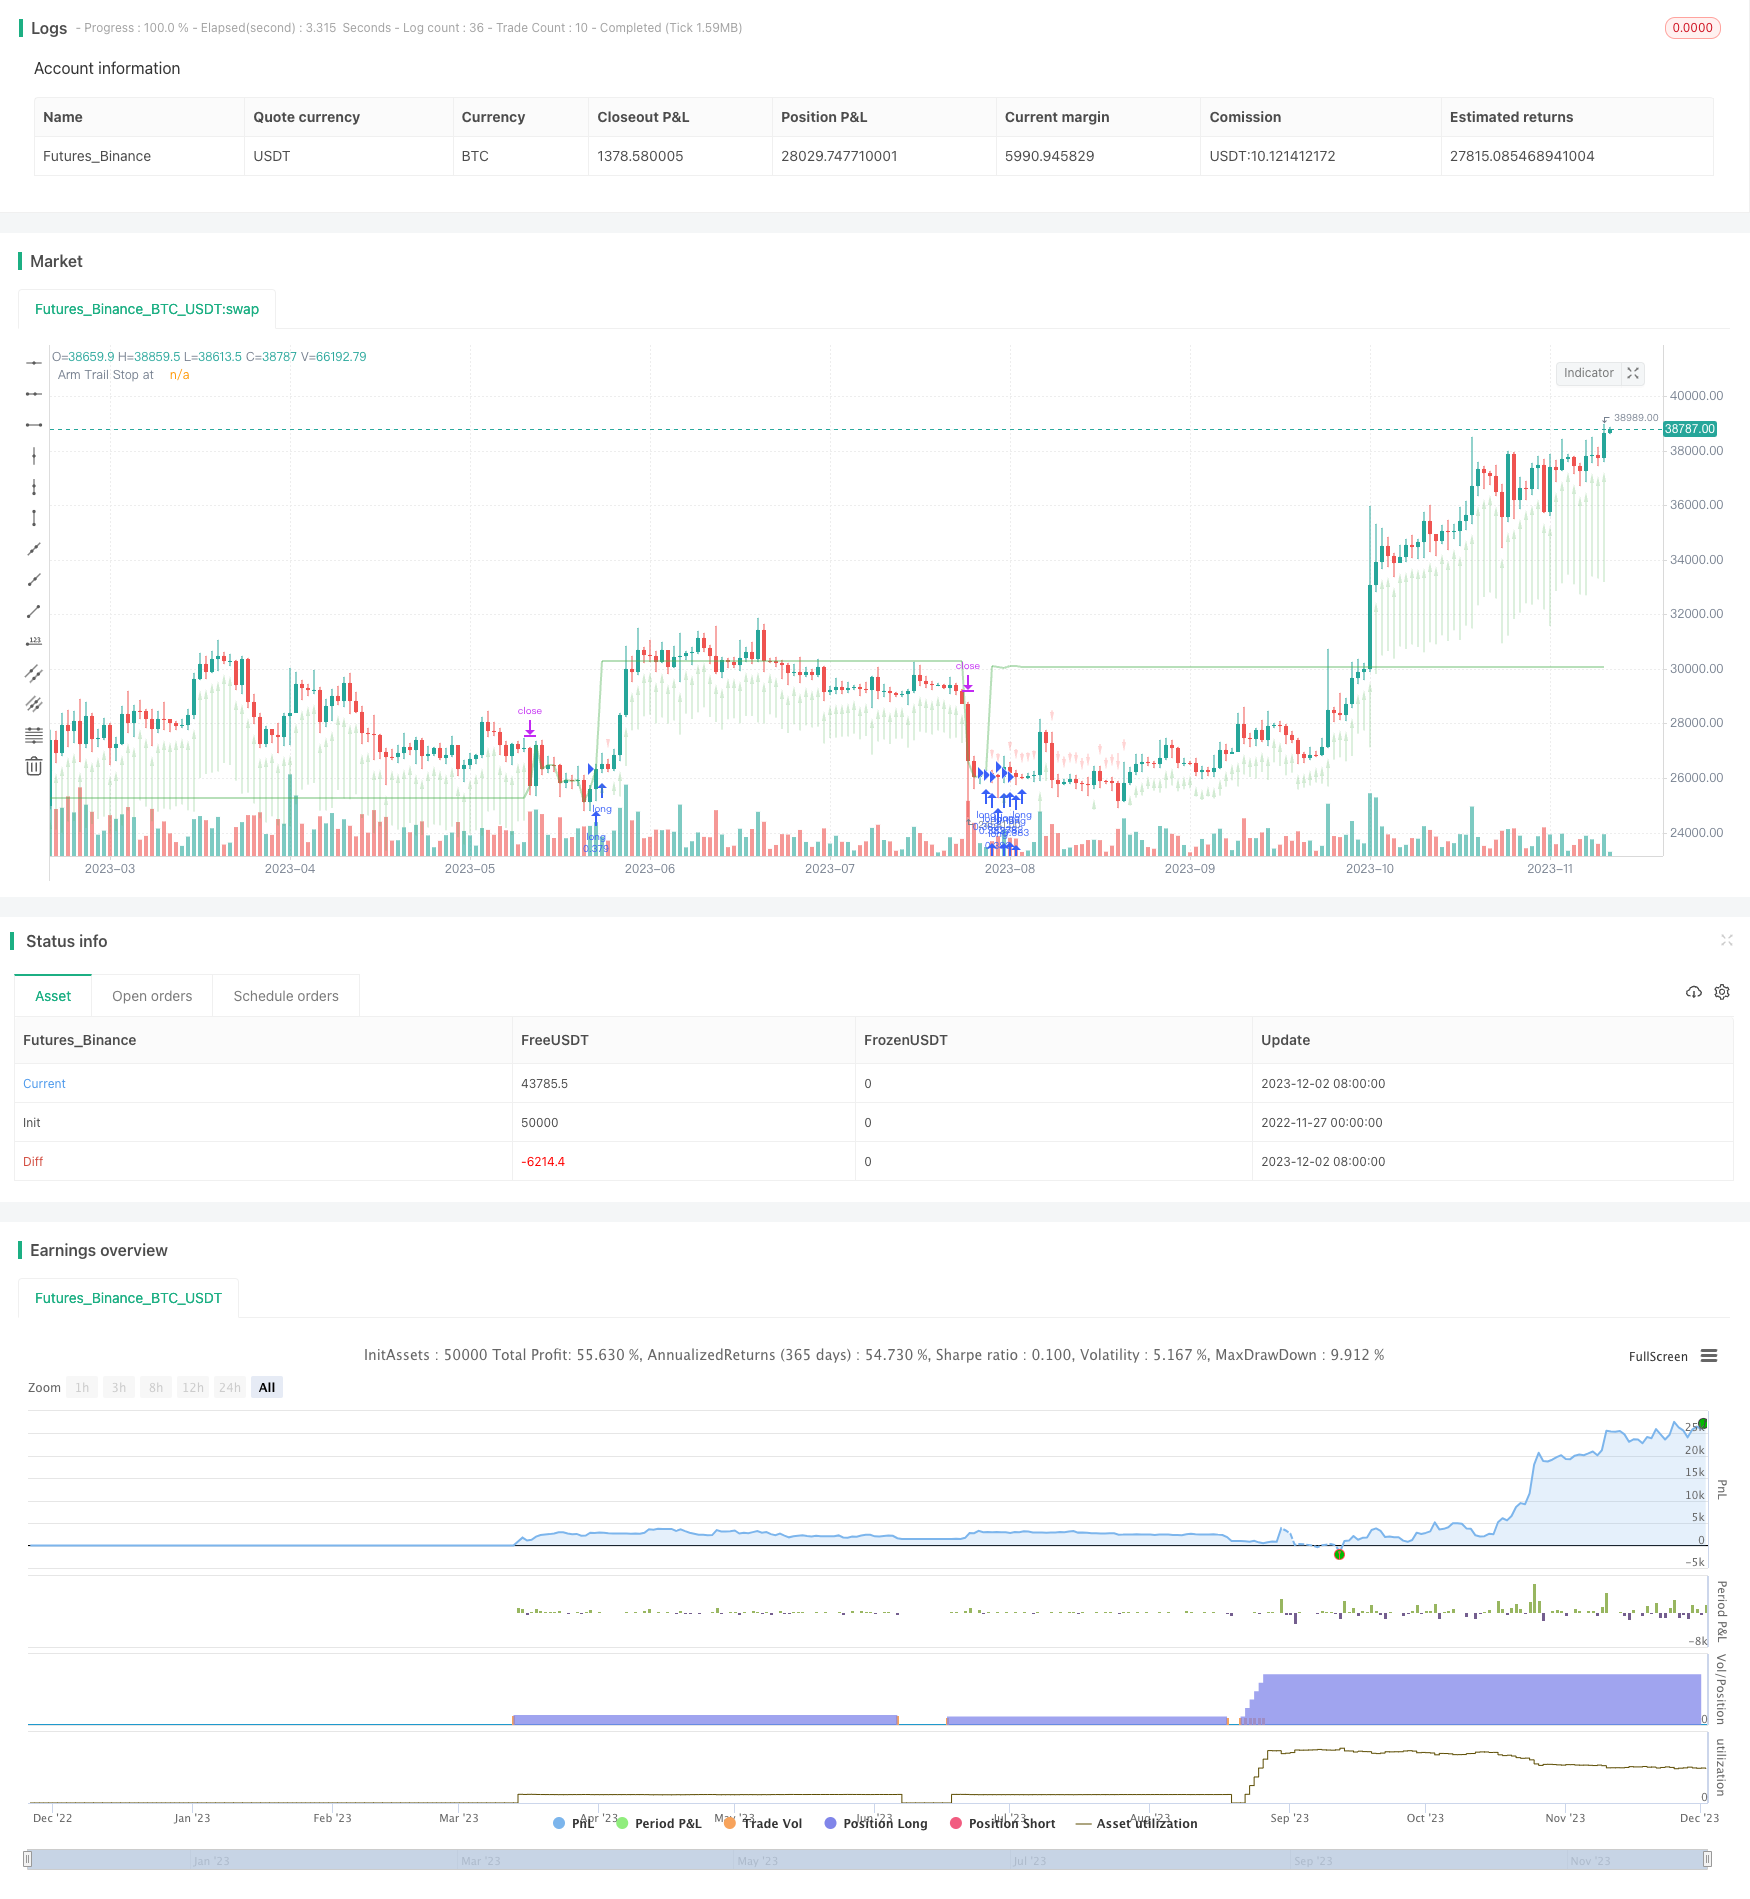 [trans]
概述
该策略是基于Dr. John Ehlers的趋势弹性振荡器(Trend Flex Oscillator,TFO)和平均真实波动范围(Average True Range,ATR)指标设计的一个趋势跟踪止损策略。它适用于多头市场,当Oversold后的价格出现反转时会打开多头仓位。它通常会在几天内平仓,除非被熊市捕获,在这种情况下它会固守仓位。该策略通过简单的回测来调整可配置的参数,但是不应该完全相信回测结果。
策略原理
该策略结合了TFO和ATR两个指标,在符合买入条件时开多仓,在符合卖出条件时平仓。
买入条件:当TFO低于某个阈值(表示过度空头),并且上一根K线的TFO值低于当前K线时(表示TFO反转上涨),同时ATR高于设定的波动门槛时(表示市场波动加大),满足这三个条件则开多仓。
平仓条件:当TFO高于某个阈值(表示过度多头)时,同时ATR高于设定门槛时,满足条件则平掉所有多仓。此外,该策略还设置了跟踪止损,当价格跌破设定的跟踪止损价位时,也会平掉所有多仓。用户可以选择让策略根据指标信号平仓,或只按照止损价位平仓。
该策略最多可同时开15个多头仓位。其参数可以调整,适用于不同时间周期。
策略优势
-
结合趋势和波动度判断市场方向,比较稳定。TFO能捕捉突破趋势的早期信号,ATR能把握市场波动加大的时机。
-
设置了可调的买卖参数和止损参数,操作灵活。用户可以根据市场调整参数,实现最优化。
-
内置了止损功能,可以减少极端行情的损失。止损策略是量化交易中非常重要的一环。
-
支持追加开仓和部分平仓,可以通过加大仓位来放大盈利。适合看多的行情。
策略风险
-
该策略只做多,不做空,无法在跌市中盈利。如果遇到惨烈的熊市行情,可能造成巨额损失。
-
参数设置不当可能导致过度交易或漏买漏卖。需要反复测试找到最佳参数组合。
-
在极端行情时,止损可能无效,无法阻止巨额亏损的发生。这是所有止损策略都可能面临的问题。
-
回测并不能完全反映实盘交易情况,实盘结果会与之存在一定偏差。
策略优化
-
可以考虑在卖出条件中加入移动止损线,让策略及时止损,有效控制下行风险。
-
可以扩展做空机制,在TFO反转下跌且ATR足够大时开空仓,使策略能适用于空头市场。
-
可以加入更多过滤条件,例如成交量变化,减少异常行情对策略的影响。
-
可以测试不同时间周期的参数设置和回测结果,寻找最佳周期及参数组合。
总结
该策略整合了趋势分析和波动度监测的优势,通过TFO和ATR的指标组合判断市场方向;设置了追加开仓、部分平仓、移动止损等机制,可以放大获利并控制风险,适合多头行情;还有可扩展的优化空间,通过加入更多指标过滤和参数调优可以进一步改进策略表现。基本实现了一个量化策略的基本功能要求,值得深入研究和应用。
||
Overview
This strategy is designed based on Dr. John Ehlers' Trend Flex Oscillator (TFO) and Average True Range (ATR) indicators. It is suitable for bull markets and will open long positions when oversold price action appears to reverse. It typically closes positions within a few days unless caught in a bear market, in which case it holds on. This strategy simplifies backtesting by making parameters configurable, but backtest results should never be fully trusted.
Strategy Logic
This strategy combines the TFO and ATR indicators to determine entries and exits.
Entry conditions: When TFO drops below a threshold (indicating oversold levels) and TFO has risen from the previous bar (indicating TFO reversal upwards), and ATR is above a set volatility threshold (indicating increasing market volatility), long positions are opened.
Exit conditions: When TFO rises above a threshold (indicating overbought levels) and ATR is above a set threshold, all long positions are closed. In addition, a trailing stop loss exits all positions when price drops below the trailing stop level. Users can choose to allow the strategy to exit based on indicator signals or based solely on the stop loss.
The strategy allows up to 15 simultaneous long positions. Parameters can be adjusted for different timeframes.
Advantages
-
Combining trend and volatility analysis provides steady signals. TFO captures early trend reversal signals and ATR identifies surge in volatility.
-
Adjustable entry, exit and stop loss parameters provide flexibility. Users can optimize based on market conditions.
-
Built-in stop loss protects against extreme moves. Stop losses are essential in quant trading.
-
Support for pyramiding and partial exits allows profit compounding in bull markets.
Risks
-
Long only, no shorting mechanism. Cannot profit from falling markets. Severe bear markets can cause huge losses.
-
Poor parameter tuning can cause over trading or missed entries and exits. Extensive testing is needed to find optimal parameters.
-
In extreme moves, stop loss can fail and not prevent huge losses. A limitation of all stop loss strategies.
-
Backtest does not fully reflect live performance. Expect some deviation.
Enhancement Opportunities
-
A moving stop loss line can be added for timely exits and better downside protection.
-
Shorting mechanism can be added to allow profits during market drops when TFO reverses downwards and ATR is high enough.
-
More filters like volume change can reduce impacts of erratic price moves.
-
Different timeframes and parameters can be tested to find the best performing combination.
Conclusion
This strategy combines the strengths of trend and volatility analysis using TFO and ATR to determine market direction. Mechanisms like pyramiding, partial close and trailing stop loss allow profit compounding while controlling risk during bull markets. There is room for improvements via more indicators filters and parameter optimization. It achieves the basic goals of a quant strategy and merits further research and application.
[/trans]
Strategy Arguments
| Argument | Default | Description |
|---|---|---|
| v_input_int_1 | 9 | (?Back-Testing Start Date)From Month |
| v_input_int_2 | true | From Day |
| v_input_int_3 | 2021 | From Year |
| v_input_int_4 | 3 | (?Average True Range)Min Volatility for Buy |
| v_input_int_5 | 13 | Min Volatility for Sell |
| v_input_bool_1 | false | Average the Volatility over 3 bars |
| v_input_float_1 | 1.2 | (?Trend Flex Ocillator)TFO Upper Level |
| v_input_float_2 | -0.9 | TFO Lower Level |
| v_input_int_6 | 14 | TrendFlex Period |
| v_input_bool_2 | true | (?Selling Conditions)Allow Stategy to close positions |
| v_input_int_7 | false | Value (%) must exceed |
| v_input_bool_3 | true | Set Trailing Stop Loss on avg positon value |
| v_input_float_3 | 15 | Trailing Stop Arms At (%) |
| v_input_float_4 | 2 | Trailing Stop Loss (%) |
Source (PineScript)
/*backtest
start: 2022-11-27 00:00:00
end: 2023-12-03 00:00:00
period: 1d
basePeriod: 1h
exchanges: [{"eid":"Futures_Binance","currency":"BTC_USDT"}]
*/

// This source code is subject to the terms of the Mozilla Public License 2.0 at https://mozilla.org/MPL/2.0/
// © Chart0bserver
//
// Open Source attributions:
// portions © allanster (date window code)
// portions © Dr. John Ehlers (Trend Flex Oscillator)
//
// READ THIS CAREFULLY!!! ----------------//
// This code is provided for educational purposes only.  The results of this strategy should not be considered investment advice.
// The user of this script acknolwedges that it can cause serious financial loss when used as a trading tool
// This strategy has a bias for HODL (Holds on to Losses) meaning that it provides NO STOP LOSS protection!
// Also note that the default behavior is designed for up to 15 open long orders, and executes one order to close them all at once.
// Opening a long position is predicated on The Trend Flex Oscillator (TFO) rising after being oversold, and ATR above a certain volatility threshold.
// Closing a long is handled either by TFO showing overbought while above a certain ATR level, or the Trailing Stop Loss.  Pick one or both.
// If the strategy is allowed to sell before a Trailing Stop Loss is triggered, you can set a "must exceed %".  Do not mistake this for a stop loss.
// Short positions are not supported in this version.  Back-testing should NEVER be considered an accurate representation of actual trading results.

//@version=5
strategy('TFO + ATR Strategy with Trailing Stop Loss', 'TFO ATR Trailing Stop Loss', overlay=true, pyramiding=15, default_qty_type=strategy.cash, default_qty_value=10000, initial_capital=150000, currency='USD', commission_type=strategy.commission.percent, commission_value=0.5)
strategy.risk.allow_entry_in(strategy.direction.long)  // There will be no short entries, only exits from long.

// -----------------------------------------------------------------------------------------------------------//
// Back-testing Date Range code  ----------------------------------------------------------------------------//
// ---------------------------------------------------------------------------------------------------------//
fromMonth = input.int(defval=9, title='From Month', minval=1, maxval=12, group='Back-Testing Start Date')
fromDay = input.int(defval=1, title='From Day', minval=1, maxval=31, group='Back-Testing Start Date')
fromYear = input.int(defval=2021, title='From Year', minval=1970, group='Back-Testing Start Date')
thruMonth = 1       //input(defval = 1,    title = "Thru Month",      type = input.integer, minval = 1, maxval = 12, group="Back-Testing Date Range")
thruDay = 1         //input(defval = 1,    title = "Thru Day",        type = input.integer, minval = 1, maxval = 31, group="Back-Testing Date Range")
thruYear = 2112     //input(defval = 2112, title = "Thru Year",       type = input.integer, minval = 1970, group="Back-Testing Date Range")

// === FUNCTION EXAMPLE ===
start = timestamp(fromYear, fromMonth, fromDay, 00, 00)  // backtest start window
finish = timestamp(thruYear, thruMonth, thruDay, 23, 59)  // backtest finish window
window() =>  // create function "within window of time
    time >= start and time <= finish ? true : false
// Date range code -----//


// -----------------------------------------------------------------------------------------------------------//
// ATR Indicator Code  --------------------------------------------------------------------------------------//
// ---------------------------------------------------------------------------------------------------------//
length = 18  //input(title="ATR Length", defval=18, minval=1)
Period = 18  //input(18,title="ATR EMA Period")

basicEMA = ta.ema(close, length)
ATR_Function = ta.ema(ta.tr(true), length)
EMA_ATR = ta.ema(ATR_Function, Period)
ATR = ta.ema(ta.tr(true), length)
ATR_diff = ATR - EMA_ATR
volatility = 100 * ATR_diff / EMA_ATR  // measure of spread between ATR and EMA
volatilityAVG = math.round((volatility + volatility[1] + volatility[2]) / 3)
buyVolatility = input.int(3, 'Min Volatility for Buy', minval=-20, maxval=20, step=1, group='Average True Range')
sellVolatility = input.int(13, 'Min Volatility for Sell', minval=-10, maxval=20, step=1, group='Average True Range')
useAvgVolatility = input.bool(defval=false, title='Average the Volatility over 3 bars', group='Average True Range')
// End of ATR  ------------/


// -----------------------------------------------------------------------------------------------------------//
// TFO Indicator code  --------------------------------------------------------------------------------------//
// ---------------------------------------------------------------------------------------------------------//
trendflex(Series, PeriodSS, PeriodTrendFlex, PeriodEMA) =>
    var SQRT2xPI = math.sqrt(8.0) * math.asin(1.0)  // 4.44288293815 Constant
    alpha = SQRT2xPI / PeriodSS
    beta = math.exp(-alpha)
    gamma = -beta * beta
    delta = 2.0 * beta * math.cos(alpha)
    float superSmooth = na
    superSmooth := (1.0 - delta - gamma) * (Series + nz(Series[1])) * 0.5 + delta * nz(superSmooth[1]) + gamma * nz(superSmooth[2])
    E = 0.0
    for i = 1 to PeriodTrendFlex by 1
        E += superSmooth - nz(superSmooth[i])
        E
    epsilon = E / PeriodTrendFlex
    zeta = 2.0 / (PeriodEMA + 1.0)
    float EMA = na
    EMA := zeta * epsilon * epsilon + (1.0 - zeta) * nz(EMA[1])
    return_1 = EMA == 0.0 ? 0.0 : epsilon / math.sqrt(EMA)
    return_1

upperLevel = input.float(1.2, 'TFO Upper Level', minval=0.1, maxval=2.0, step=0.1, group='Trend Flex Ocillator')
lowerLevel = input.float(-0.9, 'TFO Lower Level', minval=-2.0, maxval=-0.1, step=0.1, group='Trend Flex Ocillator')
periodTrendFlex = input.int(14, 'TrendFlex Period', minval=2, group='Trend Flex Ocillator')
useSuperSmootherOveride = true  //input( true, "Apply SuperSmoother Override Below*", input.bool, group="Trend Flex Ocillator")
periodSuperSmoother = 8.0       //input(8.0, "SuperSmoother Period*", input.float  , minval=4.0, step=0.5, group="Trend Flex Ocillator")
postSmooth = 33                 //input(33.0, "Post Smooth Period**", input.float  , minval=1.0, step=0.5, group="Trend Flex Ocillator")

trendFlexOscillator = trendflex(close, periodSuperSmoother, periodTrendFlex, postSmooth)
// End of TFO -------------//


// -----------------------------------------------------------------------------------------------------------//
// HODL Don't sell if losing n% ---------------------------------------------------------------------------- //
// ---------------------------------------------------------------------------------------------------------//
sellOnStrategy = input.bool(defval=true, title='Allow Stategy to close positions', group='Selling Conditions')
doHoldLoss = true       // input(defval = true, title = "Strategy can sell for a loss", type = input.bool, group="Selling Conditions")
holdLoss = input.int(defval=0, title='Value (%) must exceed ', minval=-25, maxval=10, step=1, group='Selling Conditions')
totalInvest = strategy.position_avg_price * strategy.position_size
openProfitPerc = strategy.openprofit / totalInvest
bool acceptableROI = openProfitPerc * 100 > holdLoss
// -----------------------//


// -----------------------------------------------------------------------------------------------------------//
// Buying and Selling conditions  -------------------------------------------------------------------------- //
// ---------------------------------------------------------------------------------------------------------//
if useAvgVolatility
    volatility := volatilityAVG
    volatility
tfoBuy = trendFlexOscillator < lowerLevel and trendFlexOscillator[1] < trendFlexOscillator  // Always make a purchase if TFO is in this lowest range
atrBuy = volatility > buyVolatility
tfoSell = ta.crossunder(trendFlexOscillator, upperLevel)
consensusBuy = tfoBuy and atrBuy
consensusSell = tfoSell and volatility > sellVolatility
if doHoldLoss
    consensusSell := consensusSell and acceptableROI
    consensusSell
// --------------------//


// -----------------------------------------------------------------------------------------------------------//
// Tracing & Debugging --------------------------------------------------------------------------------------//
// ---------------------------------------------------------------------------------------------------------//

plotchar(strategy.opentrades, 'Number of open trades', ' ', location.top)
plotarrow(100 * openProfitPerc, 'Profit on open longs', color.new(color.green, 75), color.new(color.red, 75))
// plotchar(strategy.position_size, "Shares on hand", " ", location.top)
// plotchar(totalInvest, "Total Invested", " ", location.top)
// plotarrow(strategy.openprofit, "Open profit dollar amount", color.new(color.green,100), color.new(color.red, 100))
// plotarrow(strategy.netprofit, "Net profit for session", color.new(color.green,100), color.new(color.red, 100))
// plotchar(acceptableROI, "Acceptable ROI", " ", location.top)
// plotarrow(volatility, "ATR volatility value", color.new(color.green,75), color.new(color.red, 75))
// plotchar(strategy.position_avg_price, "Avgerage price of holdings", " ", location.top)
// plotchar(volatilityAVG, "AVG volatility", " ", location.top)
// plotchar(fiveBarsVal, "change in 5bars", " ", location.top)
// plotchar(crossingUp, "crossingUp", "x",  location.belowbar, textcolor=color.white)
// plotchar(crossingDown, "crossingDn", "x",  location.abovebar, textcolor=color.white)
// plotchar(strategy.closedtrades, "closedtrades", " ", location.top)
// plotchar(strategy.wintrades, "wintrades", " ", location.top)
// plotchar(strategy.losstrades, "losstrades", " ", location.top)
// plotchar(close, "close", " ", location.top)
//--------------------//

// -----------------------------------------------------------------------------------------------------------//
// Trade Alert Execution ------------------------------------------------------------------------------------//
// ---------------------------------------------------------------------------------------------------------//

strategy.entry('long', strategy.long, when=window() and consensusBuy, comment='long')
if sellOnStrategy
    strategy.close('long', when=window() and consensusSell, qty_percent=100, comment='Strat')


// -----------------------------------------------------------------------------------------------------------//
// Trailing Stop Loss logic -------------------------------------------------------------------------------- //
// ---------------------------------------------------------------------------------------------------------//
useTrailStop = input.bool(defval=true, title='Set Trailing Stop Loss on avg positon value', group='Selling Conditions')
arm = input.float(defval=15, title='Trailing Stop Arms At (%)', minval=1, maxval=30, step=1, group='Selling Conditions') * 0.01
trail = input.float(defval=2, title='Trailing Stop Loss (%)', minval=0.25, maxval=9, step=0.25, group='Selling Conditions') * 0.1

longStopPrice = 0.0
stopLossPrice = 0.0

if strategy.position_size > 0
    longStopPrice := strategy.position_avg_price * (1 + arm)
    stopLossPrice := strategy.position_avg_price * ((100 - math.abs(holdLoss)) / 100)  // for use with 'stop' in strategy.exit
    stopLossPrice
else
    longStopPrice := close
    longStopPrice

// If you want to hide the Trailing Stop Loss threshold (green line), comment this out
plot(longStopPrice, 'Arm Trail Stop at', color.new(color.green, 60), linewidth=2)

if strategy.position_size > 0 and useTrailStop
    strategy.exit('exit', 'long', when=window(), qty_percent=100, trail_price=longStopPrice, trail_offset=trail * close / syminfo.mintick, comment='Trail')

//-----------------------------------------------------------------------------------------------------------//
Detail
https://www.fmz.com/strategy/434164
Last Modified
2023-12-04 13:32:41