
6.0 KiB
Name
基于SMA的多空策略SMA-Based-Dual-Thrust-Strategy
Author
ChaoZhang
Strategy Description
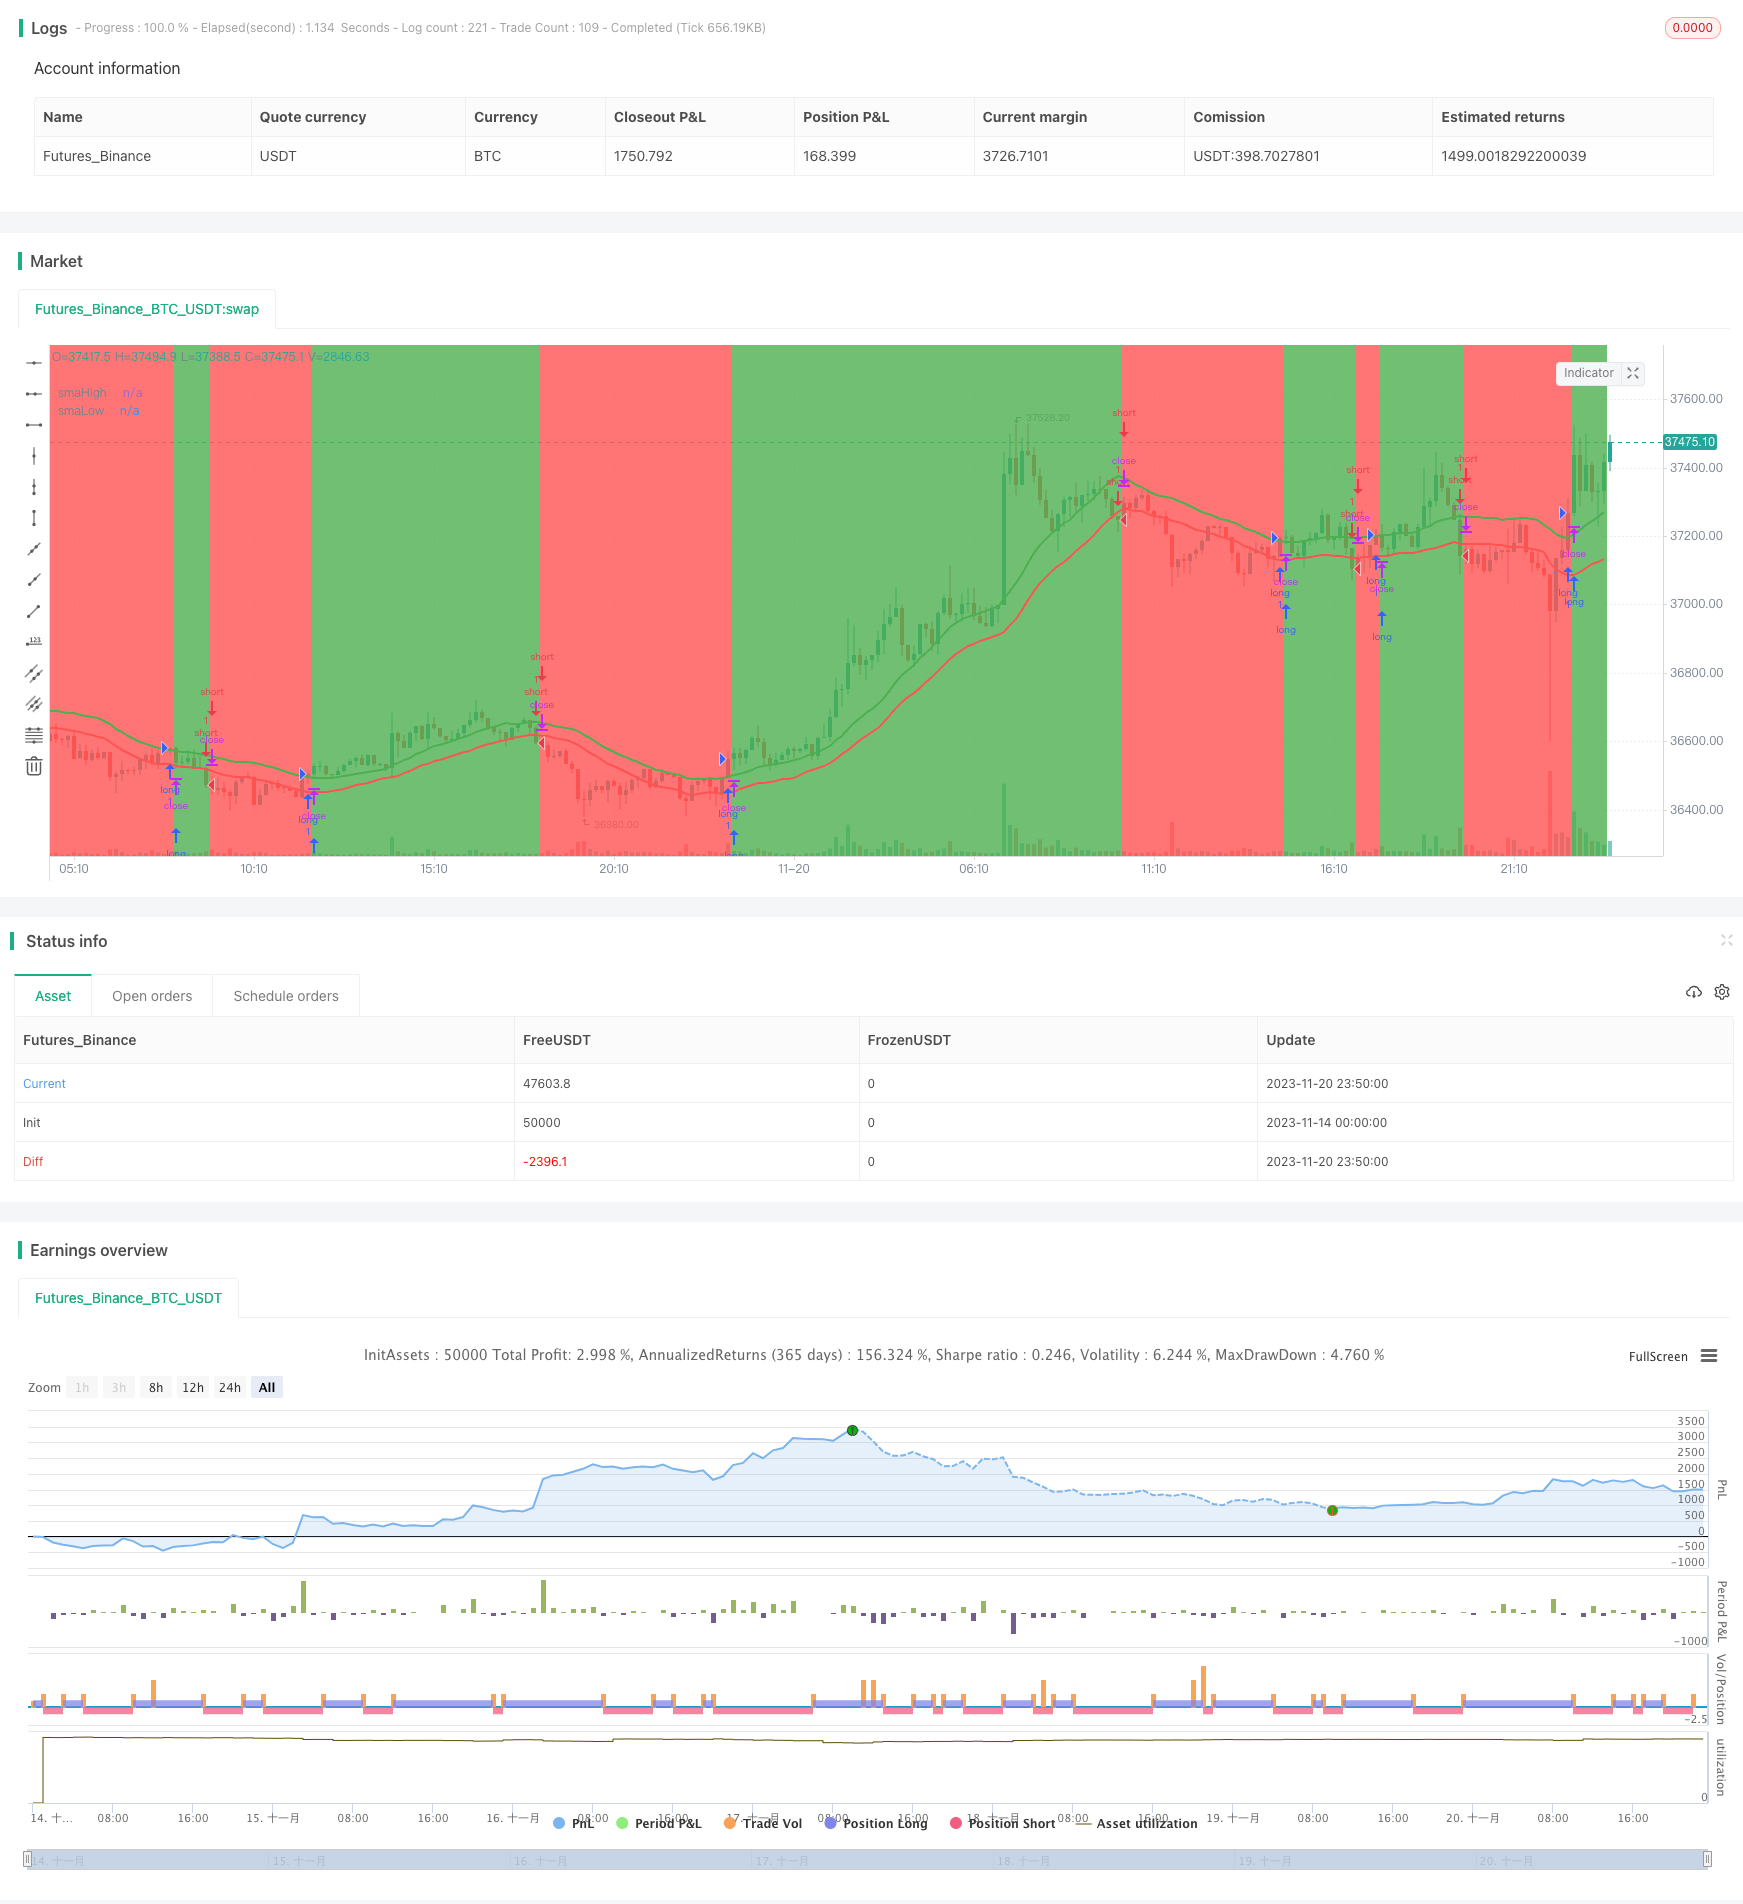 [trans]
概述
本策略基于SMA指标构建了一个简单的多空策略。当价格上穿20周期高点SMA时做多,当价格下破20周期低点SMA时做空。同时设置了止损退出机制。
策略原理
本策略使用20周期的highest高价和lowest低价的SMA作为判断多空的指标。当价格上穿highest SMA时,认为目前处于上涨趋势,这时做多;当价格下破lowest SMA时,认为目前处于下跌趋势,这时做空。
具体来说,策略首先计算20周期highest高价和lowest低价的SMA,并画出指标线。然后设置如下交易逻辑:
多头入场:收盘价上穿highest SMA时 多头出场:收盘价下破0.99倍highest SMA时
空头入场:收盘价下破lowest SMA时
空头出场:收盘价上穿1.01倍lowest SMA时
这样,就构建了一个跟随趋势运行的多空策略。
优势分析
这种策略具有以下几个优势:
- 使用SMA指标判断趋势方向简单实用
2.HIGHEST SMA和LOWEST SMA作为支撑阻力线,发挥指标的重要作用
3.止损设计合理,最大程度避免巨额损失 4.适用性强,多种时间周期和品种都可使用
风险分析
该策略也存在一定的风险:
- SMA指标存在滞后,可能错过趋势转折点
- 无关市场突发事件的防范措施
- 没有考虑交易成本的影响
可以通过结合其他指标、设置止损、优化参数等方式来控制和降低这些风险。
优化方向
本策略还可以从以下几个方面进行优化:
- 结合其他指标判断趋势,例如MACD、KDJ等
- 添加对突发事件的防范机制,例如停牌、限价等异常情况的处理
- 优化SMA周期参数,寻找最佳参数组合
- 考虑不同品种、不同时间周期的最佳参数
- 评估交易成本的影响,设定最佳的止损位和止盈位
总结
本策略整体思路清晰、易于实现,通过SMA指标判断多空趋势,设置合理的入场退出机制,可以获得不错的效果。有进一步优化的空间,若配合其他指标和技巧,可以成为一个值得长期跟踪的having良好潜力的策略。
||
Overview
This strategy builds a simple dual thrust strategy based on the SMA indicator. It goes long when the price crosses above the 20-period highest SMA and goes short when the price crosses below the 20-period lowest SMA. Stop loss exits are also set.
Strategy Logic
This strategy uses the 20-period SMA of highest high price and lowest low price to determine the direction for trading. When price crosses above the highest SMA, it is considered as an uptrend, so go long. When price crosses below the lowest SMA, it is considered as a downtrend, so go short.
Specifically, the strategy first calculates the 20-period SMA of highest high and lowest low prices, and plots the indicator lines. The following trading logic is then set:
Long entry: Close price crosses above highest SMA
Long exit: Close price crosses below 0.99 * highest SMA
Short entry: Close price crosses below lowest SMA
Short exit: Close price crosses above 1.01 * lowest SMA
So an trend following dual thrust strategy is built.
Advantage Analysis
This strategy has the following advantages:
- Using SMA to determine trend direction is simple and practical
- Highest SMA and Lowest SMA act as support/resistance lines
- Reasonable stop loss design to maximize protection from huge losses
- Good adaptability, can be used on different products and timeframes
Risk Analysis
There are also some risks with this strategy:
- SMA has lagging effect, may miss trend turning points
- No protection from market sudden events
- Trading cost impact not considered
These risks can be controlled and reduced in ways like combining other indicators, setting stop loss, parameter tuning etc.
Improvement Directions
This strategy can also be improved in the following aspects:
- Combine other indicators like MACD, KDJ to determine trend
- Add protection for sudden events like suspension, price limiting etc
- Optimize SMA periods, find the best parameter combination
- Find best parameters for different products and timeframes
- Estimate trading cost impact, set optimal stop loss and take profit
Conclusion
The overall logic of this strategy is clear and easy to implement. By using SMA to determine trend direction, and setting reasonable entry/exit rules, good results can be achieved. There is room for further optimization, and by combining with other techniques, it can become a promising strategy worth long term tracking.
[/trans]
Source (PineScript)
/*backtest
start: 2023-11-14 00:00:00
end: 2023-11-21 00:00:00
period: 10m
basePeriod: 1m
exchanges: [{"eid":"Futures_Binance","currency":"BTC_USDT"}]
*/

// This source code is subject to the terms of the Mozilla Public License 2.0 at https://mozilla.org/MPL/2.0/
// © AlanAntony

//@version=4


strategy("ma 20 high-low",overlay=true)

//compute the indicators

smaH = sma(high, 20)
smaL = sma(low, 20)


//plot the indicators
plot(smaH,title="smaHigh", color=color.green, linewidth=2)


plot(smaL,title="smaLow", color=color.red, linewidth=2)


//trading logic
enterlong = crossover(close,smaH) //positive ema crossover
exitlong = crossunder(close,0.99*smaH)  //exiting long


entershort = crossunder(close,smaL) //negative EMA Crossover
exitshort = crossover(close,1.01*smaH) //exiting shorts


notintrade = strategy.position_size<=0
bgcolor(notintrade ? color.red:color.green)

//execution logic

start = timestamp(2015,6,1,0,0)
//end = timestamp(2022,6,1,0,0)

if time >= start
    strategy.entry( "long", strategy.long,1, when = enterlong)
    strategy.entry( "short", strategy.short,1, when = entershort)

    strategy.close("long", when = exitlong)
    strategy.close("short", when = exitshort)

//if time >= end
   // strategy.close_all()
Detail
https://www.fmz.com/strategy/432896
Last Modified
2023-11-22 15:42:29