
7.3 KiB
Name
基于SMA和PSAR指标的多空策略SMA-and-PSAR-Strategy-for-Spot-Trading
Author
ChaoZhang
Strategy Description
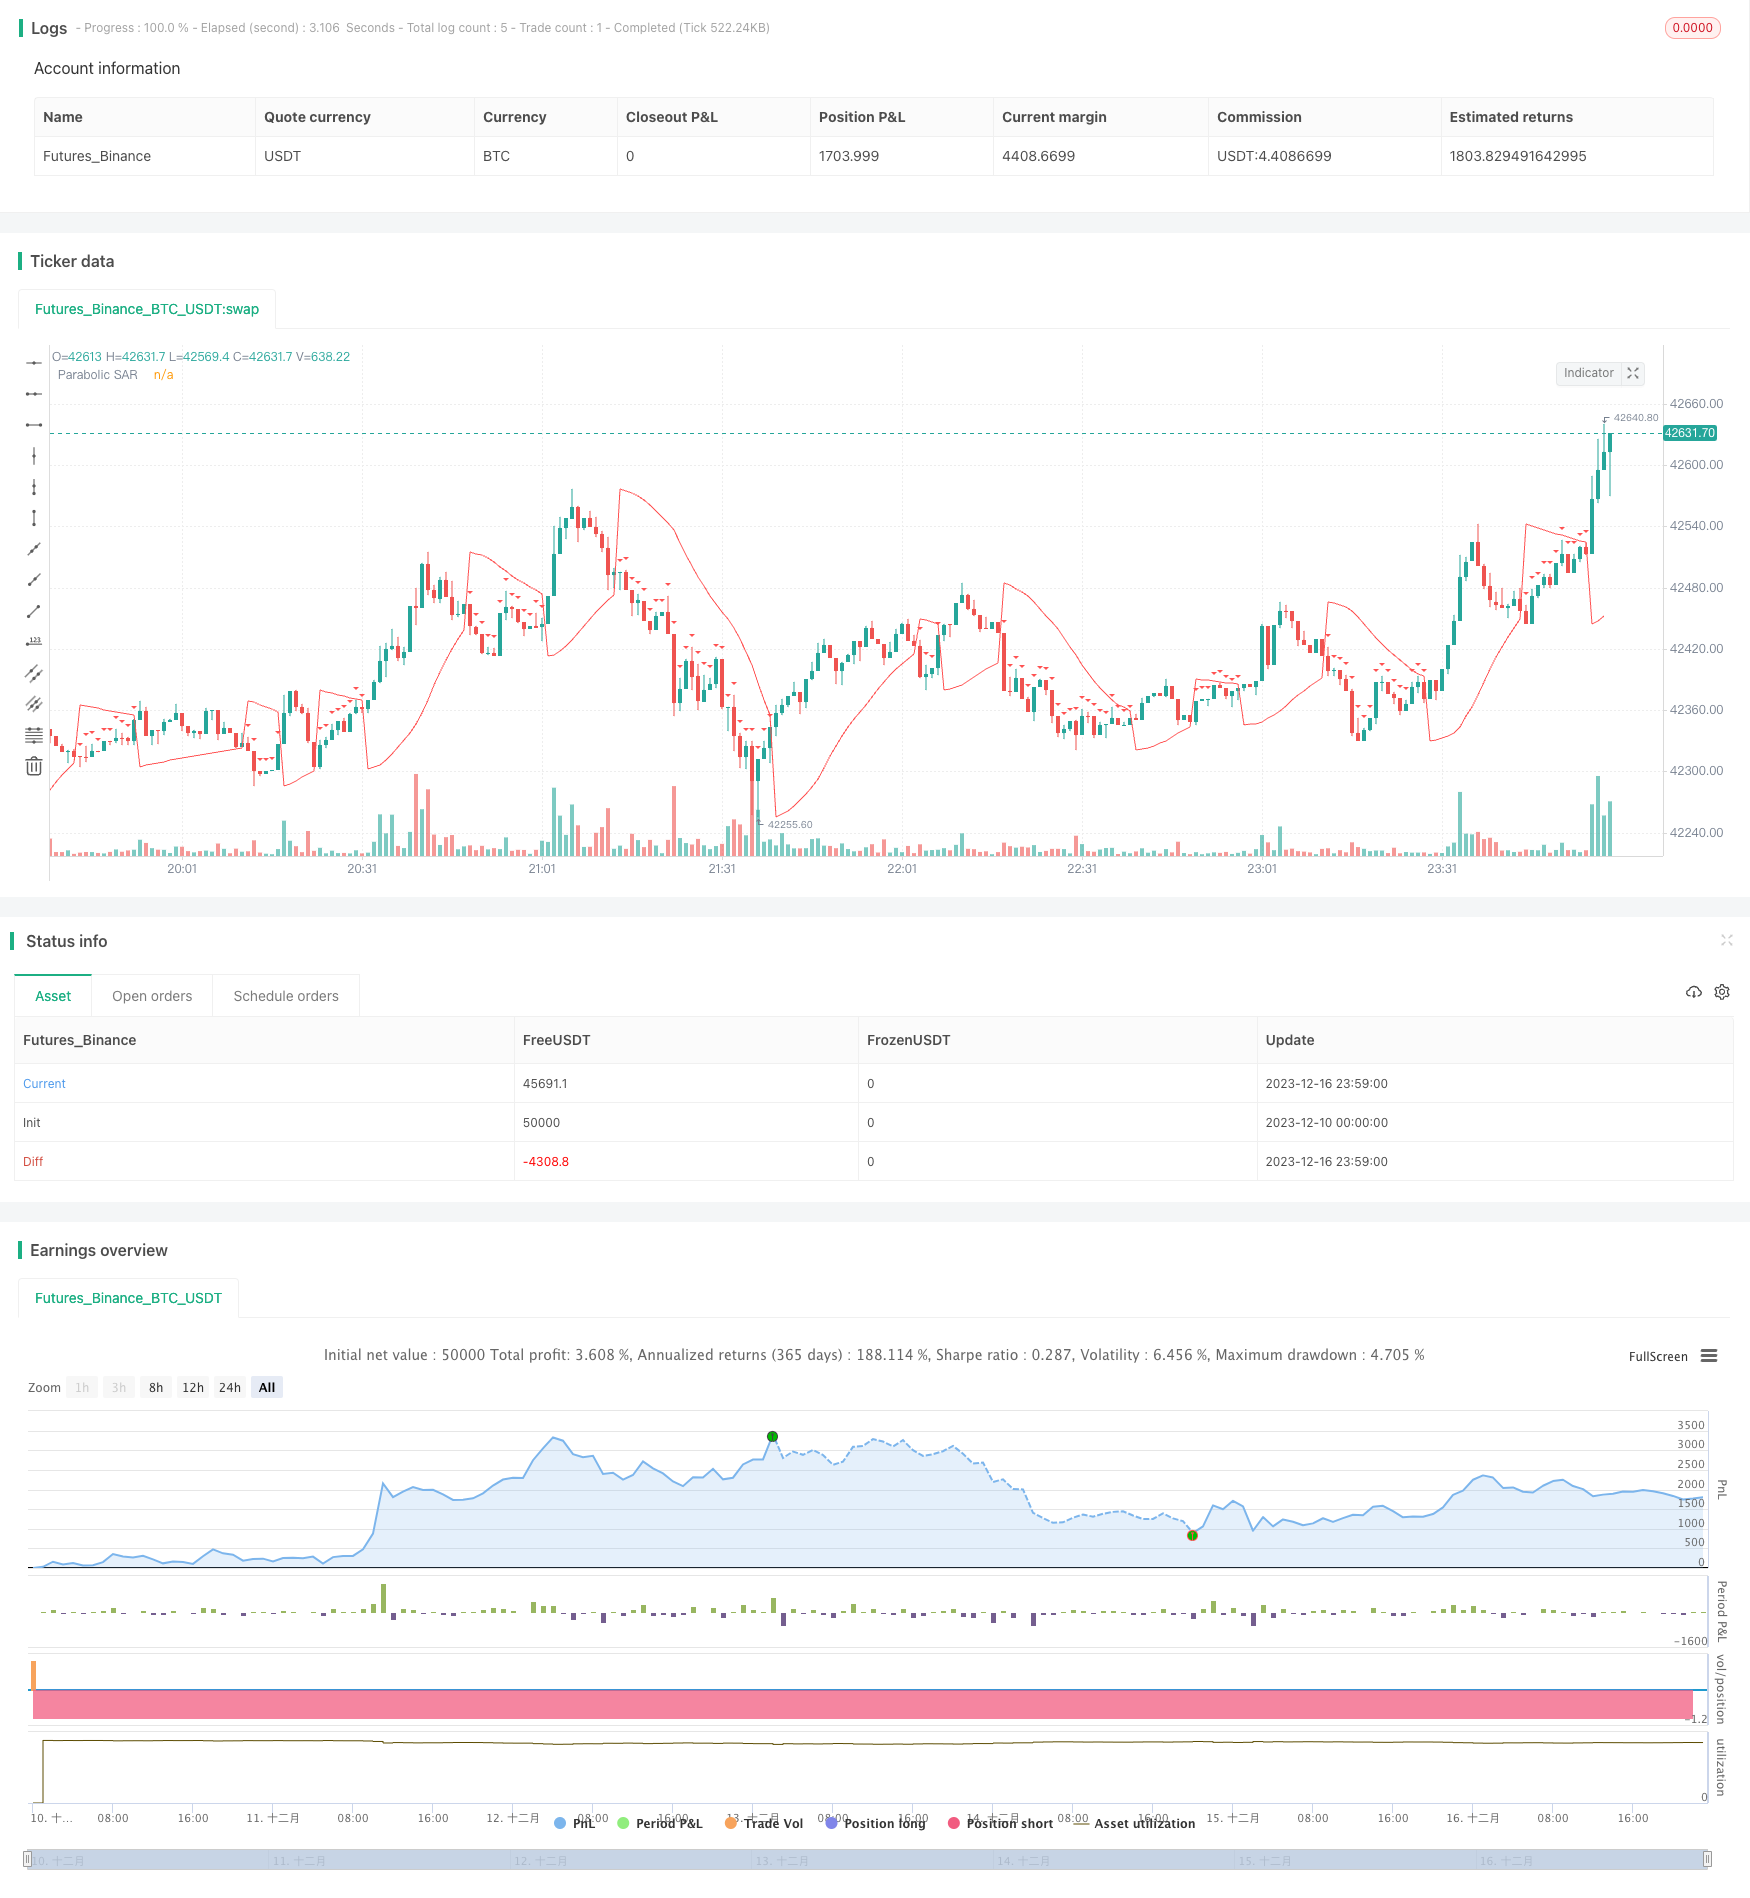 [trans]
概述
本策略名为“SMA和PSAR多空策略”,它结合了简单移动平均线(SMA)和抛物线转向指标(PSAR)的优势,据此判断市场趋势方向,以发出交易信号。当SMA显示正在上升趋势而PSAR位于价格之下时,视为买入时机;当SMA显示正在下降趋势而PSAR高于价格时,则为卖出信号。
策略原理
该策略使用100周期的SMA判断总体趋势方向。当收盘价上涨突破SMA 100时,被定义为上升趋势;当收盘价下跌突破SMA 100时,定义为下降趋势。
同时,计算PSAR指标判断细节入市点。PSAR起始值设置为0.02,递增值为0.01,最大值为0.2。当在上升趋势中,如果PSAR位于收盘价之下,产生买入信号;而如果在下降趋势中PSAR高于收盘价,则产生卖出信号。
综合来看,在判断为上升趋势时,如果PSAR低于收盘价,则产生买入信号;而在判断为下降趋势时,如果PSAR高于收盘价,则产生卖出信号。
为减少交易风险,该策略还设置了时间 exits,交易5分钟后平仓。
优势分析
这种策略结合SMA和PSAR指标判断趋势和入市时机,可以有效利用两种指标的优势,提高决策准确性。SMA可用于判断大趋势,而PSAR对细节入市点更敏感,两者搭配使用可使策略更加完善。
另外设置时间exit有助于控制单笔交易风险,避免亏损过大。整体上,该策略稳健可靠,适合多数市场环境。
风险分析
-
SMA和PSAR指标可能产生错误信号,导致不必要的交易亏损。
-
时间exit设置较短,未必能充分捕捉趋势行情。
-
参数设置(如SMA周期、PSAR 参数等)可能不适应某些具体品种,需要优化。
-
回测数据拟合风险。实盘中市场环境会发生变化,策略表现可能不如回测。
优化方向
-
测试不同SMA周期参数,找到对具体品种更合适的数值。
-
测试优化PSAR的参数设置,使其对细节入市点判断更为准确。
-
延长时间exit的参数,在盈利充分的前提下,适当延长持仓时间。
-
添加止损策略,更好控制单笔交易最大损失。
总结
本策略综合运用SMA和PSAR等指标判断市场走势和入市时机,稳健可靠,适合多数市场环境。同时设置时间exit有助于控制风险。本策略可通过参数优化、止损策略等进一步完善,从而获得更好的实盘效果。
||
Overview
This strategy is named "SMA and PSAR Spot Trading Strategy". It combines the advantages of Simple Moving Average (SMA) and Parabolic SAR (PSAR) to determine market trend direction and generate trading signals. When SMA shows an upward trend and PSAR is below price, it is considered as a buy timing. When SMA shows a downward trend and PSAR is above price, it is considered as a sell timing.
Strategy Logic
The strategy uses 100-period SMA to determine the overall trend direction. When close price breaks through SMA 100 upwards, it is defined as an upward trend. When close price breaks through SMA 100 downwards, it is defined as a downward trend.
At the same time, PSAR indicator is calculated to determine detailed entry points. PSAR initial value is set at 0.02, increment value is 0.01, and maximum value is 0.2. When in an upward trend, if PSAR is below close price, a buy signal is generated. While in a downward trend, if PSAR is above close price, a sell signal is generated.
In summary, when judged as an upward trend, if PSAR is lower than close price, a buy signal is generated. When judged as a downward trend, if PSAR is higher than close price, a sell signal is generated.
To reduce trading risk, the strategy also sets time exits to close positions after 5 minutes.
Advantage Analysis
This strategy combines SMA and PSAR indicators to determine trends and entry points, which can effectively utilize the advantages of both indicators to improve decision accuracy. SMA can be used to determine major trends, while PSAR is more sensitive to detailed entry points. Using both complements each other and makes the strategy more robust.
In addition, setting time exits helps control risks of individual trades and avoid excessive losses. Overall, this strategy is stable and reliable, suitable for most market environments.
Risk Analysis
-
SMA and PSAR may generate incorrect signals, leading to unnecessary trading losses.
-
The time exit setting is short, may not fully capture trending moves.
-
Parameter settings (like SMA period, PSAR parameters etc.) may not suit some specific products, needing optimization.
-
Backtest curve fitting risks. Market environments change in live trading, strategy performance may not be as good as backtest.
Optimization Directions
-
Test different SMA period parameters to find more suitable values for specific products.
-
Test and optimize PSAR parameters to make it judge detailed entries more accurately.
-
Extend time exit parameters, appropriately increasing holding time on the premise of taking sufficient profits.
-
Add stop loss strategies to better control maximum loss per trade.
Conclusion
This strategy comprehensively uses indicators like SMA and PSAR to determine market trends and entry points, which is stable and reliable, suitable for most market environments. Meanwhile, setting time exits helps control risks. This strategy can be further improved through parameter optimization, stop loss strategies etc. to obtain better live performance.
[/trans]
Source (PineScript)
/*backtest
start: 2023-12-10 00:00:00
end: 2023-12-17 00:00:00
period: 1m
basePeriod: 1m
exchanges: [{"eid":"Futures_Binance","currency":"BTC_USDT"}]
*/

//@version=4
strategy(title="SMA and Parabolic SAR Strategy with Time-Based Exit", shorttitle="SMA+PSAR", overlay=true)

// Define the parameters for the Parabolic SAR
psarStart = 0.02
psarIncrement = 0.01
psarMax = 0.2

// Calculate the 100-period SMA
sma100 = sma(close, 1000)

// Calculate the Parabolic SAR
sar = sar(psarStart, psarIncrement, psarMax)

// Determine the trend direction
isUpTrend = close < sma100

// Buy condition: Up trend and SAR below price
buyCondition = isUpTrend and sar < close

// Sell condition: Down trend and SAR above price
sellCondition = not isUpTrend and sar > close

// Plot the SMA and Parabolic SAR
plot(sma100, color=color.blue, title="100-period SMA")
plot(sar, color=color.red, title="Parabolic SAR")

// Plot buy and sell signals
plotshape(series=buyCondition, title="Buy Signal", location=location.belowbar, color=color.green, style=shape.triangleup, size=size.small)
plotshape(series=sellCondition, title="Sell Signal", location=location.abovebar, color=color.red, style=shape.triangledown, size=size.small)

// Strategy entry
strategy.entry("Buy", strategy.long, when = buyCondition)

// Time-based exit after 5 minutes
strategy.exit("Close Buy", from_entry = "Buy", when = time[0] > timestamp(year, month, dayofmonth, hour, minute + 5))

strategy.entry("Sell", strategy.short, when = sellCondition)

// Time-based exit after 5 minutes
strategy.exit("Close Sell", from_entry = "Sell", when = time[0] > timestamp(year, month, dayofmonth, hour, minute + 5))
Detail
https://www.fmz.com/strategy/435704
Last Modified
2023-12-18 10:31:31