
7.8 KiB
Name
基于RSI的趋势追踪策略RSI-Trend-Following-Strategy
Author
ChaoZhang
Strategy Description
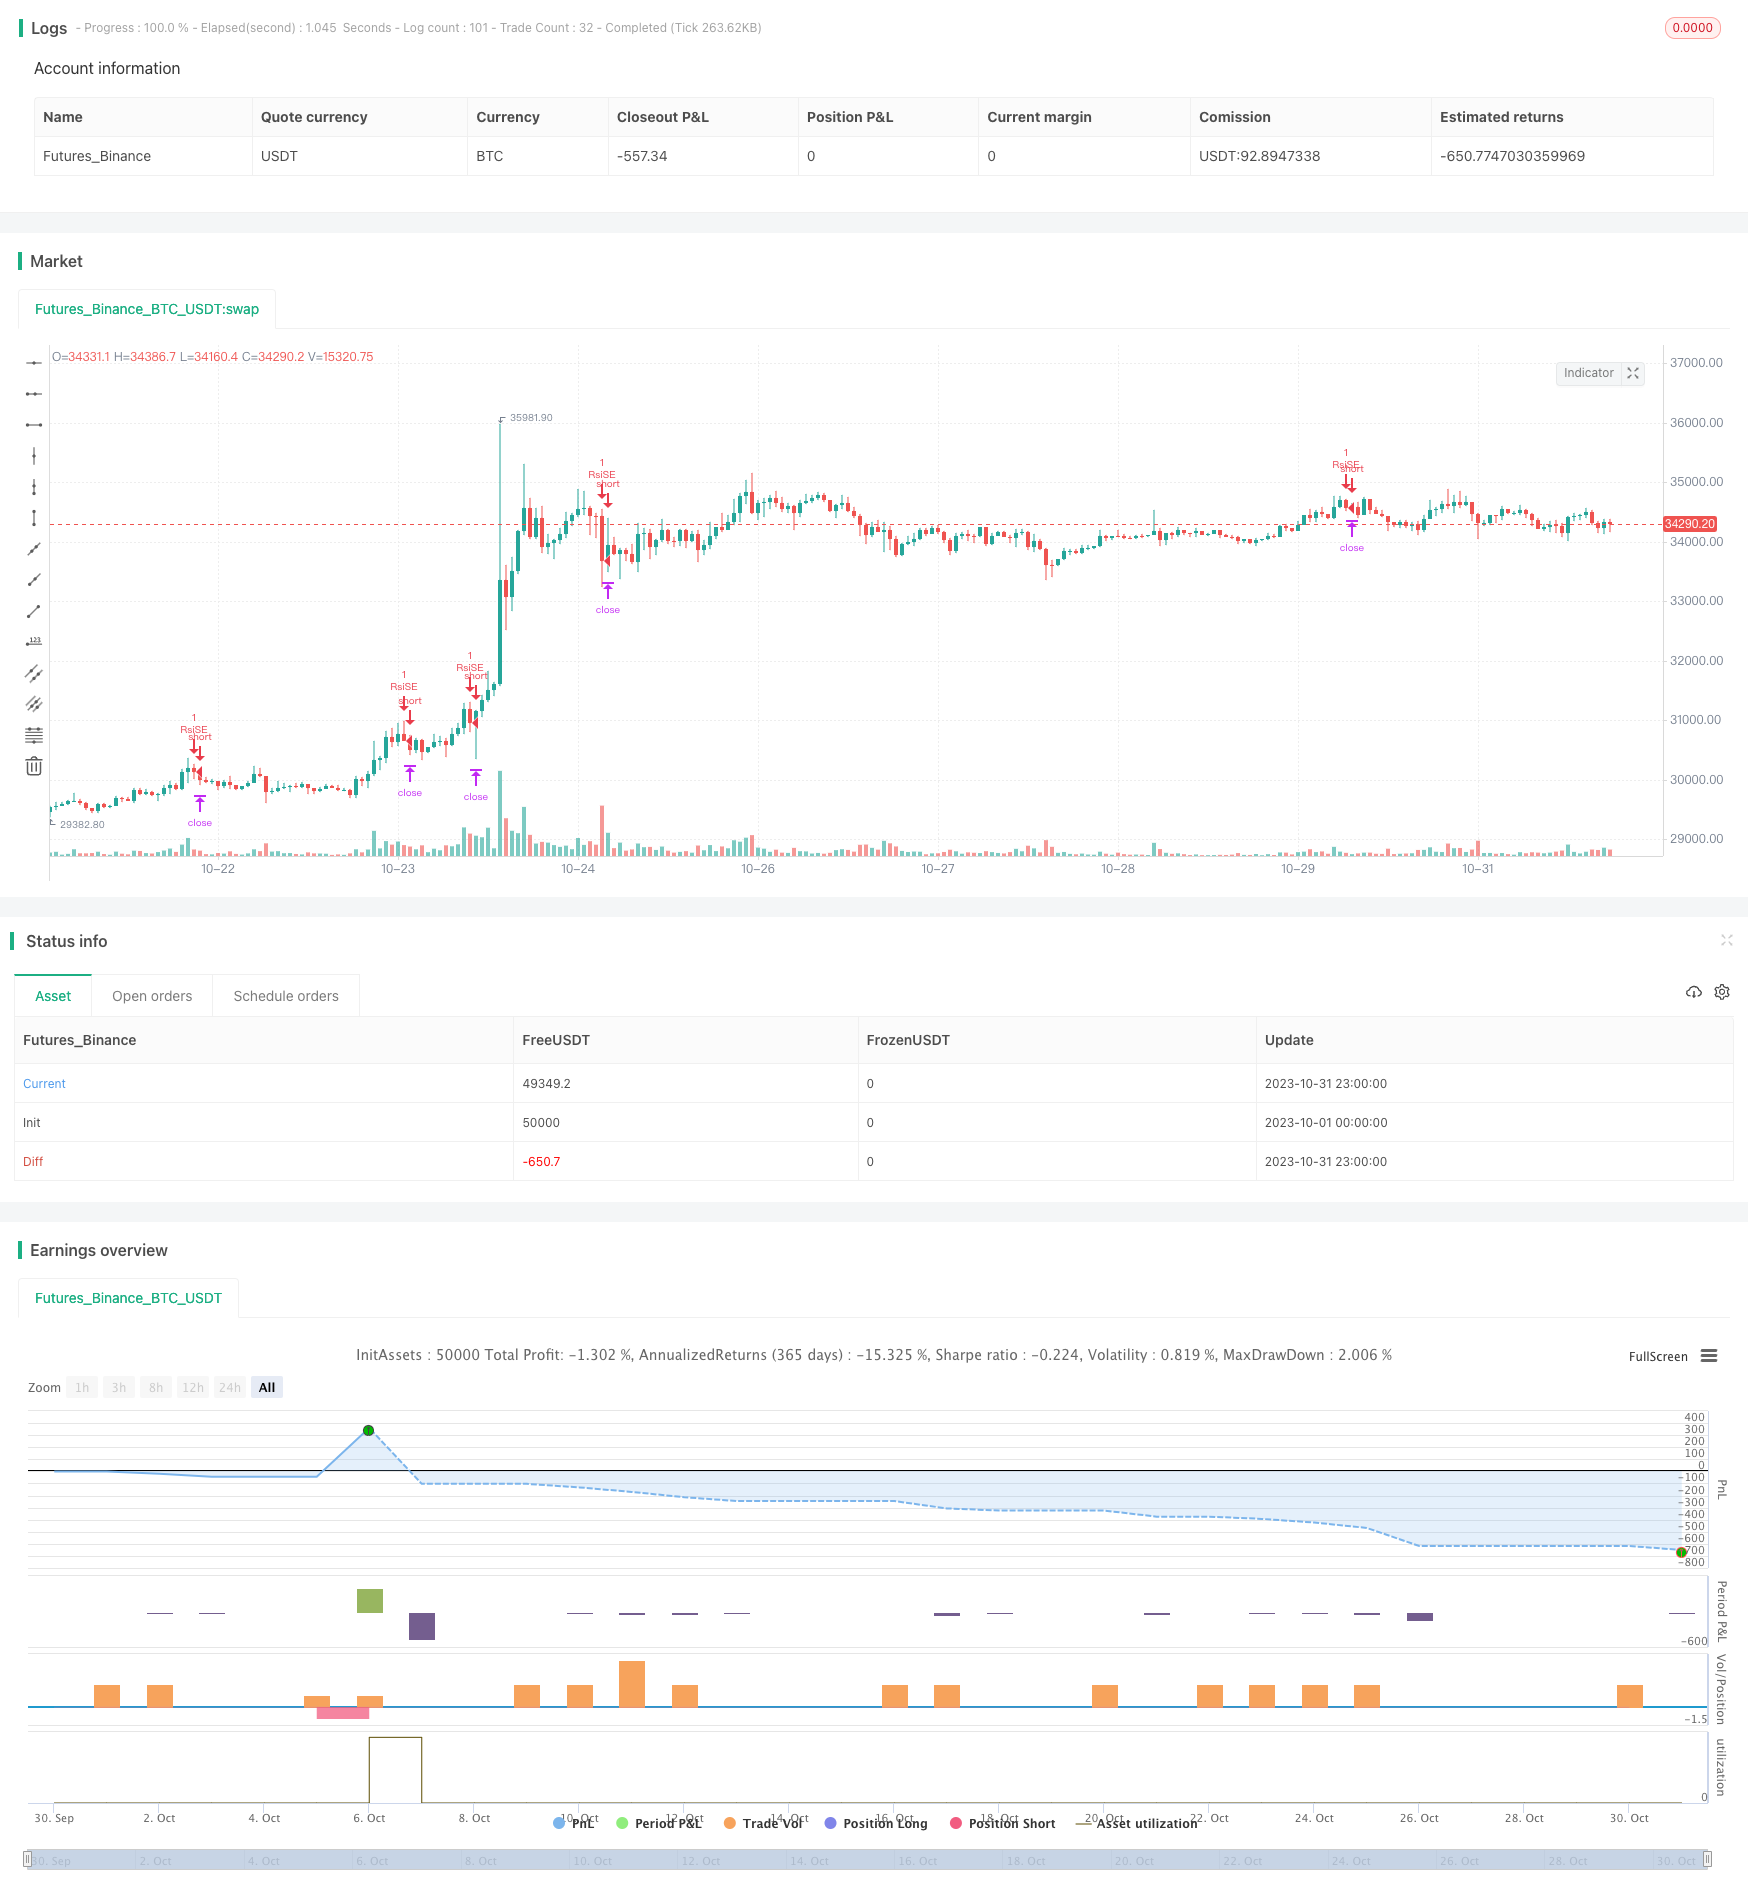 [trans]
概述
本策略基于Relative Strength Index(RSI)指标设计,通过RSI指标判断超买超卖情况,实现趋势追踪。当RSI低于超卖线时做多,当RSI高于超买线时做空,通过追踪行情的主要趋势来获利。
策略原理
本策略使用RSI指标判断市场的超买超卖情况。RSI指标基于一定时间周期内的涨跌幅进行计算,当RSI低于30时被视为超卖,当RSI高于70时被视为超买。
具体来说,本策略首先定义RSI计算参数length=14,超买线overBought=70,超卖线overSold=30。然后根据close价格计算出RSI值vrsi。判断vrsi是否高于超买线或低于超卖线,如果发生黄金交叉做多,如果发生死亡交叉做空。做多做空后设置止损点为etoroStopTicks ticks,在窗口期内触发止损后平仓。
通过这种方式,本策略能够捕捉市场的主要趋势,在超卖点买入,在超买点卖出,实现趋势追踪。
策略优势
- 利用RSI指标判断超买超卖情况,有利于捕捉市场趋势
- 回测窗口设定灵活,可以选择不同的时间范围进行测试
- 止损点设置合理,可以控制单笔损失
策略风险
- RSI存在拉胯现象,可能产生错误信号
- 止损点 static,无法动态跟踪市场波动
- 无法判断趋势反转点,可能反向开仓
风险解决方法:
- 结合其他指标过滤 RSI 信号,避免错误开仓
- 动态调整止损点,实时跟踪市场波动
- 增加趋势判断指标,避免反向开仓
策略优化方向
本策略可以从以下几个方面进行优化:
- 优化RSI参数,寻找最优参数组合
可以测试不同的RSI计算周期length,不同的超买超卖阈值,找到最优参数以减少错误信号。
- 增加趋势判断指标,避免逆势交易
可以加入均线、MACD等指标判断趋势方向,避免在趋势反转点产生错误信号。
- 动态止损
可以根据ATR等指标设定动态止损点,让止损更加贴近市场波动。
- 优化入场规则
可以在RSI信号基础上增加其它条件,如突破某一价格位、交易量放大等作为入场信号,提高入场精确度。
总结
本策略通过RSI指标判断超买超卖情况,实现了对趋势的捕捉。相比传统的跟踪止损策略,具有利用指标判断市场Timing的优势。但RSI指标存在拉胯现象,无法判断趋势反转点,这是本策略需要优化的方向。通过参数优化、增加趋势判断、动态止损等手段,可以进一步提升策略的稳定性和盈利能力。
||
Overview
This strategy is designed based on the Relative Strength Index (RSI) indicator to identify overbought and oversold situations and follow the trend. It goes long when RSI is below the oversold line and goes short when RSI is above the overbought line, aiming to profit by following the main trend of the market.
Strategy Logic
This strategy uses the RSI indicator to identify overbought and oversold conditions in the market. RSI is calculated based on the price changes over a certain period of time. An RSI below 30 is considered oversold while an RSI above 70 is considered overbought.
Specifically, this strategy first defines the RSI parameters length=14, overbought=70, oversold=30. It then calculates the RSI value vrsi based on the close price. When vrsi crosses above the overbought line or below the oversold line, it triggers a long or short trade accordingly. After entering the trade, a stop loss of etoroStopTicks ticks is set. The positions will be closed when stop loss is triggered within the trading window.
In this way, the strategy is able to follow the major trend of the market - going long at oversold situations and going short at overbought situations.
Advantages
- Utilize RSI to identify overbought/oversold market conditions for catching the trend
- Flexible backtesting window for testing different time periods
- Reasonable stop loss setting for controlling single trade loss
Risks
- RSI divergence may generate false signals
- Static stop loss fails to adapt to market fluctuation
- Hard to identify trend reversal, may lead to reverse trades
Solutions:
- Add filter indicators to avoid wrong entries based on false RSI signal
- Dynamic stop loss to track market movement in real time
- Add trend judging tools to prevent reverse trades
Improvement
The strategy can be optimized in the following aspects:
- Optimize RSI parameters for best performance
Test different RSI periods and overbought/oversold levels to find optimum parameters and reduce false signals.
- Add trend judging tools to avoid counter trend trades
Add MA, MACD to judge trend direction and avoid wrong signals at turning points.
- Dynamic stop loss
Use ATR to set adaptive stop loss for better tracking market fluctuation.
- Improve entry rules
Add other conditions like breakout, volume increase to RSI signal to improve entry accuracy.
Conclusion
The strategy catches the trend by identifying overbought and oversold situations using RSI. Compared to traditional tracking stop strategies, it has the advantage of timing the market with indicators. However, problems like RSI divergence and inability to detect trend reversal need to be addressed. Further improvements on parameter optimization, trend judging, dynamic stop loss can enhance the stability and profitability.
[/trans]
Strategy Arguments
| Argument | Default | Description |
|---|---|---|
| v_input_1 | 12 | From Month |
| v_input_2 | true | From Day |
| v_input_3 | 2018 | From Year |
| v_input_4 | true | To Month |
| v_input_5 | true | To Day |
| v_input_6 | 9999 | To Year |
| v_input_7 | 14 | length |
| v_input_8 | 30 | overSold |
| v_input_9 | 70 | overBought |
| v_input_10 | 120 | etoroStopTicks |
Source (PineScript)
/*backtest
start: 2023-10-01 00:00:00
end: 2023-10-31 23:59:59
period: 1h
basePeriod: 15m
exchanges: [{"eid":"Futures_Binance","currency":"BTC_USDT"}]
*/

//@version=3

strategy("RSI Etoro Strategy", overlay=true, max_bars_back=2000)
// To use:
// Capital = capital * leverage
// Slippage Ticks: 3, 5 ? (Mainly for spread)
// etoroStopTicks: Set it accordingly to the stock (to corresponds to etoro default of 50 % for exemple...)

// === INPUT BACKTEST RANGE ===
FromMonth = input(defval = 12, title = "From Month", minval = 1, maxval = 12)
FromDay   = input(defval = 1, title = "From Day", minval = 1, maxval = 31)
FromYear  = input(defval = 2018, title = "From Year", minval = 1995)
ToMonth   = input(defval = 1, title = "To Month", minval = 1, maxval = 12)
ToDay     = input(defval = 1, title = "To Day", minval = 1, maxval = 31)
ToYear    = input(defval = 9999, title = "To Year", minval = 1995)


// === FUNCTION EXAMPLE ===
start     = timestamp(FromYear, FromMonth, FromDay, 00, 00)  // backtest start window
finish    = timestamp(ToYear, ToMonth, ToDay, 23, 59)        // backtest finish window
window()  => time >= start and time <= finish ? true : false // create function "within window of time"

length = input( 14 )
overSold = input( 30 )
overBought = input( 70 )
etoroStopTicks = input( 120 )
// 120 because it is approximatively the number of ticks for default SL of 50% at x5 leverage for copper (no fee)...
price = close

vrsi = rsi(price, length)

if (not na(vrsi))
    if (crossover(vrsi, overSold))
        strategy.entry("RsiLE", strategy.long, comment="RsiLE", when = window())
    if (crossunder(vrsi, overBought))
        strategy.entry("RsiSE", strategy.short, comment="RsiSE", when = window())
strategy.exit("exit SE", "RsiSE", loss=etoroStopTicks, when = window())
strategy.exit("exit LE", "RsiLE", loss=etoroStopTicks, when = window())

//plot(strategy.equity, title="equity", color=red, linewidth=2, style=areabr)
Detail
https://www.fmz.com/strategy/431411
Last Modified
2023-11-07 16:33:43