
7.4 KiB
Name
基于RSI指标和MA均线的趋势跟踪策略RSI-MA-Trend-Following-Strategy
Author
ChaoZhang
Strategy Description
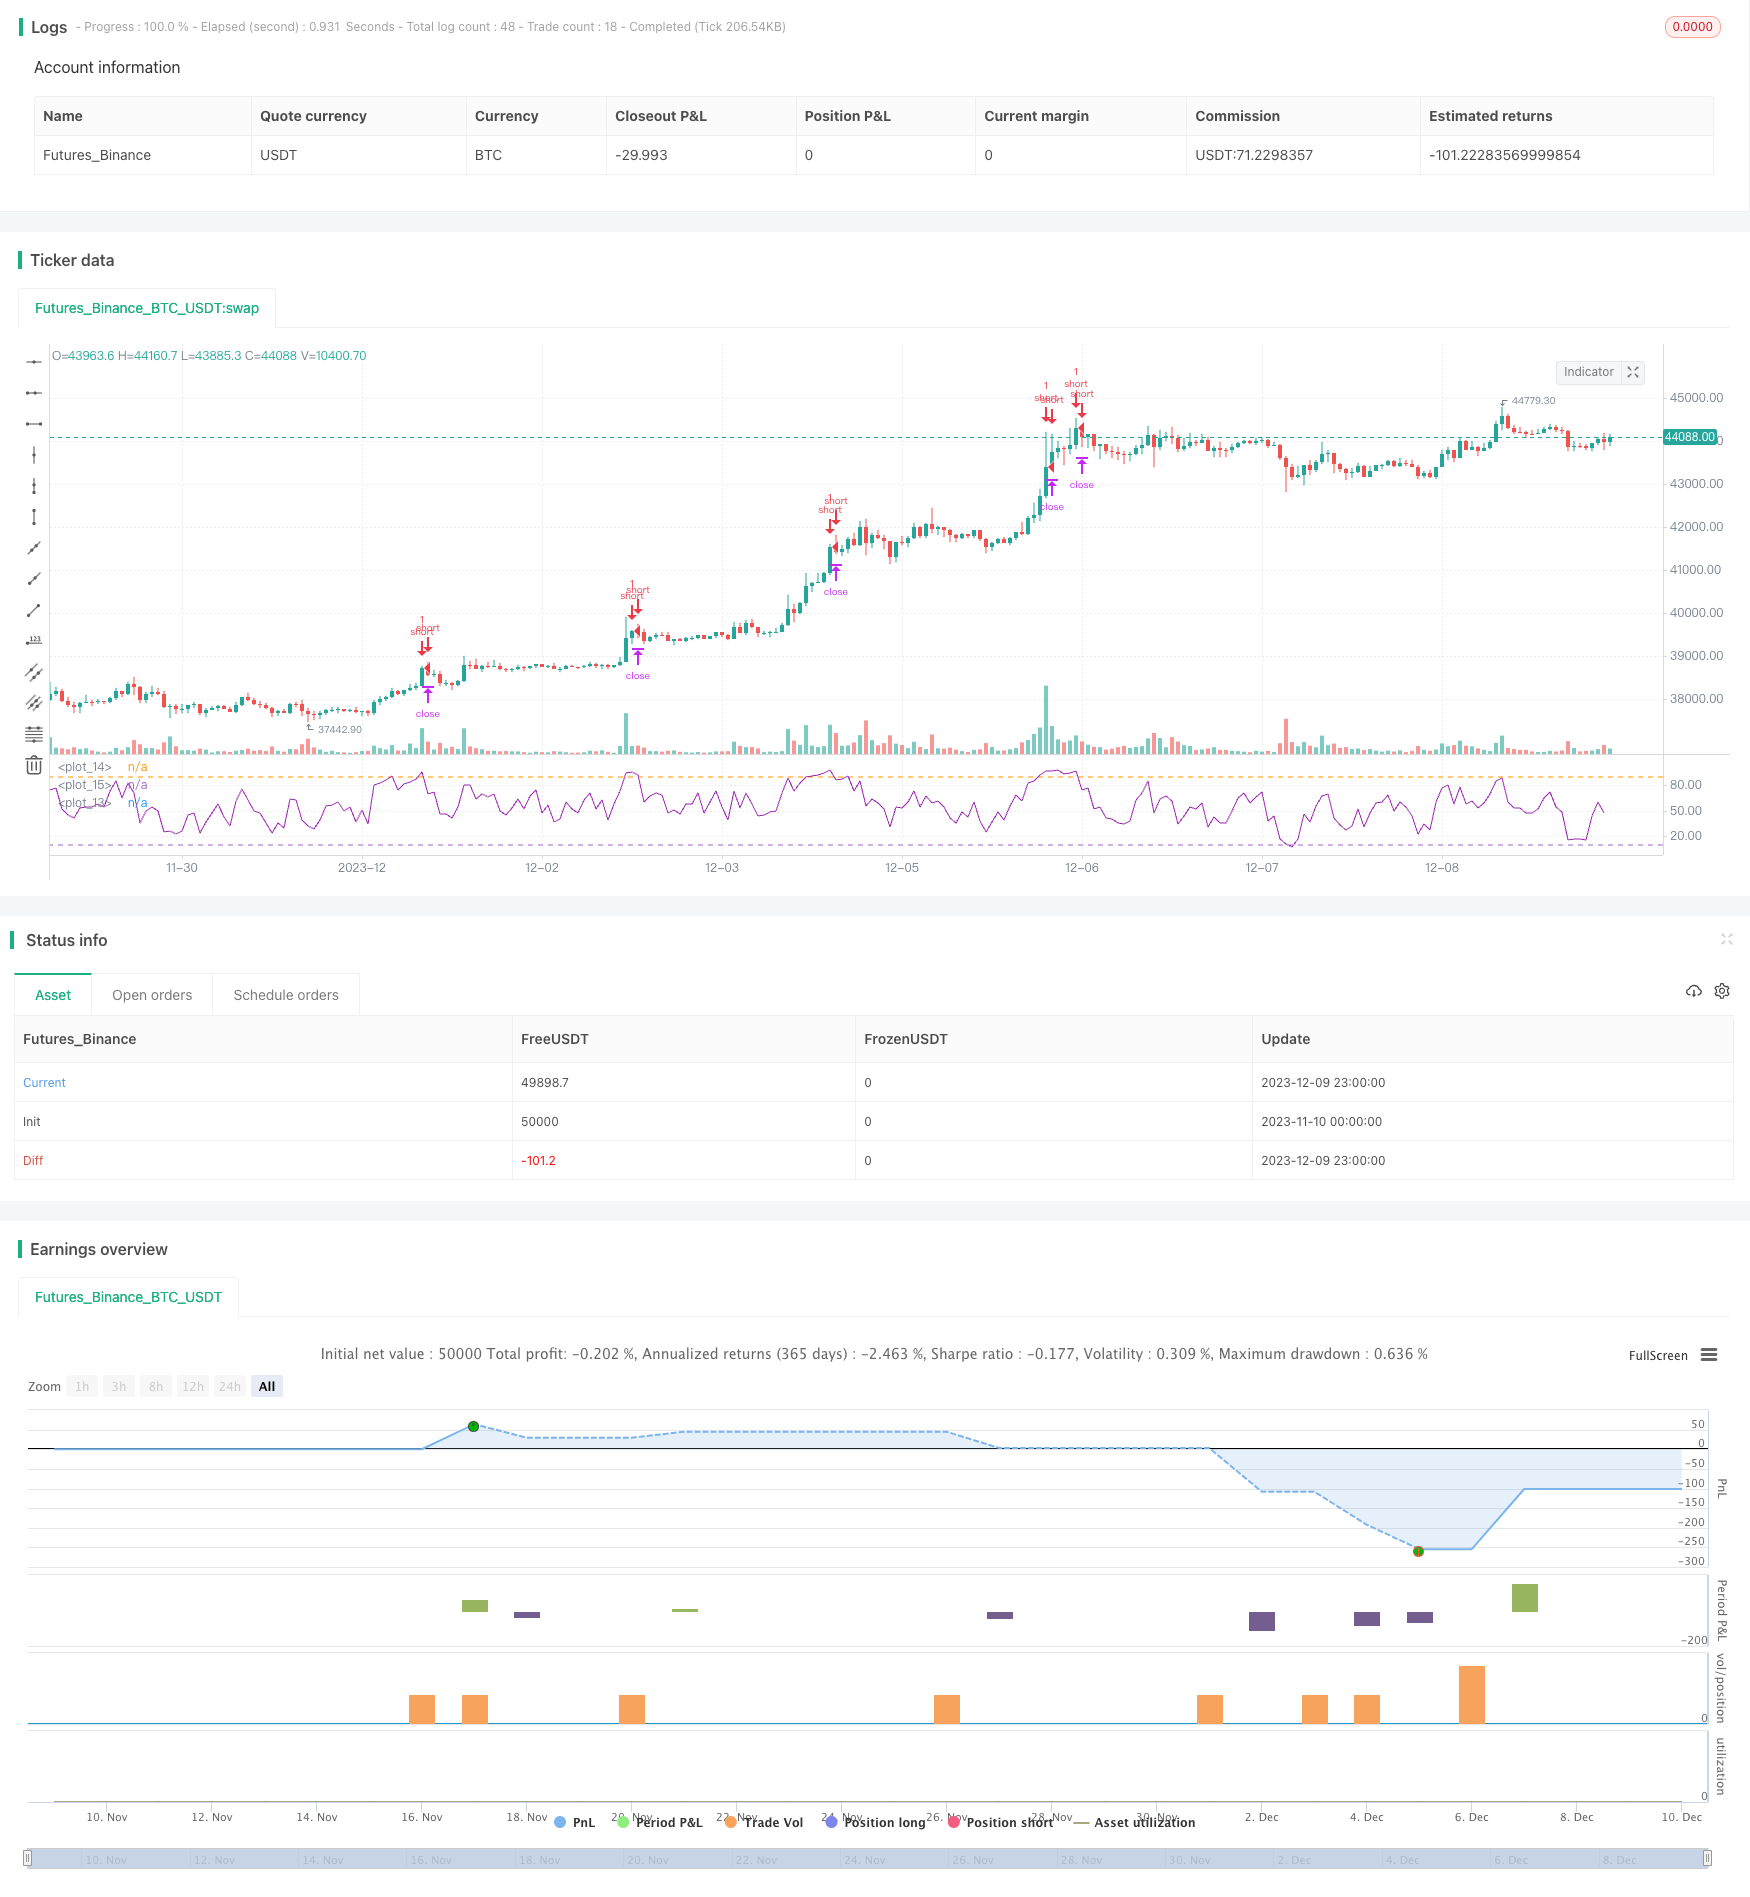 [trans]
概述
本策略名为“RSI-MA 趋势跟踪策略”,其思路是同时利用 RSI 指标和 MA 均线来判断价格趋势和发出交易信号。当 RSI 指标超过设定的上下阈值时产生交易信号,而 MA 均线用来过滤假信号,在价格持续上涨或者下跌时才会发出信号。这可以在保持一定的盈利空间的同时有效过滤震荡行情。
策略原理
该策略主要使用 RSI 指标和 MA 均线。RSI 用来判断超买超卖,MA 用来判定趋势方向。 具体逻辑是:
-
计算 RSI 指标值,并设定上阈值 90 和下阈值 10。当 RSI 超过 90 时为超买信号,小于 10 时为超卖信号。
-
计算一定周期(如 4 日)的 MA 均线。当价格持续上涨时,MA 线上翘;当价格持续下跌时,MA 线下翘。
-
当 RSI 超过 90 同时 MA 线上翘时,做空;当 RSI 小于 10 同时 MA 线下翘时,做多。
-
止损设定为每手固定点数,止盈为每手固定百分比。
策略优势分析
该策略结合 RSI 指标和 MA 均线双重过滤,可以有效过滤震荡行情下的假信号。同时通过 RSI 的设置避免信号来得太晚,保证了一定的盈利空间。利用 MA 判定趋势方向,避免逆势交易。此外,策略参数较简单,容易理解和优化。
风险分析
该策略主要风险有:
-
突发事件造成暴跌或暴涨,RSI 和 MA 都没来得及反应,可能造成较大亏损。
-
震荡行情中,RSI 和 MA 可能频繁发出信号,造成过于频繁交易而增加交易费用和滑点成本。
-
参数设定不当也会影响策略表现,如 RSI 上下阈值设置过宽则信号延迟,设置过窄则信号太频繁。
优化方向
该策略可进一步优化的方向包括:
-
根据不同品种和周期参数进行测试和优化,设定最佳参数组合。
-
增加其他指标结合,如加入 KDJ、BOLL 等,设置更加严格的过滤条件,减少误交易概率。
-
设置自适应止损止盈机制,比如根据波动率和ATR 来动态调整止损价位。
-
增加机器学习算法,根据市场状况自动调整策略参数,实现参数的动态优化。
总结
该 RSI-MA 策略整体来说较为简单实用,同时结合了趋势跟踪和超买超卖判断,在良好的市场环境下能获得较好收益。但也存在一定概率的误交易风险,需要进一步优化以降低风险和提高稳定性。
||
Overview
This strategy is named "RSI-MA Trend Following Strategy". The idea is to use both the RSI indicator and MA lines to judge price trends and generate trading signals. Trading signals are generated when the RSI indicator exceeds the pre-set upper and lower thresholds, while the MA lines are used to filter out false signals, only issuing signals when prices continue to rise or fall. This allows maintaining decent profit potential while effectively filtering out range-bound price movements.
Strategy Logic
The core components of this strategy are the RSI indicator and MA lines. The RSI is used to identify overbought and oversold levels, while the MA is used to determine trend directionality. The specific logic is:
-
Calculate the RSI indicator value, and set the upper threshold at 90 and lower threshold at 10. An RSI reading above 90 signifies an overbought signal, while a reading below 10 signifies an oversold signal.
-
Calculate the MA line of a certain period (e.g. 4 days). When prices are continuously rising, the MA line tilts upwards. When prices are falling continuously, the MA line tilts downwards.
-
When the RSI exceeds 90 and the MA line tilts upwards, go short. When the RSI drops below 10 and the MA line tilts downwards, go long.
-
Set stop loss at a fixed number of points per contract, and take profit at a fixed percentage per contract.
Advantage Analysis
This strategy combines the dual filters of RSI indicator and MA lines, which can effectively filter out false signals under range-bound price moves. Meanwhile, the RSI settings avoid delayed signals and maintain decent profit potential. Using the MA to determine trend directionality prevents trading against the trend. In addition, the strategy has simple parameters that are easy to comprehend and optimize.
Risk Analysis
Main risks of this strategy include:
-
Sudden events that cause sharp price spikes may not be reflected timely in RSI and MA readings, leading to larger losses.
-
Under range-bound markets, RSI and MA may frequently issue signals, resulting in overly frequent trading that increases transaction costs and slippage.
-
Improper parameter settings can also impact strategy performance. For example, RSI upper/lower thresholds set too wide lead to signal delays, while thresholds set too narrow lead to too frequent signals.
Optimization Directions
Areas for further optimization include:
-
Backtest and optimize parameters over different products and timeframes to find the optimal parameter combinations.
-
Incorporate other indicators alongside RSI/MA, such as KDJ, BOLL etc, to set more stringent signal filters and reduce false signals.
-
Build adaptive stop loss/take profit mechanisms based on volatility and ATR to dynamically adjust price levels.
-
Add machine learning algorithms to auto-adjust parameters based on changing market conditions, realizing dynamic parameter optimization.
Conclusion
Overall this RSI-MA strategy is fairly simple and practical, combining elements of trend following and overbought/oversold analysis. It can achieve decent profits given favorable market conditions, but also carries risks of false signals that need to be reduced via further optimizations to improve robustness.
[/trans]
Strategy Arguments
| Argument | Default | Description |
|---|---|---|
| v_input_1 | 4 | Length |
| v_input_2 | 5 | rsin |
| v_input_3 | 15 | TP |
| v_input_4 | 23 | SL |
| v_input_5 | false | TS |
Source (PineScript)
/*backtest
start: 2023-11-10 00:00:00
end: 2023-12-10 00:00:00
period: 1h
basePeriod: 15m
exchanges: [{"eid":"Futures_Binance","currency":"BTC_USDT"}]
*/

//@version=2
//This strategy is best used with the Chrome Extension AutoView for automating TradingView alerts.
//You can get the AutoView extension for FREE using the following link
//https://chrome.google.com/webstore/detail/autoview/okdhadoplaoehmeldlpakhpekjcpljmb?utm_source=chrome-app-launcher-info-dialog
strategy("4All", shorttitle="Strategy", overlay=false)

src = close
len = input(4, minval=1, title="Length")

up = rma(max(change(src), 0), len)
down = rma(-min(change(src), 0), len)
rsi = down == 0 ? 100 : up == 0 ? 0 : 100 - (100 / (1 + up / down))
plot(rsi, color=purple)
band1 = hline(90)
band0 = hline(10)
fill(band1, band0, color=purple, transp=90)

rsin = input(5)
sn = 100 - rsin
ln = 0 + rsin

short = crossover(rsi, sn)
long = crossunder(rsi, ln)

strategy.entry("long", strategy.long, when=long)
strategy.entry("short", strategy.short, when=short)

TP = input(15) * 10
SL = input(23) * 10
TS = input(0) * 10
CQ = 100

TPP = (TP > 0) ? TP : na
SLP = (SL > 0) ? SL : na
TSP = (TS > 0) ? TS : na

strategy.exit("Close Long", "long", qty_percent=CQ, profit=TPP, loss=SLP, trail_points=TSP)
strategy.exit("Close Short", "short", qty_percent=CQ, profit=TPP, loss=SLP, trail_points=TSP)
Detail
https://www.fmz.com/strategy/435002
Last Modified
2023-12-11 16:14:07