
7.8 KiB
Name
基于RSI均线的低买高卖短线量化交易策略RSI-Mean-Reversion-Quantitative-Trading-Strategy-Based-on-RSI-Average-Crossing
Author
ChaoZhang
Strategy Description
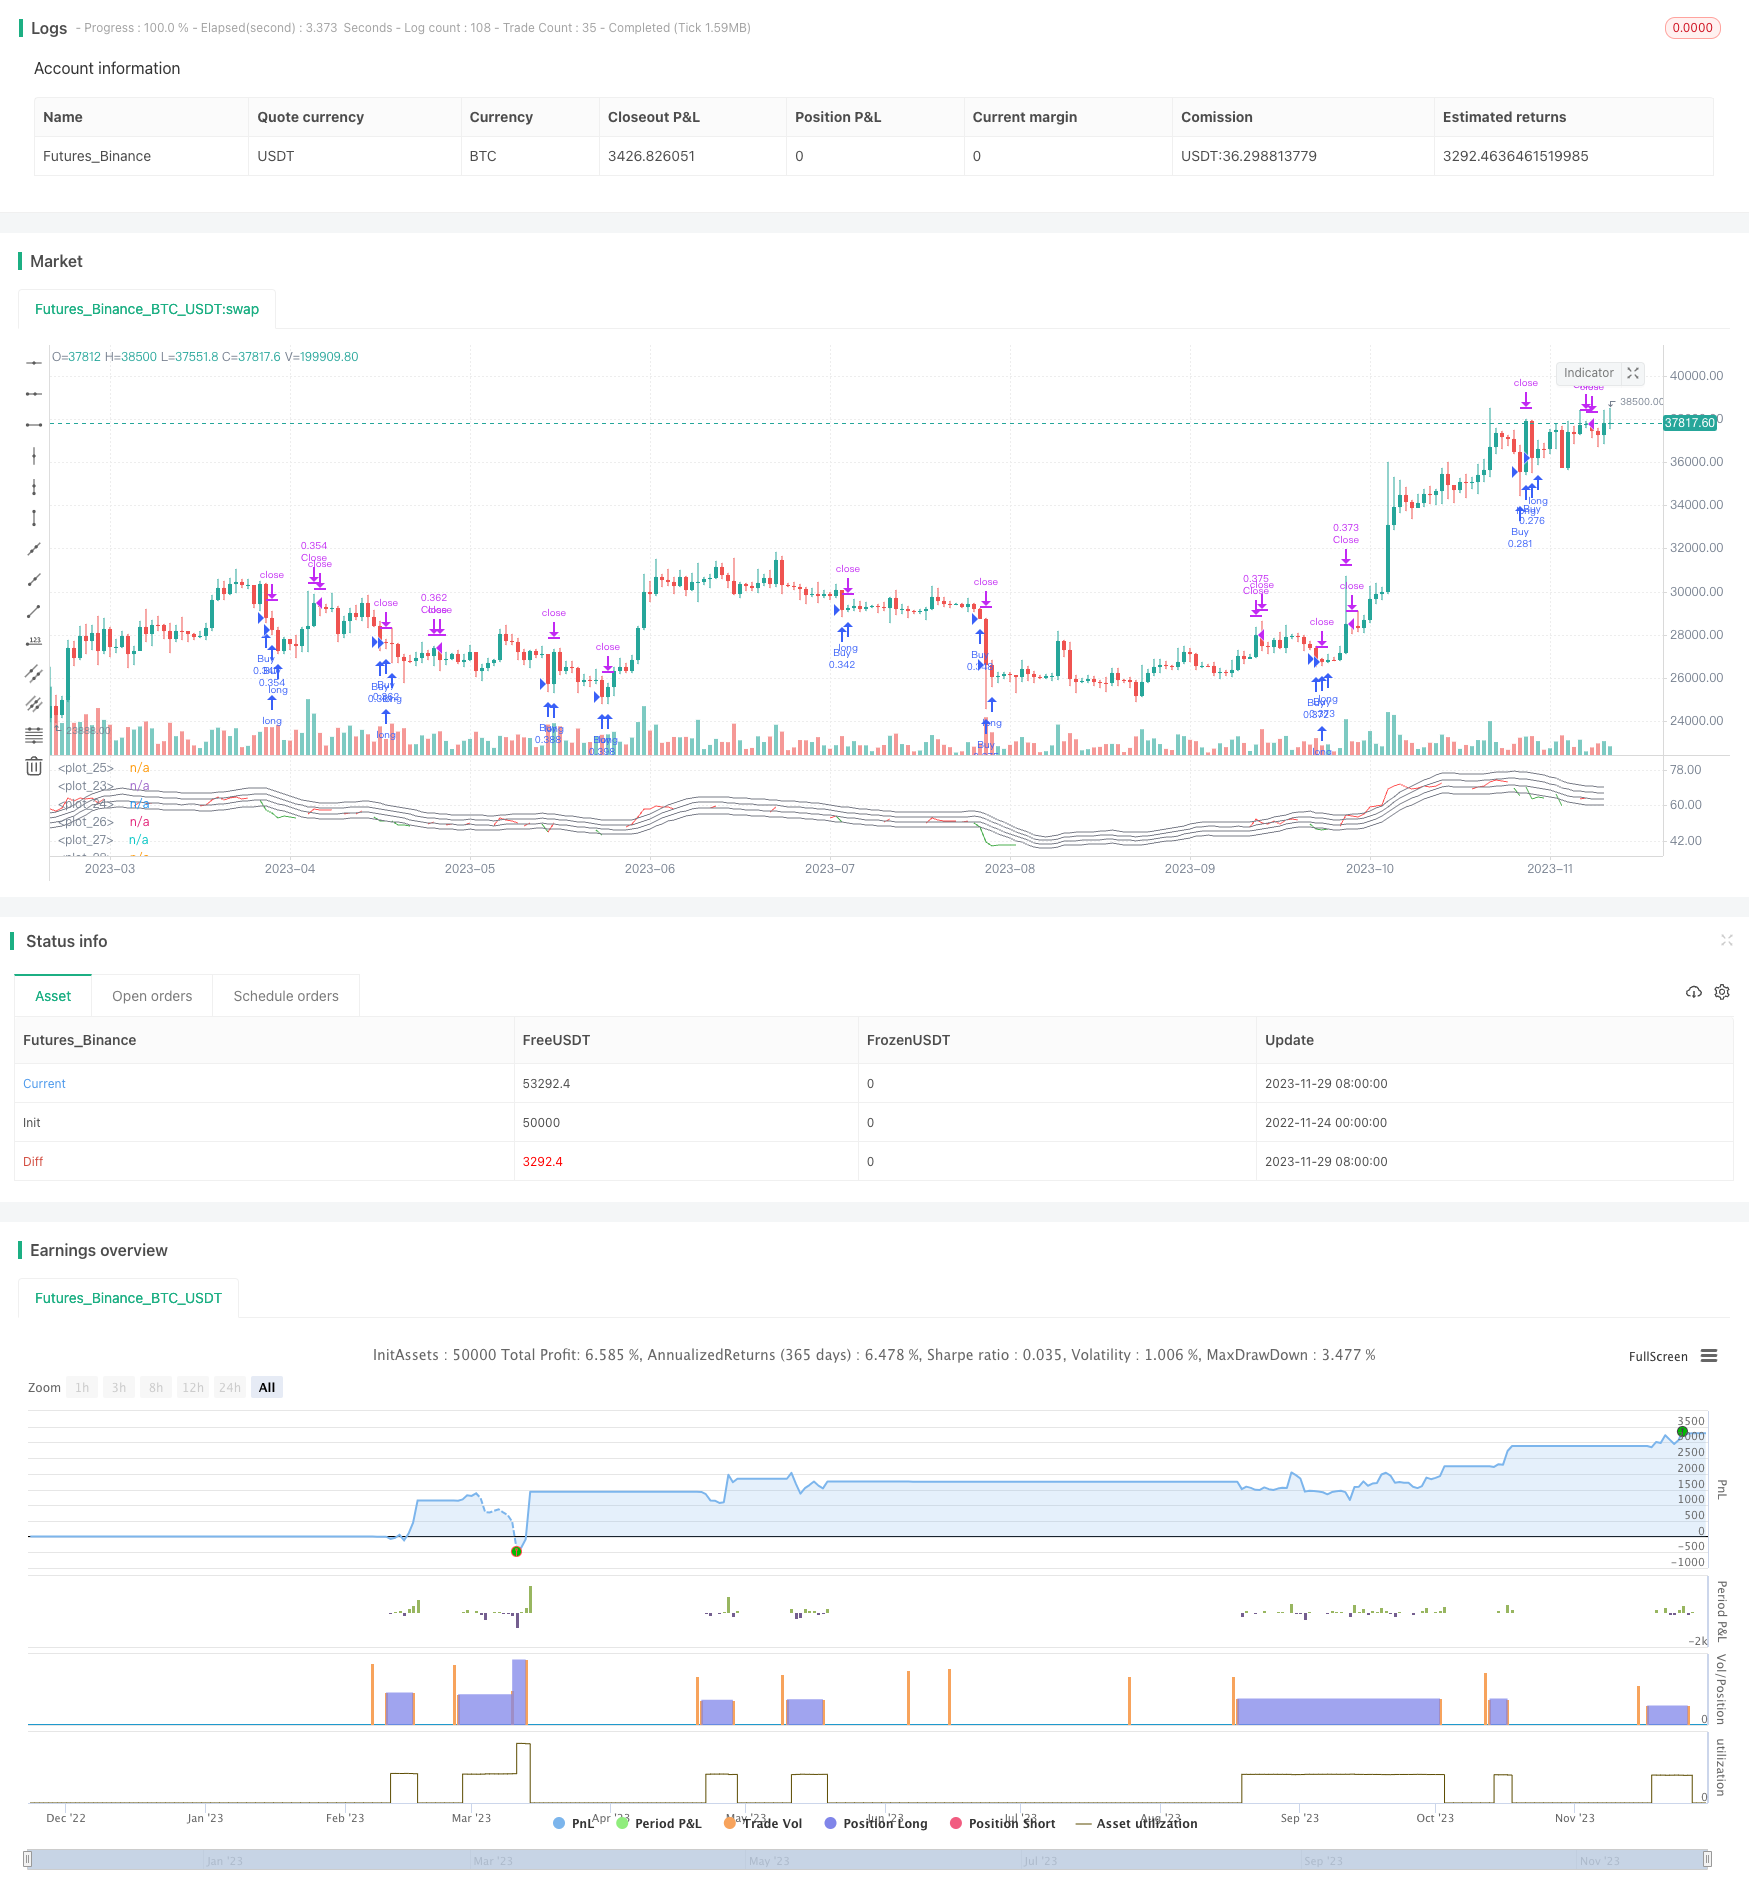 [trans]
概述
该策略通过RSI指标与其均线的交叉来确定买卖点,属于短线交易策略。策略会在RSI指标低于其均线时买入,高于其均线时卖出,属于典型的低买高卖策略。
策略原理
- 计算RSI指标值,周期长度为40根K线
- 对RSI指标计算其MA均线,周期长度为10根K线
- 当RSI指标低于其均线乘以系数(1-买卖区间/100)时生成买入信号
- 当RSI指标高于其均线乘以系数(1+买卖区间/100)时生成卖出信号
- 买卖区间距离默认为5,表示离均线正负5%时产生信号
- 平仓判断为RSI指标高于其均线且高于50水平时
优势分析
这是一个典型的趋势反转策略,利用RSI指标的超买超卖特性来确定买卖时机。该策略有以下几个优势:
- 采用RSI指标判断市场结构,指标本身可靠性较高
- 均线过滤能避免不必要的交易,增强稳定性
- 买卖区间距离参数可调整交易频率
- 代码简单易懂,逻辑清晰
总的来说,这是一个简单实用的短线交易策略。
风险分析
该策略也存在一些风险需要注意:
- RSI指标发出错误信号的可能性,需要关注指标曲线形态
- 买卖区间距离设定不当可能带来过多交易或漏掉机会
- 交易频率较高,需考虑交易成本的影响
- 仅基于单一指标,容易受到市场异常的影响
这些风险都可通过参数优化、增加过滤条件等方式得到缓解。
优化方向
该策略可从以下几个维度进行优化:
- 增加更多过滤指标,如交易量指标,确保只在趋势转折点才产生信号
- 加入止损策略,控制单笔损失
- 优化买卖区间距离,平衡交易频率和获利率
- 利用机器学习算法自动寻优参数组合
- 增加聚合模型,整合多个子策略结果
通过多指标组合、止损管理、参数优化等手段,可以大幅提高策略表现。
总结
本策略整体来说是一个非常典型和实用的短线交易策略。它利用RSI指标的超买超卖状态来判断买卖时机,再辅以均线过滤。策略逻辑简单清晰,参数调整灵活,易于实现。存在一定的市场风险,但可通过完善入场退出机制、优化参数等方式进行控制。如果结合更多技术指标和风控手段,该策略可以成为一个相对稳定收益的短线策略。
||
Overview
This strategy determines buy and sell signals based on the crossing between RSI indicator and its moving average, belonging to short-term trading strategies. It will buy when RSI is lower than its MA and sell when RSI is higher than its MA, which is a typical low-buying-high-selling strategy.
Strategy Principle
- Calculate RSI indicator with a period of 40 bars
- Calculate the MA of RSI indicator, with period of 10 bars
- Generate buy signal when RSI is lower than its MA multiplied by a coefficient (1-trading range%)
- Generate sell signal when RSI is higher than its MA multiplied by a coefficient (1+trading range%)
- Default trading range distance is 5, meaning 5% above or below MA to trigger signals
- Determine exit when RSI is above its MA and above 50 level
Advantage Analysis
This is a typical mean reversion strategy, utilizing the overbought/oversold properties of RSI indicator to determine trading signals. The advantages are:
- Adopting RSI indicator to judge market structure, which is quite reliable
- MA filter avoids unnecessary trades and enhances stability
- Adjustable trading range controls frequency
- Simple logic and easy to understand
In summary, it is a simple and practical short-term trading strategy.
Risk Analysis
There are some risks to note:
- Possibility of RSI giving false signals, need to watch the pattern
- Improper trading range setting may lead to overtrading or missing opportunities
- High trading frequency, need to consider transaction costs
- Relying solely on single indicator, prone to market anomalies
These risks can be alleviated through parameter tuning, adding filters etc.
Optimization Directions
The strategy can be optimized in the following aspects:
- Add more filters like volume to ensure signals only at turning points
- Add stop loss to control single trade loss
- Optimize trading range to balance frequency and profit rate
- Utilize machine learning to find optimal parameter sets
- Add ensemble models to integrate results from sub-strategies
Significant performance lift can be achieved via multi-indicator combos, stop loss management, parameter optimization etc.
Summary
In summary, this is a very typical and practical short-term trading strategy. It capitalizes on overbought/oversold levels of RSI to determine entries and exits, with additional MA filter. The logic is simple and clear, parameters flexible, easy to implement. There are certain market risks, but can be addressed via refining entry/exit mechanisms, parameter tuning etc. When combined with more technical indicators and risk management techniques, this strategy can become a relatively stable short-term strategy.
[/trans]
Strategy Arguments
| Argument | Default | Description |
|---|---|---|
| v_input_int_1 | 10 | frequency |
| v_input_int_2 | 40 | rsiFrequency |
| v_input_int_3 | 5 | buyZoneDistance |
| v_input_int_4 | 3 | avgDownATRSum |
| v_input_bool_1 | true | useAbsoluteRSIBarrier |
Source (PineScript)
/*backtest
start: 2022-11-24 00:00:00
end: 2023-11-30 00:00:00
period: 1d
basePeriod: 1h
exchanges: [{"eid":"Futures_Binance","currency":"BTC_USDT"}]
*/

// This source code is subject to the terms of the Mozilla Public License 2.0 at https://mozilla.org/MPL/2.0/
// © I11L

//@version=5
strategy("I11L - Meanreverter 4h", overlay=false, pyramiding=3, default_qty_value=10000, initial_capital=10000, default_qty_type=strategy.cash,process_orders_on_close=false, calc_on_every_tick=false)

frequency = input.int(10)
rsiFrequency = input.int(40)
buyZoneDistance = input.int(5)
avgDownATRSum = input.int(3)
useAbsoluteRSIBarrier = input.bool(true)
barrierLevel = 50//input.int(50)

momentumRSI = ta.rsi(close,rsiFrequency)
momentumRSI_slow = ta.sma(momentumRSI,frequency)

isBuy = momentumRSI < momentumRSI_slow*(1-buyZoneDistance/100) and (strategy.position_avg_price - math.sum(ta.atr(20),avgDownATRSum)*strategy.opentrades > close or strategy.opentrades == 0 ) //and (momentumRSI < barrierLevel or not(useAbsoluteRSIBarrier))
isShort = momentumRSI > momentumRSI_slow*(1+buyZoneDistance/100) and (strategy.position_avg_price - math.sum(ta.atr(20),avgDownATRSum)*strategy.opentrades > close or strategy.opentrades == 0 ) and (momentumRSI > barrierLevel or not(useAbsoluteRSIBarrier))
momentumRSISoftClose = (momentumRSI > momentumRSI_slow) and (momentumRSI > barrierLevel or not(useAbsoluteRSIBarrier))

isClose = momentumRSISoftClose

plot(momentumRSI,color=isClose ? color.red :  momentumRSI < momentumRSI_slow*(1-buyZoneDistance/100) ? color.green : color.white)
plot(momentumRSI_slow,color=color.gray)
plot(barrierLevel,color=useAbsoluteRSIBarrier ? color.white : color.rgb(0,0,0,0))
plot(momentumRSI_slow*(1-buyZoneDistance/100),color=color.gray)
plot(momentumRSI_slow*(1+buyZoneDistance/100),color=color.gray)
plot(momentumRSI_slow*(1+(buyZoneDistance*2)/100),color=color.gray)

// plot(strategy.wintrades - strategy.losstrades)


if(isBuy)
    strategy.entry("Buy",strategy.long, comment="#"+str.tostring(strategy.opentrades+1))

// if(isShort)
//     strategy.entry("Sell",strategy.short, comment="#"+str.tostring(strategy.opentrades+1))

if(isClose)
    strategy.exit("Close",limit=close)
Detail
https://www.fmz.com/strategy/433951
Last Modified
2023-12-01 16:59:26