
7.5 KiB
Name
基于MACD指标的双均线交易策略MACD-Dual-Moving-Average-Tracking-Strategy
Author
ChaoZhang
Strategy Description
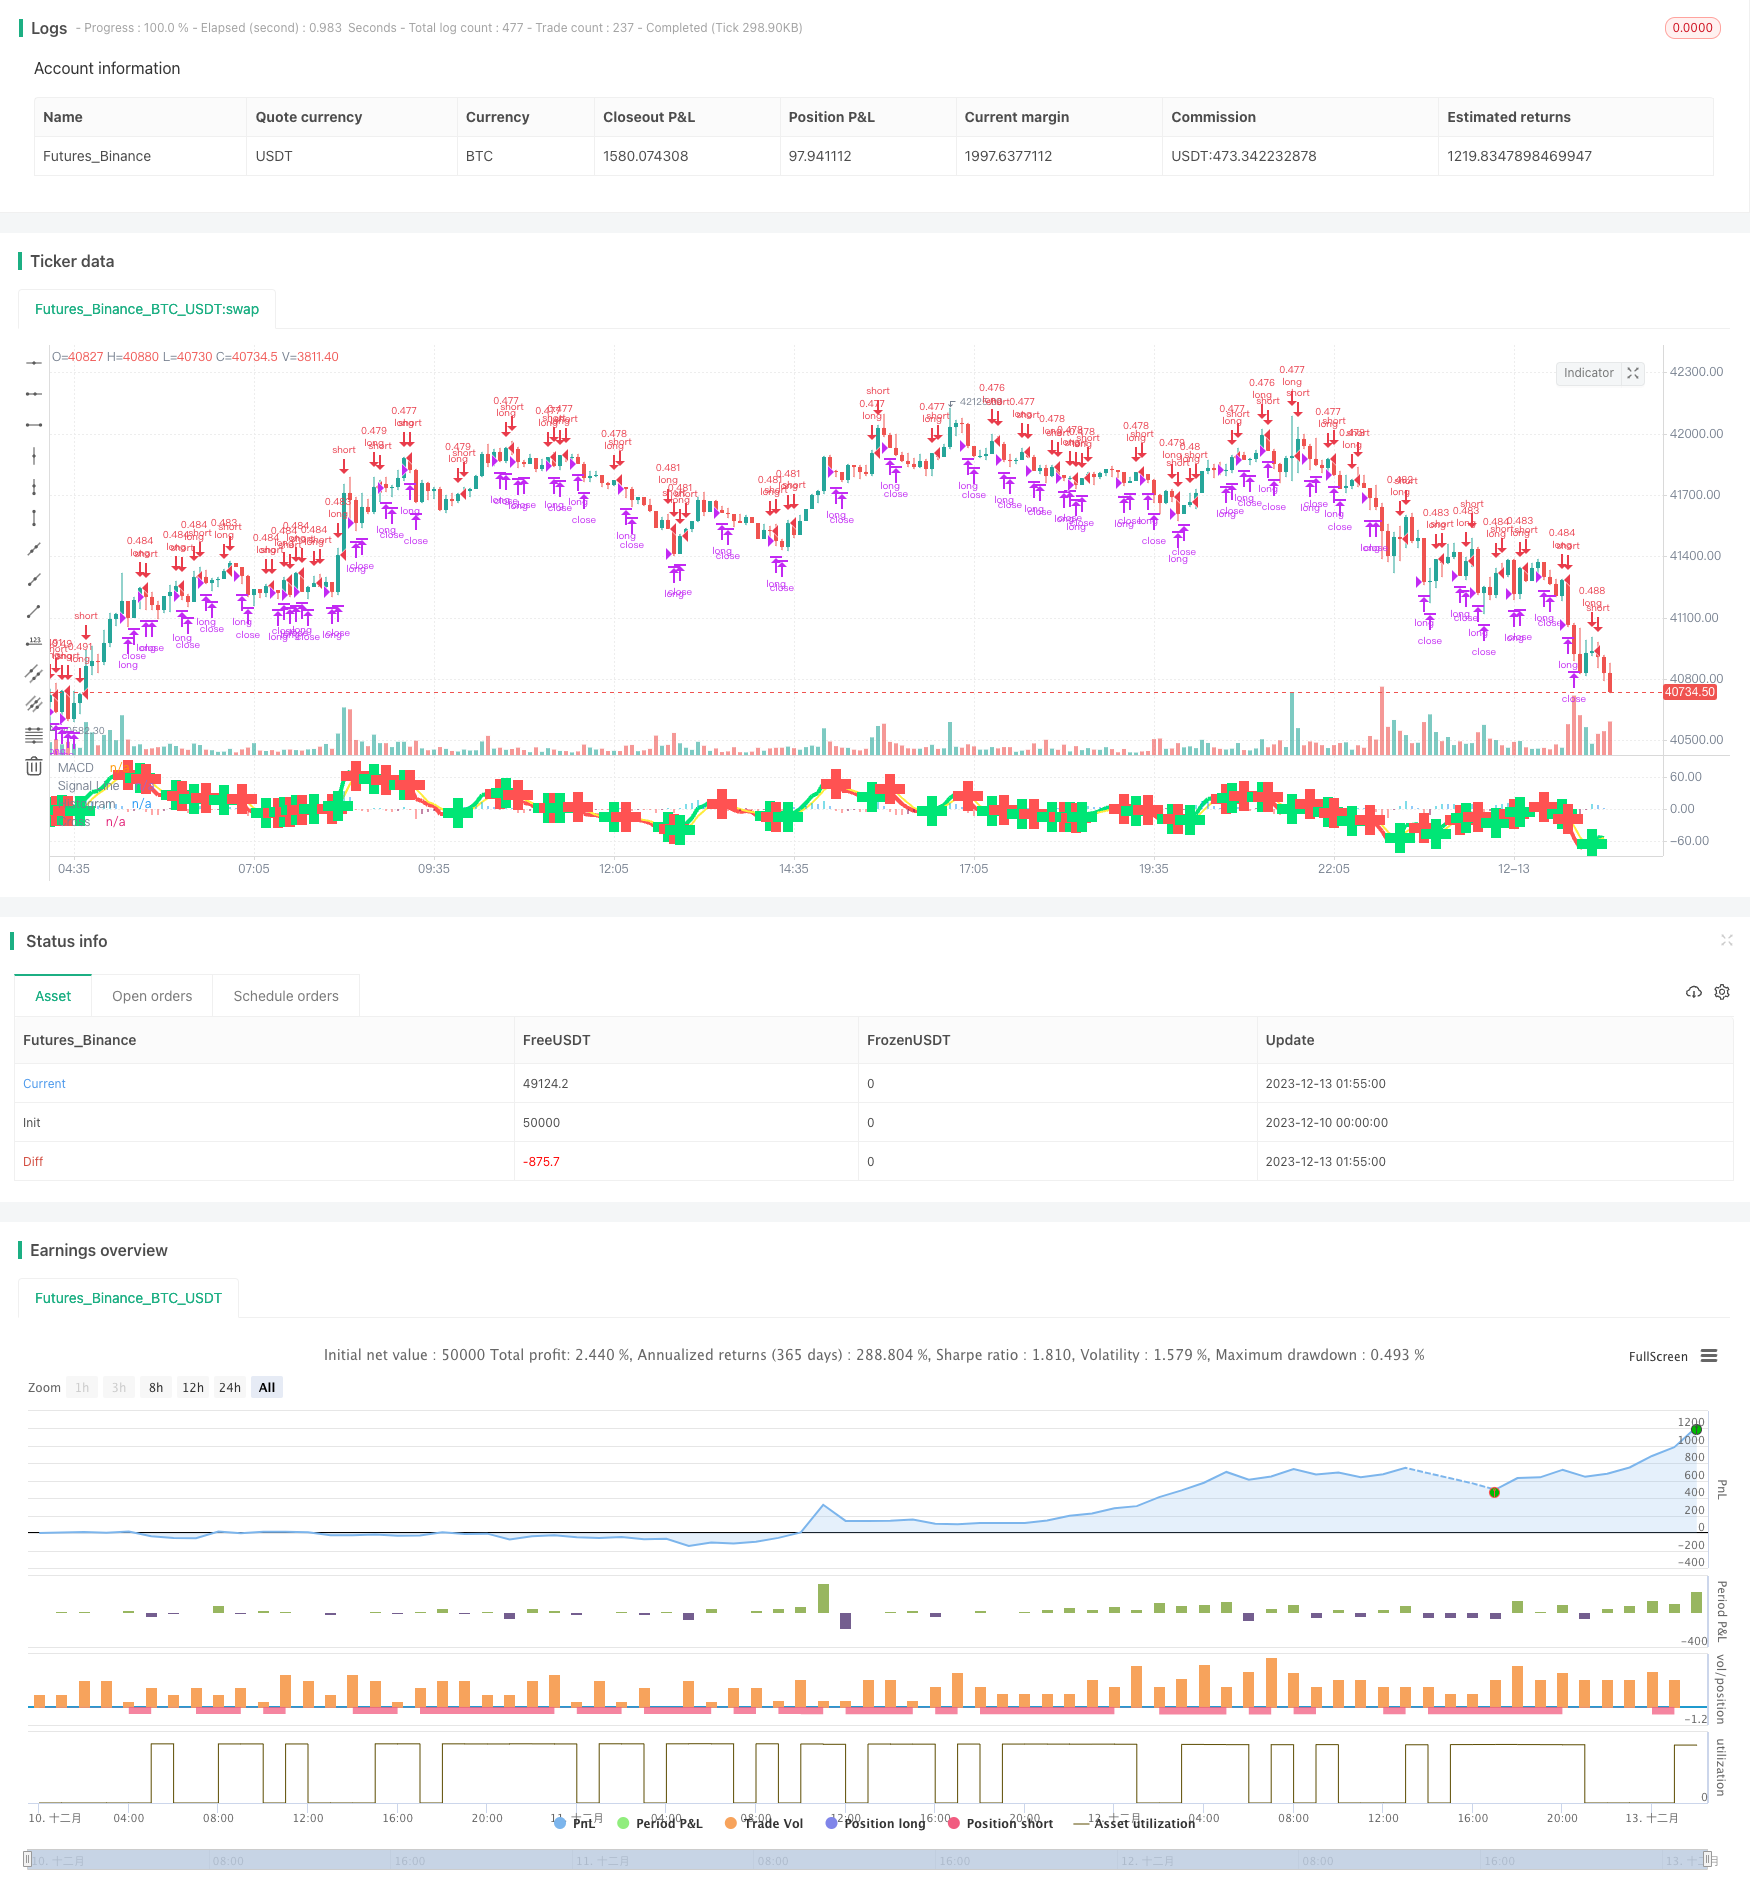 [trans]
概述
本策略名为MACD双均线追踪策略,采用MACD指标的双均线金叉死叉作为交易信号,结合昨日最低价作为止损点,追踪股价短线移动。
策略原理
- 计算快线EMA(close,5)、慢线EMA(close,8)和信号线SMA(MACD,3)
- 定义多头信号:快线上穿慢线时做多
- 定义空头信号:快线下穿慢线或当日收盘价低于昨日最低价时做空
- 持仓量为初始资金2000美元除以收盘价
- 多头止损使用空头信号平仓
优势分析
- 使用MACD指标判断市场超买超卖区域,配合双均线形成交易信号,避免假突破
- 追踪短期趋势,及时止损
- 持仓量动态调整,避免单笔损失过大
风险分析
- MACDIndicator存在滞后,可能错过短线机会
- 双均线交易信号可能产生假信号
- 止损点过于激进,存在过度频繁止损的可能
优化方向
- 优化MACD参数组合,提高指标敏感性
- 增加趋势判断,避免震荡市产生的假信号
- 结合Volatility Index评估市场波动率,调整止损点
总结
本策略采用经典的MACD双均线组合指标判断超买超卖区间,产生交易信号,同时引入动态持仓量和前日最低价的止损点设计,针对股价的短线波动特征进行捕捉,整体策略思路清晰易懂,值得进一步测试优化。
||
Overview
This strategy is named MACD Dual Moving Average Tracking Strategy. It uses MACD indicator’s golden cross and death cross of dual moving averages as trading signals, combined with the previous day’s lowest price as the stop loss point to track the short-term price movement.
Strategy Logic
- Calculate fast EMA(close,5), slow EMA(close,8) and signal SMA(MACD,3)
- Define long signal: when fast MA crosses above slow MA
- Define short signal: when fast MA crosses below slow MA or closing price is lower than previous day’s lowest price
- Position size is initial capital 2000 USD divided by closing price
- Use short signal to close long position as stop loss
Advantage Analysis
- Use MACD indicator to determine overbought and oversold zones, with dual MAs to form trading signals, avoiding false breakout
- Track short-term trends, timely stop loss
- Dynamic adjustment of position size avoids excessively large single loss
Risk Analysis
- MACD indicator has lagging effect, may miss short-term opportunities
- Dual MA trading signals may produce false signals
- Stop loss point is too aggressive, with high frequency of being stopped out
Optimization Directions
- Optimize MACD parameters combination to improve indicator sensitivity
- Add trend judgment to avoid false signals from market consolidation
- Combine with Volatility Index to assess market volatility, adjust stop loss point
Summary
This strategy uses the classic MACD dual moving average combination indicator to determine overbought and oversold zones, generating trading signals, while introducing dynamic position sizing and previous day’s lowest price as stop loss point design to capture short-term price fluctuations. The overall strategy logic is clear and easy to understand, worth further testing and optimization.
[/trans]
Strategy Arguments
| Argument | Default | Description |
|---|---|---|
| v_input_1 | true | Use Current Chart Resolution? |
| v_input_2 | 60 | Use Different Timeframe? Uncheck Box Above |
| v_input_3 | true | Show MacD & Signal Line? Also Turn Off Dots Below |
| v_input_4 | true | Show Dots When MacD Crosses Signal Line? |
| v_input_5 | true | Show Histogram? |
| v_input_6 | true | Change MacD Line Color-Signal Line Cross? |
| v_input_7 | true | MacD Histogram 4 Colors? |
| v_input_8 | true | Vender cuando closing price < previous day low? |
| v_input_9 | 5 | fastLength |
| v_input_10 | 8 | slowLength |
| v_input_11 | 3 | signalLength |
Source (PineScript)
/*backtest
start: 2023-12-10 00:00:00
end: 2023-12-13 02:00:00
period: 5m
basePeriod: 1m
exchanges: [{"eid":"Futures_Binance","currency":"BTC_USDT"}]
*/

//@version=2
// macd/cam v1 strategizing Chris Moody Macd indicator https://www.tradingview.com/script/OQx7vju0-MacD-Custom-Indicator-Multiple-Time-Frame-All-Available-Options/
// macd/cam v2 changing to macd 5,8,3
// macd/cam v2.1
//      Sell when lower than previous day low.
//      Initial capital of $2k. Buy/sell quantity of initial capital / close price
//      Quitar short action
//      Note: custom 1-week resolution seems to put AMD at 80% profitable

strategy(title="MACD/CAM 2.1", shorttitle="MACD/CAM 2.1") //
source = close
//get inputs from options
useCurrentRes = input(true, title="Use Current Chart Resolution?")
resCustom = input(title="Use Different Timeframe? Uncheck Box Above", defval="60")
smd = input(true, title="Show MacD & Signal Line? Also Turn Off Dots Below")
sd = input(true, title="Show Dots When MacD Crosses Signal Line?")
sh = input(true, title="Show Histogram?")
macd_colorChange = input(true,title="Change MacD Line Color-Signal Line Cross?")
hist_colorChange = input(true,title="MacD Histogram 4 Colors?")
venderLowerPrev = input(true,title="Vender cuando closing price < previous day low?")

res = useCurrentRes ? timeframe.period : resCustom

fastLength = input(5, minval=1), slowLength=input(8,minval=1)
signalLength=input(3,minval=1)

// find exponential moving average of price as x and fastLength var as y
fastMA = ema(source, fastLength)
slowMA = ema(source, slowLength)

macd = fastMA - slowMA
// simple moving average
signal = sma(macd, signalLength)
hist = macd - signal

outMacD = request.security(syminfo.tickerid, res, macd)
outSignal = request.security(syminfo.tickerid, res, signal)
outHist = request.security(syminfo.tickerid, res, hist)

histA_IsUp = outHist > outHist[1] and outHist > 0
histA_IsDown = outHist < outHist[1] and outHist > 0
histB_IsDown = outHist < outHist[1] and outHist <= 0
histB_IsUp = outHist > outHist[1] and outHist <= 0

//MacD Color Definitions
macd_IsAbove = outMacD >= outSignal
macd_IsBelow = outMacD < outSignal

plot_color = hist_colorChange ? histA_IsUp ? aqua : histA_IsDown ? blue : histB_IsDown ? red : histB_IsUp ? maroon :yellow :gray
macd_color = macd_colorChange ? macd_IsAbove ? lime : red : red
signal_color = macd_colorChange ? macd_IsAbove ? yellow : yellow : lime

circleYPosition = outSignal

plot(smd and outMacD ? outMacD : na, title="MACD", color=macd_color, linewidth=4)
plot(smd and outSignal ? outSignal : na, title="Signal Line", color=signal_color, style=line ,linewidth=2)
plot(sh and outHist ? outHist : na, title="Histogram", color=plot_color, style=histogram, linewidth=4)

circleCondition = sd and cross(outMacD, outSignal)

// Determine long and short conditions
longCondition  = circleCondition and macd_color == lime

redCircle = circleCondition and macd_color == red
redCirclePrevLow = redCircle or low<low[1]
shortCondition = redCircle
if (venderLowerPrev)
    shortCondition = redCirclePrevLow

strategy.initial_capital = 20000
// Set quantity to initial capital / closing price
cantidad = strategy.initial_capital/close

// Submit orders
strategy.entry(id="long", long=true, qty=cantidad, when=longCondition)
strategy.close(id="long", when=shortCondition)
plot(circleCondition ? circleYPosition : na, title="Cross", style=cross, linewidth=10, color=macd_color)
// hline(0, '0 Line', linestyle=solid, linewidth=2, color=white)
Detail
https://www.fmz.com/strategy/435722
Last Modified
2023-12-18 12:25:13