
12 KiB
Name
基于K线形态的动量突破交易策略momentum-breakout-trading-strategy
Author
ChaoZhang
Strategy Description
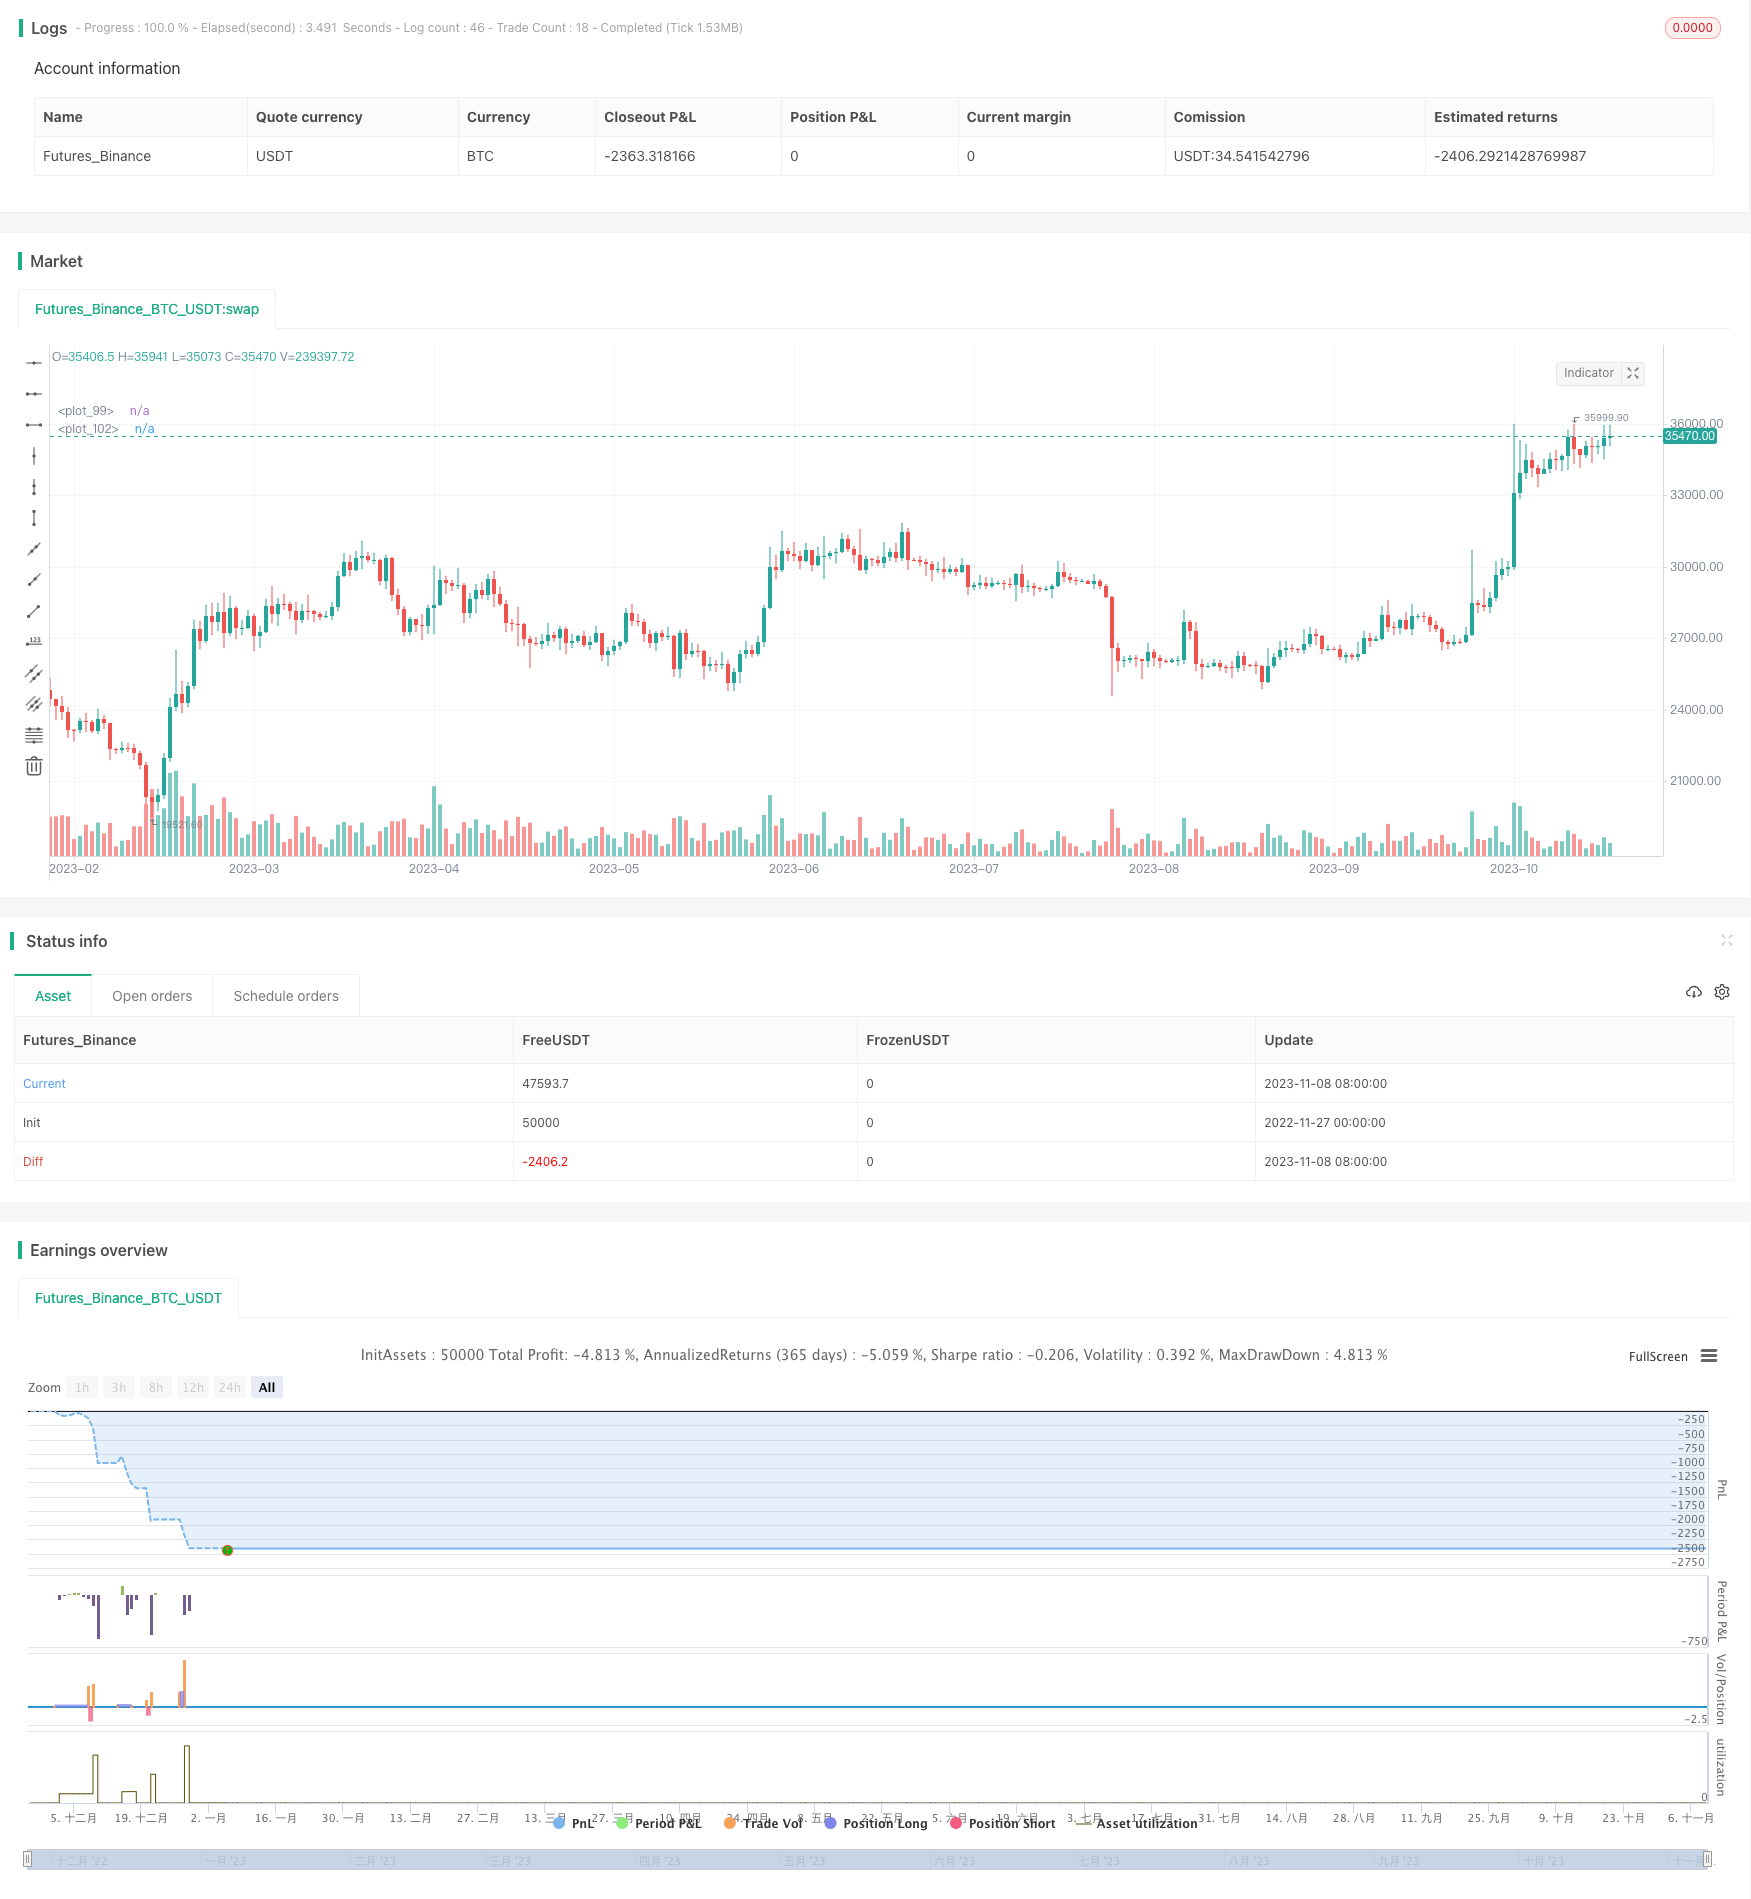 [trans]
本文介绍一种基于K线形态的动量突破交易策略。该策略通过识别蜡烛形态,判断市场趋势和进入时机。
策略概述
动量突破策略主要判断潜在的反转信号,通过识别多头吞噬形态或空头吞噬形态进入场内。识别到信号后,快速追踪趋势,实现超额收益。
策略原理
动量突破策略的核心判断逻辑基于识别吞噬形态,吞噬形态分为多头吞噬和空头吞噬两种。
多头吞噬是指当日收盘价高于开盘价,并且上一根K线的收盘价低于上一根K线的开盘价。这种形态通常预示着市场情绪的改变,多空心理发生逆转,因此是进行适当追涨的良好时机。
空头吞噬刚好与多头吞噬相反,是指当日收盘价低于开盘价,并且上一根K线的收盘价高于上一根K线的开盘价。这同样预示着市场情绪发生变化,因此也是空头介入的机会。
识别到吞噬形态后,动量突破策略会快速建立仓位,实现超额杠杆,追踪潜在的反转趋势。此外,策略还会动态调整止损价和止盈价,在保证盈利的同时严格控制风险。
策略优势
- 快速判断市场反转时机,捕捉潜在机会
- 风险收益比较匹配,止损止盈设置合理
- 杠杆率可调整,满足不同风险偏好
- 全自动交易,效率较高
策略风险
- 吞噬形态仅作为参考,不能完全确定反转
- 反转失败概率存在,可能形成窄幅震荡
- 杠杆过高容易爆仓
- 需要足够的资金支持适当仓位
针对风险,可以从以下几个方面进行优化:
- 结合其他指标过滤信号
- 适当调整杠杆限制风险
- 增加仓位建立步骤,分批成本均价
- 优化止盈止损策略,保证收益
策略优化
动量突破策略可以从以下几个维度进行优化:
-
多因子验证信号可靠性 可以加入均线、波动率等指标来验证吞噬信号,确保信号的可靠性。
-
结合情感指标判断市场心理 结合市场的恐慌指数、贪婪指数等情感判断指标,能更准确判断市场反转时机。
-
优化止盈止损策略 可以通过移动止损、渐进止盈、移动止盈等方式来锁定利润,降低回撤风险。
-
引入算法交易 可以用机器学习等算法模型来辅助判断交易信号,提高策略的自动化程度。
总结
动量突破策略整体来说是一种较为典型的反转策略。它通过捕捉关键的K线信号,快速判断并跟踪市场趋势反转。虽然仍存在一定的风险,但可以通过多种方式进行有效优化,将收益风险比控制在合理区间,适合积极进取型的投资者采用。
||
This article introduces a momentum breakout trading strategy based on candlestick patterns. The strategy identifies market trends and entry opportunities by recognizing candlestick formations.
Strategy Overview
The momentum breakout strategy mainly judges potential reversal signals by identifying bullish engulfing patterns or bearish engulfing patterns to enter the market. After identifying the signal, it quickly tracks the trend to achieve excess returns.
Strategy Principle
The core logic of the momentum breakout strategy is based on identifying engulfing patterns, including bullish engulfs and bearish engulfs.
A bullish engulfing pattern forms when the current period's closing price is higher than the opening price, and the previous period's closing price is lower than the previous period's opening price. This pattern often signals a reversal in market sentiment from bearish to bullish, making it a good opportunity to chase the uptrend.
A bearish engulfing pattern forms when the current period's closing price is lower than the opening price, and the previous period's closing price is higher than the previous period's opening price. This also signals a change in market sentiment, providing an opportunity to short the market.
After identifying an engulfing pattern, the momentum breakout strategy quickly establishes a position with excess leverage to track the potential reversal trend. It also dynamically adjusts the stop loss and take profit to control risk while locking in profits.
Advantages
- Quickly identify market reversal opportunities
- Balanced risk-reward ratio with proper stop loss and take profit
- Adjustable leverage catering to different risk appetites
- High efficiency with automated trading
Risks
- Engulfing patterns not fully ensuring reversal
- Probability of failed breakout and sideways price action
- Risk of liquidation from excess leverage
- Requiring sufficient capital to support adequate position sizing
Improvements
The strategy can be optimized in the following ways:
- Incorporate other indicators to filter signals
- Adjust leverage to limit risk
- Scale in to lower cost basis
- Optimize stop loss and take profit to lock in profits
Summary
The momentum breakout strategy is a typical mean-reversion strategy. By capturing key candlestick signals, it quickly judges and tracks market trend reversals. Although risks exist, the strategy can be effectively enhanced through multiple optimization techniques to control the risk-reward ratio. It suits aggressive investors seeking arbitrage-like returns.
[/trans]
Strategy Arguments
| Argument | Default | Description |
|---|---|---|
| v_input_1 | 2021 | syear |
| v_input_2 | true | smonth |
| v_input_3 | true | sday |
| v_input_4 | 2022 | fyear |
| v_input_5 | 12 | fmonth |
| v_input_6 | 31 | fday |
| v_input_7 | true | longs |
| v_input_8 | true | shorts |
| v_input_9 | 2.5 | rr |
| v_input_10 | true | position_risk_percent |
| v_input_string_1 | 0 | signal_bar_check: 3 |
| v_input_11 | 80 | margin_req |
| v_input_12 | 0.2 | sl_increase_factor |
| v_input_13 | false | tp_decrease_factor |
| v_input_14 | true | check_for_volume |
Source (PineScript)
/*backtest
start: 2022-11-27 00:00:00
end: 2023-11-09 05:20:00
period: 1d
basePeriod: 1h
exchanges: [{"eid":"Futures_Binance","currency":"BTC_USDT"}]
*/

//@version=5
strategy(title = "MomGulfing", shorttitle = "MomGulfing", overlay = true, initial_capital=10000, pyramiding=3, calc_on_order_fills=false, calc_on_every_tick=false, currency="USD", default_qty_type=strategy.cash, default_qty_value=1000, commission_type=strategy.commission.percent, commission_value=0.04)

syear = input(2021)
smonth = input(1)
sday = input(1)
fyear = input(2022)
fmonth = input(12)
fday = input(31)
start = timestamp(syear, smonth, sday, 01, 00)
finish = timestamp(fyear, fmonth, fday, 23, 59)
date = time >= start and time <= finish ? true : false

longs = input(true)
shorts = input(true)
rr = input(2.5)
position_risk_percent = input(1)/100
signal_bar_check = input.string(defval="3", options=["1", "2", "3"])
margin_req = input(80)
sl_increase_factor = input(0.2)
tp_decrease_factor = input(0.0)
check_for_volume = input(true)
var long_sl = 0.0
var long_tp = 0.0
var short_sl = 0.0
var short_tp = 0.0
var long_lev = 0.0
var short_lev = 0.0

initial_capital = strategy.equity
position_risk = initial_capital * position_risk_percent

bullishEngulfing_st = close[1] < open[1] and close > open and high[1] < close and (check_for_volume ? volume[1]<volume : true)
bullishEngulfing_nd = close[2] < open[2] and close[1] > open[1] and close > open and high[2] > close[1] and high[2] < close and (check_for_volume ? volume[2]<volume : true)
bullishEngulfing_rd = close[3] < open[3] and close[2] > open[2] and close[1] > open[1] and close > open and high[3] > close[2] and high[3] > close[1] and high[3] < close and (check_for_volume ? volume[3]<volume : true)
bullishEngulfing = signal_bar_check == "1" ? bullishEngulfing_st : signal_bar_check == "2" ? bullishEngulfing_st or bullishEngulfing_nd : bullishEngulfing_st or bullishEngulfing_nd or bullishEngulfing_rd
long_stop_level = bullishEngulfing_st ? math.min(low[1], low) : bullishEngulfing_nd ? math.min(low[2], low[1], low) : bullishEngulfing_rd ? math.min(low[3], low[2], low[1], low) : na
rr_amount_long = close-long_stop_level
long_exit_level = close + rr*rr_amount_long
long_leverage = math.floor(margin_req/math.floor((rr_amount_long/close)*100))

bearishEngulfing_st = close[1] > open[1] and close < open and low[1] > close and (check_for_volume ? volume[1]<volume : true)
bearishEngulfing_nd = close[2] > open[2] and close[1] < open[1] and close < open and low[2] < close[1] and low[2] > close and (check_for_volume ? volume[2]<volume : true)
bearishEngulfing_rd = close[3] > open[3] and close[2] < open[2] and close[1] < open[1] and close < open and low[3] < close[2] and low[3] < close[1] and low[3] > close and (check_for_volume ? volume[3]<volume : true)
bearishEngulfing = signal_bar_check == "1" ? bearishEngulfing_st : signal_bar_check == "2" ? bearishEngulfing_st or bearishEngulfing_nd : bearishEngulfing_st or bearishEngulfing_nd or bearishEngulfing_rd
short_stop_level = bearishEngulfing_st ? math.max(high[1], high) : bearishEngulfing_nd ? math.max(high[2], high[1], high) : bearishEngulfing_rd ? math.max(high[3], high[2], high[1], high) : na
rr_amount_short = short_stop_level-close
short_exit_level = close - rr*rr_amount_short
short_leverage = math.floor(margin_req/math.floor((rr_amount_short/short_stop_level)*100))

long = longs and date and bullishEngulfing
short = shorts and date and bearishEngulfing
bgcolor(long[1] ? color.new(color.teal, 80) : (short[1] ? color.new(color.purple, 80) : na))

if long and strategy.position_size <= 0
    long_lev := long_leverage

if short and strategy.position_size >= 0
    short_lev := short_leverage

long_pos_size = long_lev * position_risk
long_pos_qty = long_pos_size/close
short_pos_size = short_lev * position_risk
short_pos_qty = short_pos_size/close

if long
    if strategy.position_size <= 0
        long_sl := long_stop_level
        long_tp := long_exit_level

    else if strategy.position_size > 0
        long_sl := long_stop_level + sl_increase_factor*rr_amount_long
        long_tp := long_exit_level - tp_decrease_factor*rr_amount_long

    strategy.entry("L"+str.tostring(long_lev)+"X", strategy.long, qty=long_pos_qty)
    label_text = str.tostring(long_lev)+"X\nSL:"+str.tostring(long_sl)+"\nTP:"+str.tostring(long_tp)
    label.new(bar_index+1, na, text=label_text, color=color.green, style=label.style_label_up, xloc=xloc.bar_index, yloc=yloc.belowbar)

else if short
    if strategy.position_size >= 0
        short_sl := short_stop_level
        short_tp := short_exit_level

    else if strategy.position_size < 0
        short_sl := short_stop_level - sl_increase_factor*rr_amount_short
        short_tp := short_exit_level + tp_decrease_factor*rr_amount_short

    strategy.entry("S"+str.tostring(short_lev)+"X", strategy.short, qty=short_pos_qty)
    label_text = str.tostring(short_lev)+"X\nSL:"+str.tostring(short_sl)+"\nTP:"+str.tostring(short_tp)
    label.new(bar_index+1, na, text=label_text, color=color.red, style=label.style_label_down, xloc=xloc.bar_index, yloc=yloc.abovebar)

if (strategy.position_size > 0)
    strategy.exit(id="L TP/SL", stop=long_sl, limit=long_tp)

if (strategy.position_size < 0)
    strategy.exit(id="S TP/SL", stop=short_sl, limit=short_tp)

sl_level = strategy.position_size > 0 ? long_sl : strategy.position_size < 0 ? short_sl : na
plot(sl_level, color=color.red, style=plot.style_linebr)

tp_level = strategy.position_size > 0 ? long_tp : strategy.position_size < 0 ? short_tp : na
plot(tp_level, color=color.green, style=plot.style_linebr)
Detail
https://www.fmz.com/strategy/433512
Last Modified
2023-11-28 10:33:31