
7.6 KiB
Name
基于EMA和ATR止损的趋势跟踪策略EMA-Strategy-with-ATR-Stop-Loss
Author
ChaoZhang
Strategy Description
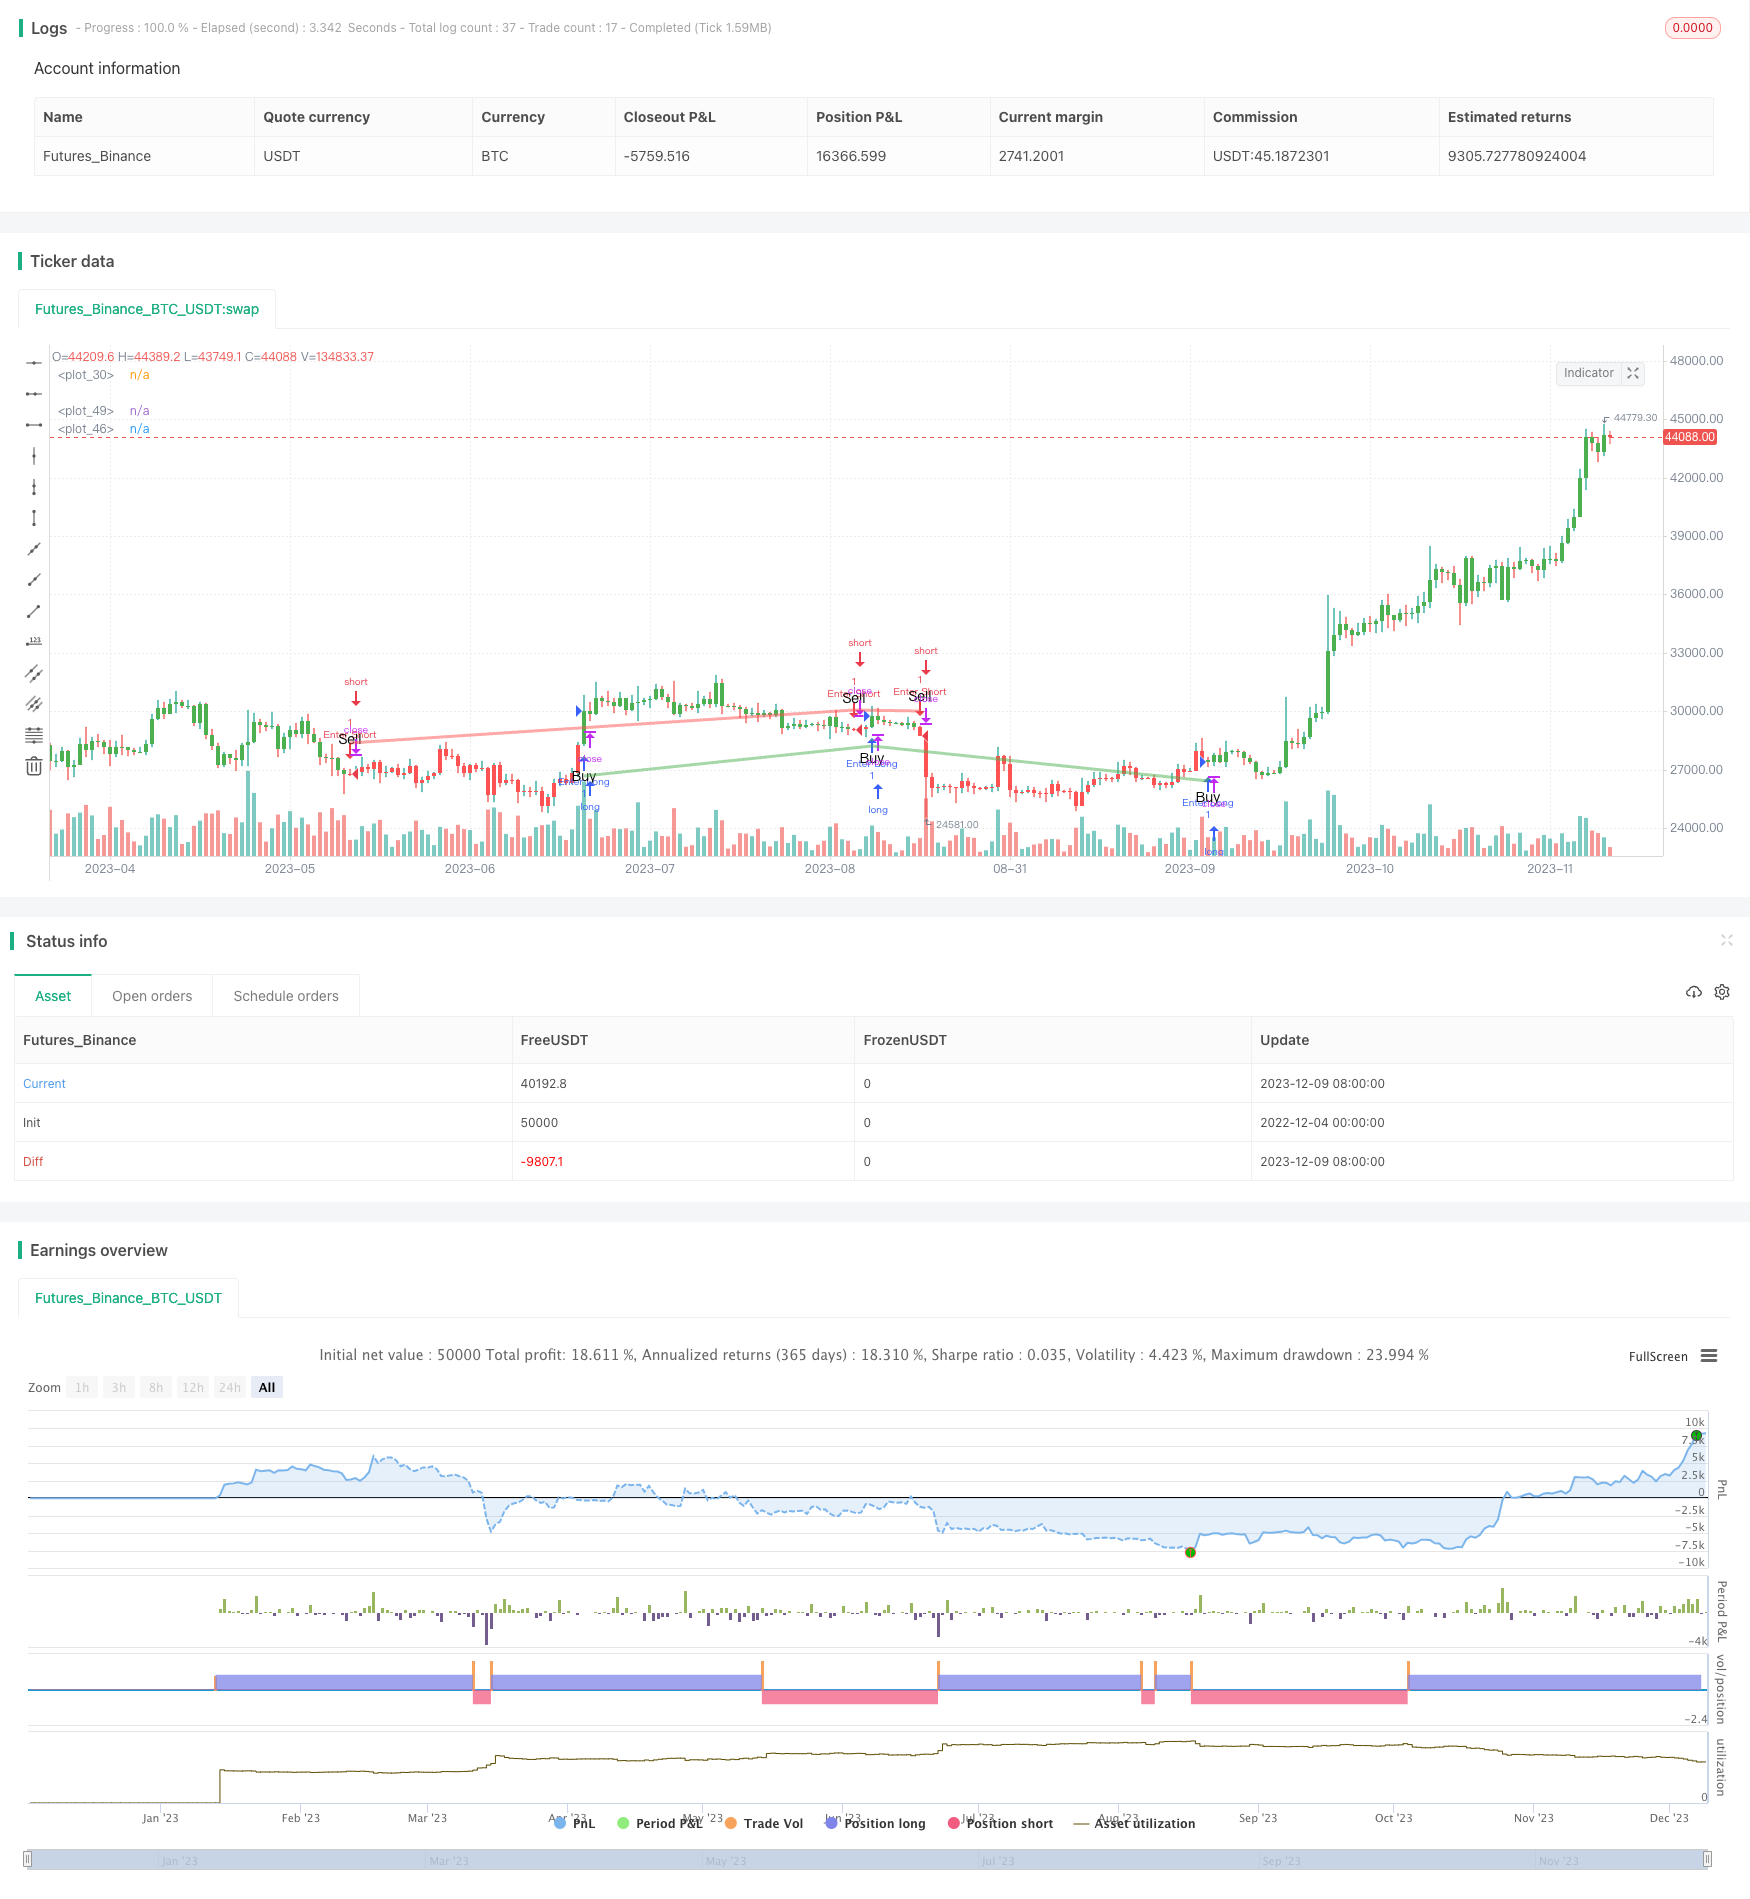 [trans]
概述
该策略采用EMA均线 golden cross 生成交易信号,即快速EMA线上穿慢速EMA线时产生买入信号,快速EMA线下穿慢速EMA线时产生卖出信号,属于典型的趋势跟踪策略。同时,策略利用ATR指标设定动态止损位,在保证盈利的同时控制风险。
策略原理
- 定义快速EMA均线周期为13,慢速EMA均线周期为48。
- 当快速EMA线上穿慢速EMA线时,产生买入信号;当快速EMA线下穿慢速EMA线时,产生卖出信号。
- 通过ta.crossover和ta.crossunder函数判断均线金叉死叉。
- 采用ATR指标计算动态止损位,止损位距离为close的1.5倍ATR。
- 通过颜色变化、买卖标记、止损线直观显示交易信号和止损位。
策略优势分析
- 基于EMA均线的金叉死叉产生信号,避免错过市场主要趋势,收益较为可观。
- ATR动态跟踪止损,既确保了充分顺势获利,也控制了回撤风险,整体风险收益比较平衡。
- 直观的信号显示和止损显示,操作简单,适合多数人。
- 可调整的参数较少,容易掌握和优化。
策略风险分析
- 突发事件造成暴跌可能触发止损。
- 震荡行情中可能产生频繁无效信号。
- 参数设置不当可能导致过于激进入场或止损过于宽松。
- 需适当优化EMA参数和ATR参数。
解决方法:
- 可适当放宽ATR倍数,确保止损离最近高点有一定缓冲。
- 可考虑在信号产生后有确认机制,如价格突破前高点等。
- 建议参数优化要全面考量多种市场情况。
策略优化方向
- 可以测试不同的参数组合,寻找最佳参数。
- 可以考虑加入其他指标进行信号过滤,例如成交量指标、波动率指标等,提高信号质量。
- 可以根据大级别趋势调整EMA参数,更好捕捉主要趋势。
- 可以考虑动态调整ATR止损倍数,在趋势行情中扩大止损范围。
- 可以结合机器学习算法自适应优化参数。
总结
该策略整体较为简单易用,基于EMA均线产生信号,顺势而为,再辅以ATR指标追踪止损,可以有效控制风险。虽然会有一定假信号,但捕捉主要趋势的能力较强,收益较为稳定,适合作为量化交易的基础策略之一。通过参数优化和功能扩展还具有很大的改进空间,值得深入研究。 ||
Overview
This strategy uses the EMA golden cross to generate trading signals, that is, a buy signal is generated when the fast EMA line crosses above the slow EMA line, and a sell signal is generated when the fast EMA line crosses below the slow EMA line. It belongs to a typical trend following strategy. At the same time, the strategy uses the ATR indicator to set a dynamic stop loss to control risks while ensuring profits.
Strategy Principle
- Define the fast EMA period as 13 and the slow EMA period as 48.
- When the fast EMA line crosses above the slow EMA line, a buy signal is generated; when the fast EMA line crosses below the slow EMA line, a sell signal is generated.
- Use the ta.crossover and ta.crossunder functions to determine golden cross and death cross of moving averages.
- Use the ATR indicator to calculate the dynamic stop loss, which is 1.5 times the ATR away from the close.
- Intuitively display trading signals and stop loss levels through color changes, buy/sell marks and stop loss lines.
Advantage Analysis
- Signals are generated based on EMA golden cross and death cross, which avoids missing major market trends and returns are considerable.
- ATR trailing stop loss ensures adequate trend-following profits while controlling drawdowns, achieving a balanced risk-reward ratio.
- Intuitive signal display and stop loss display, easy to operate, suitable for most people.
- Few adjustable parameters, easy to grasp and optimize.
Risk Analysis
- Flash crashes may trigger the stop loss.
- Frequent invalid signals may occur in ranging markets.
- Improper parameter settings may result in overly aggressive entry or loose stop loss.
- EMA parameters and ATR parameters need proper optimization.
Solutions:
- Appropriately loosen the ATR multiplier to leave some buffer from recent highs.
- Consider confirmation mechanisms after signal occurs, such as price breaking previous high etc.
- Parameter optimization should take into account various market conditions.
Optimization Directions
- Test different parameter combinations to find optimum parameters.
- Consider adding other indicators for signal filtering, such as volume, volatility indicators etc to improve signal quality.
- Adjust EMA parameters according to major trends to better capture main trends.
- Consider dynamically adjusting ATR stop loss multiplier to expand stop range during trending markets.
- Incorporate machine learning algorithms for adaptive parameter optimization.
Conclusion
The strategy is relatively simple and easy to use. It generates signals based on EMA crossovers, follows the trend, and uses ATR trailing stop loss to effectively control risks. Although there may be some false signals, it has strong capabilities in capturing main trends and returns are relatively stable. It is suitable as a basic quantitative trading strategy. There is also great potential for improvements through parameter optimization and function extensions. [/trans]
Strategy Arguments
| Argument | Default | Description |
|---|---|---|
| v_input_1 | 13 | EMA Length 1 |
| v_input_2 | 48 | EMA Length 2 |
Source (PineScript)
/*backtest
start: 2022-12-04 00:00:00
end: 2023-12-10 00:00:00
period: 1d
basePeriod: 1h
exchanges: [{"eid":"Futures_Binance","currency":"BTC_USDT"}]
*/

// This source code is subject to the terms of the Mozilla Public License 2.0 at https://mozilla.org/MPL/2.0/
// © byee322

/// This strategy uses the EMA to generate buy and sell signals with a 1.5x ATR stop loss
//@version=5
strategy("EMA Strategy with ATR Stop Loss", overlay=true)

// Define the EMA lengths as input parameters
emaLength1 = input(13, "EMA Length 1")
emaLength2 = input(48, "EMA Length 2")

// Define the moving averages
ema1 = ta.ema(close, emaLength1)
ema2 = ta.ema(close, emaLength2)

// Buy signal: EMA 1 crosses above EMA 2
buy = ta.crossover(ema1, ema2)

// Sell signal: EMA 1 crosses below EMA 2
sell = ta.crossunder(ema1, ema2)

// Define the state variable
state = 0
state := buy ? 1 : sell ? -1 : nz(state[1])

// Change the color of the candles
color = state == 1 ? color.green : state == -1 ? color.red : na

// Plot the colored candles
plotcandle(open, high, low, close, color=color)

// Plot the signals on the chart with text labels
plotshape(buy, style=shape.triangleup, color=color.new(color.green, 50), location=location.belowbar, text="Buy")
plotshape(sell, style=shape.triangledown, color=color.new(color.red, 50), location=location.abovebar, text="Sell")

// Calculate the ATR
atrVal = ta.atr(14)

// Calculate the stop loss level for buy
stopLossBuy = buy ? close[1] - 1.5 * atrVal : na

// Calculate the stop loss level for sell
stopLossSell = sell ? close[1] + 1.5 * atrVal : na

// Plot the stop loss level for buy
plot(stopLossBuy,  color=color.new(color.green, 50), linewidth=3)

// Plot the stop loss level for sell
plot(stopLossSell, color=color.new(color.red, 50), linewidth=3)

if buy
    strategy.entry("Enter Long", strategy.long)
else if sell
    strategy.entry("Enter Short", strategy.short)
Detail
https://www.fmz.com/strategy/434999
Last Modified
2023-12-11 16:00:09