
9.0 KiB
Name
基于CT-TTM指标的量化交易策略CT-TTM-Squeeze-Based-Quantitative-Trading-Strategy
Author
ChaoZhang
Strategy Description
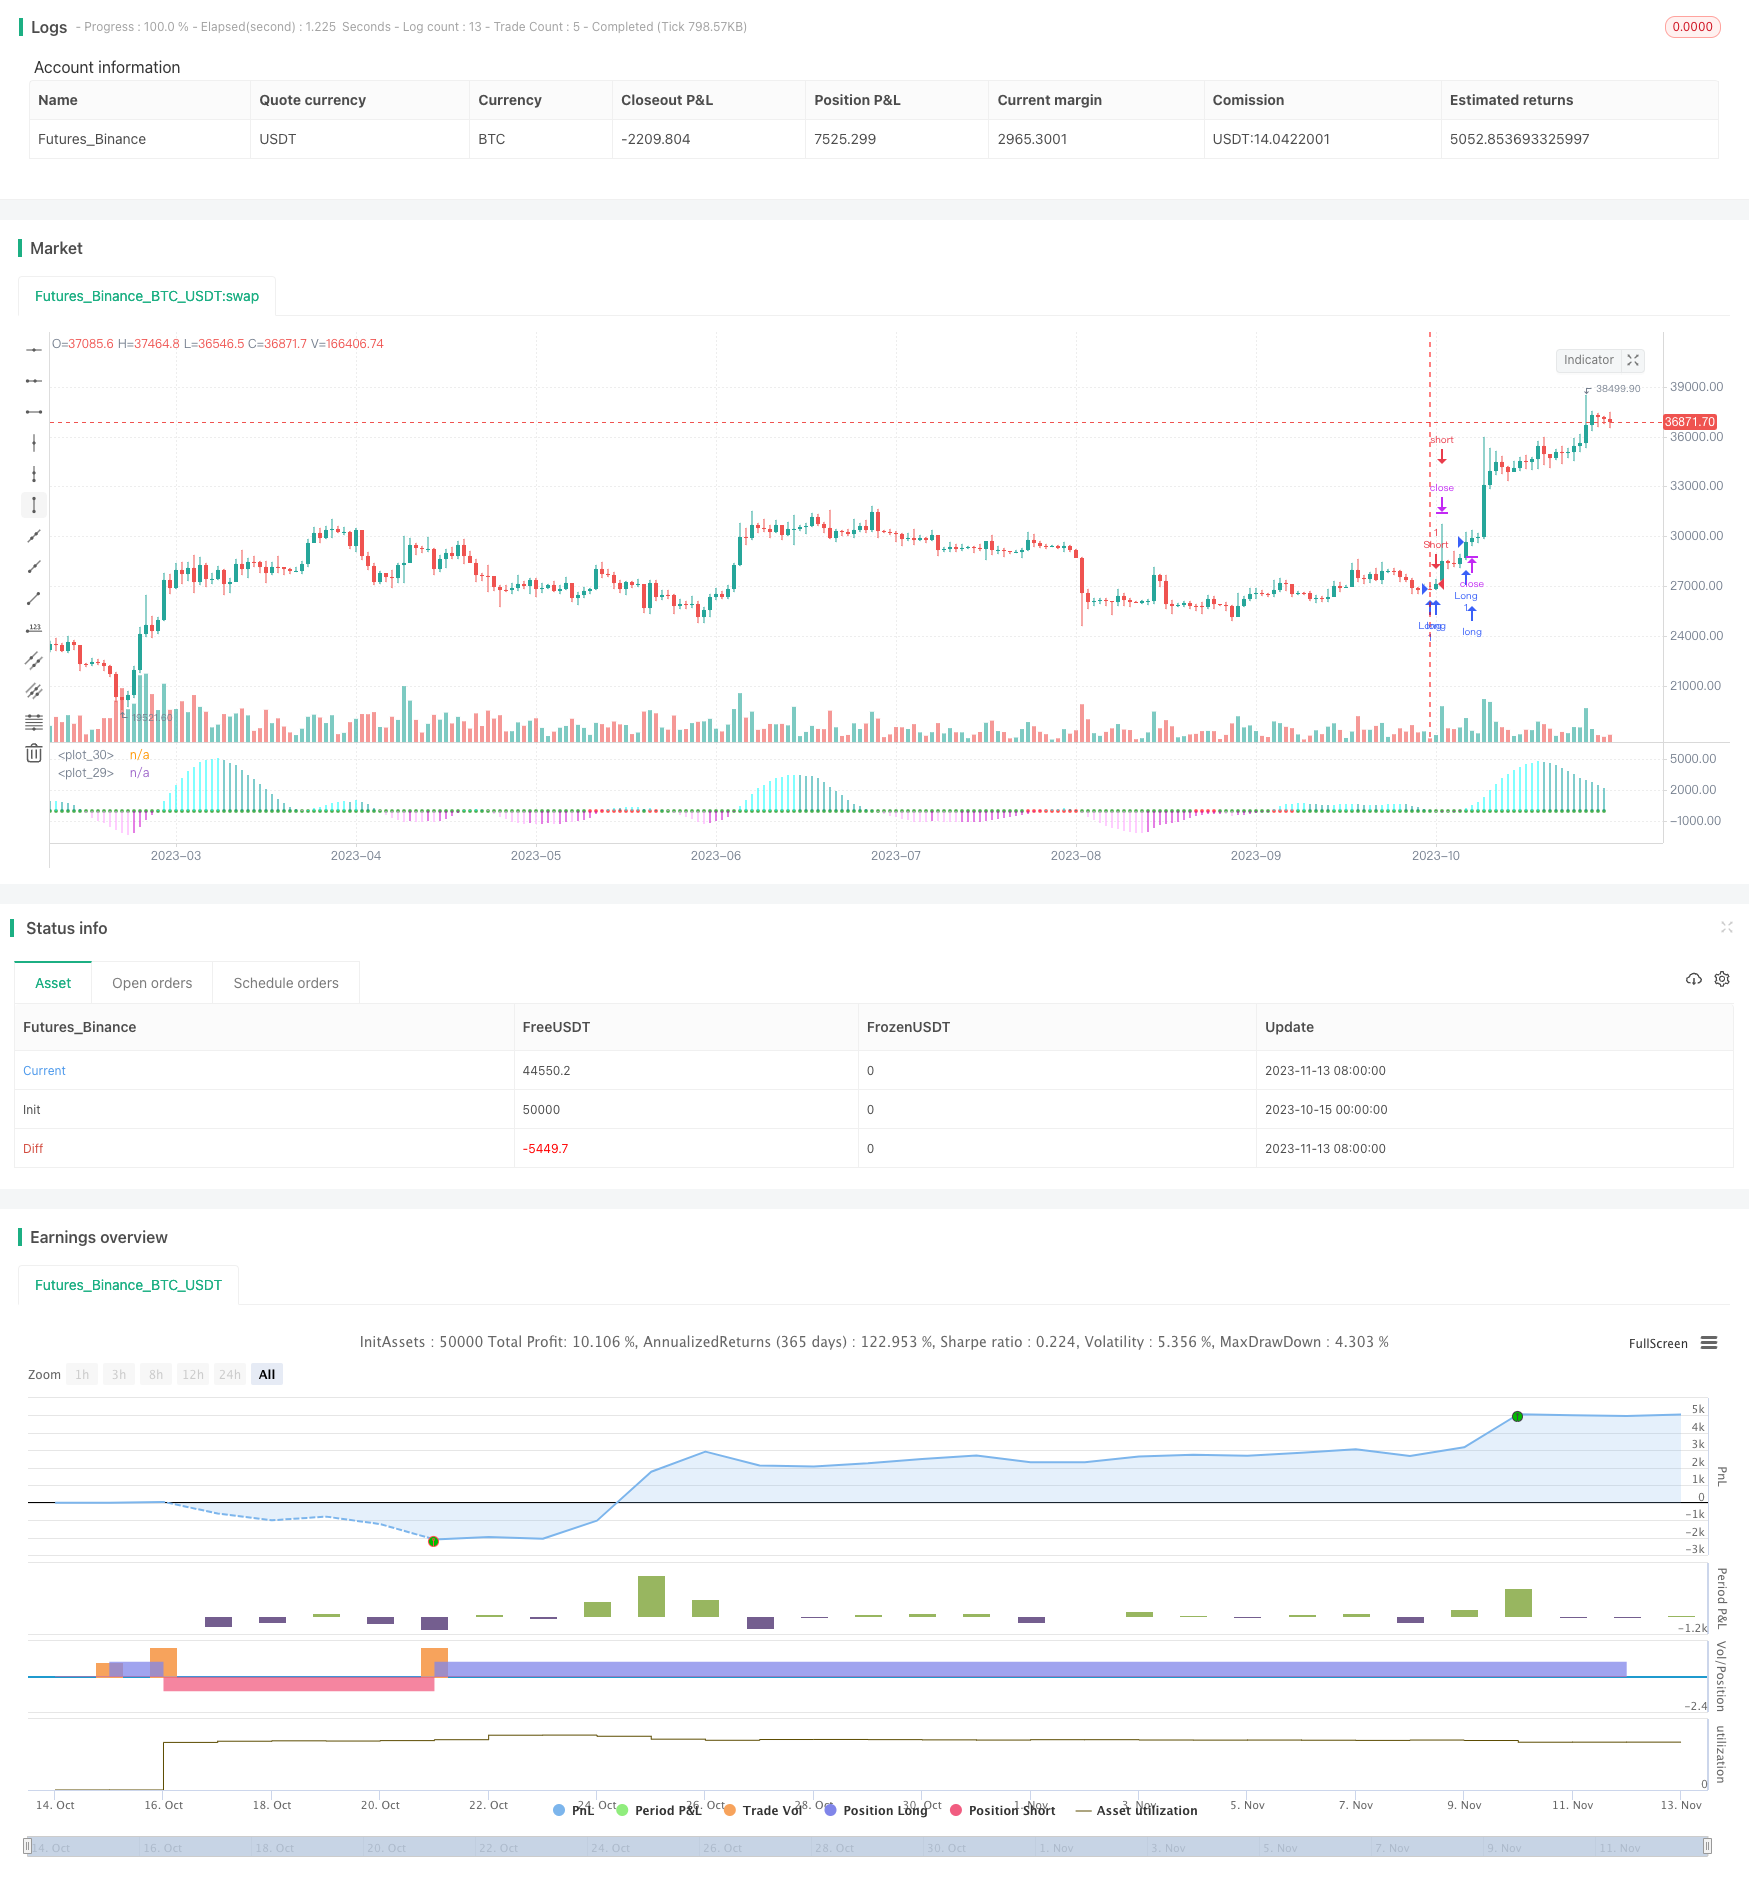 [trans]
概述
该策略运用CT TTM指标来识别价格的趋势,采用追踪止损来控制风险。策略名为“基于CT TTM指标的趋势跟踪策略”。
策略原理
该策略使用CT TTM指标来判断价格趋势。具体来说,策略中定义了以下变量:
- e1 - 中间带的中间价位
- osc - 通过计算e1周期收盘价与e1的差值并进行线性回归得到的振荡器
- diff - 布林带和肯特纳通道之间的差值
- osc_color - 指定osc的不同颜色
- mid_color - 指定diff的不同颜色
如果osc上穿0轴,则显示为绿色,表示多头;如果osc下穿0轴,显示为红色,表示空头。
当osc为正时,做多;当osc为负时,做空。
该策略使用振荡器osc判断趋势方向,并以diff来判断多空力度。当振荡器osc上穿0轴时,认为行情由下向上,做多;当osc下穿0轴时,认为行情由上向下,做空。
策略优势分析
该策略具有以下优势:
-
使用CT TTM指标判断趋势,准确率较高。CT TTM指标综合考虑了移动平均线、布林带和肯特纳通道,能够有效识别价格趋势。
-
应用振荡器来判断 specific 多空节点,可以避免在非趋势区域发出错误信号。振荡器能够有效过滤价格小幅震荡对交易信号的影响。
-
采用追踪止损来控制风险,可以有效限制每单损失。策略中在入场后及时设置止损,可锁定盈利并最大程度避免亏损扩大。
-
策略参数较少,容易优化。该策略仅依赖长度length一个参数,便于快速测试找到最佳参数组合。
-
绘图功能完善,可以清晰看到信号。策略采用不同颜色区分多空信号及力度,直观显示趋势判断结果。
策略风险分析
该策略也存在以下风险:
-
CT TTM指标在某些市场情况下可能发出错误信号,导致交易亏损。当价格出现剧烈波动时,指标可能产生错误的多空信号。
-
振荡器发生背离时,可能出现交易信号错误。当价格已经反转但振荡器尚未转向时,会造成错误信号。
-
追踪止损过于激进可能造成无谓损失。当止损点设置过近时,正常波动可能触发追踪止损而被迫离场。
-
该策略仅适用于趋势性较强的品种,不适合盘整市。策略以趋势交易为主,在盘整震荡市场中效果不佳。
-
优化过度可能导致曲线拟合。参数优化时应注意避免过度优化导致的回测曲线拟合问题。
策略优化方向
该策略可以从以下几个方面进行优化:
-
综合多个指标进行组合,提高信号准确率。可以加入MACD、KDJ等其他指标,优化entry信号。
-
加入止损方式优化模块,使止损更加智能化。可以测试参数自适应追踪止损、挂单止损等止损方式。
-
优化资金管理策略,测试固定份额、凯利公式等资金管理方式。优化后可以在保证单笔风险的前提下提高资金使用效率。
-
针对特定品种进行参数优化,提高策略适应性。根据不同交易品种的特点微调参数,能够提高策略对特定品种的拟合度。
-
增加机器学习算法,实现策略的自适应学习。使用RNN、LSTM等对策略进行增强,提高策略的自适应能力。
总结
本策略运用CT TTM指标判断趋势方向,以振荡器白数值作为entry信号,采取追踪止损管理风险。策略优势是准确率较高、参数优化容易,但也存在指标失灵、止损过于激进等风险。未来可通过多指标组合、止损优化、资金管理优化等方法进行提升,使策略效果更佳。
||
Overview
This strategy uses the CT TTM Squeeze indicator to identify price trends and applies trailing stops to control risks. The strategy is named "Trend Following Strategy Based on CT TTM Squeeze".
Strategy Logic
The strategy utilizes the CT TTM Squeeze indicator to determine price trends. Specifically, the following variables are defined in the strategy:
- e1 - midpoint of the middle band
- osc - oscillator calculated from the difference between close price and e1 over a period regressed linearly
- diff - difference between Bollinger Bands and Keltner Channels
- osc_color - designate oscillator colors
- mid_color - designate diff colors
If osc crosses above 0, it displays in green, indicating long; if osc crosses below 0, it displays in red, indicating short.
When osc is positive, go long; when osc is negative, go short.
The strategy uses the oscillator osc to determine trend direction and diff to gauge long/short momentum. When osc crosses above 0, it signals an uptrend, thus going long. When osc crosses below 0, it signals a downtrend, thus going short.
Advantage Analysis
The strategy has the following advantages:
-
Using CT TTM Squeeze to determine trends has a relatively high accuracy. CT TTM Squeeze comprehensively considers moving averages, Bollinger Bands and Keltner Channels, which can effectively identify price trends.
-
Applying the oscillator to determine long/short signals avoids false signals in non-trending zones. The oscillator can effectively filter out the impact of small price fluctuations on trading signals.
-
Trailing stops are used to control risks by limiting losses for each trade. The strategy sets stop loss timely after entry, which allows locking in profits and avoiding excessive losses.
-
The strategy has few parameters and is easy to optimize. With just the length parameter, it facilitates quick testing to find the optimal parameter combination.
-
The plotting functions clearly display the signals. Different colors are used to distinguish long/short signals and strength, visually presenting trend judgements.
Risk Analysis
The strategy also has the following risks:
-
CT TTM Squeeze may generate false signals in certain market conditions, leading to trading losses. It can produce incorrect long/short signals when prices fluctuate violently.
-
Divergence in the oscillator may result in wrong trading signals. Signals can be incorrect when prices have reversed but the oscillator has not turned.
-
Overly aggressive trailing stops may cause unnecessary losses. Normal fluctuations may trigger the trailing stop and force exit if the stop level is set too close.
-
The strategy is suitable for strongly trending products only, not for range-bound markets. Since it mainly trades trends, performance is poor in choppy consolidation markets.
-
Excessive optimization may lead to curve fitting. Care should be taken to avoid overfitting in parameter optimization.
Optimization Directions
The strategy can be optimized in the following aspects:
-
Combine multiple indicators for signal accuracy. Other indicators like MACD, KDJ can be added to optimize entry signals.
-
Add stop loss optimization modules for more intelligent stops. Trailing stop methods like adaptive stops, limit stops can be tested.
-
Optimize money management by testing fixed fractional, Kelly formula etc. This can improve capital use efficiency while ensuring per trade risk.
-
Fine tune parameters for specific products to improve adaptiveness. Adjusting parameters based on product characteristics can improve strategy fit.
-
Add machine learning algorithms for adaptive learning. Using RNN, LSTM etc. can enhance the strategy's adaptive capability.
Conclusion
This strategy uses CT TTM Squeeze to determine trend direction, oscillator crossing 0 as entry signals, and trailing stops to manage risks. Its advantages lie in high accuracy, easy optimization, but risks like indicator failure, overly tight stops exist. Future improvements can be made through multi-indicator combos, stop optimization, money management etc. to further enhance performance.
[/trans]
Strategy Arguments
| Argument | Default | Description |
|---|---|---|
| v_input_1 | 20 | Length |
Source (PineScript)
/*backtest
start: 2023-10-15 00:00:00
end: 2023-11-14 00:00:00
period: 1d
basePeriod: 1h
exchanges: [{"eid":"Futures_Binance","currency":"BTC_USDT"}]
*/

//@version=2
strategy("CT TTM Squeeze")
length = input(title="Length",  defval=20, minval=0)
bband(length, mult) =>
	sma(close, length) + mult * stdev(close, length)
keltner(length, mult) =>
	ema(close, length) + mult * ema(tr, length)


// Variables
e1 = (highest(high, length) + lowest(low, length)) / 2 + sma(close, length)
osc = linreg(close - e1 / 2, length, 0)
diff = bband(length, 2) - keltner(length, 1)
osc_color = osc[1] < osc[0] ? osc[0] >= 0 ? #00ffff : #cc00cc : osc[0] >= 0 ? #009b9b : #ff9bff
mid_color = diff >= 0 ? green : red

// Strategy

long = osc > 0
short = osc < 0

if long
    strategy.entry("Long", strategy.long)

if short
    strategy.entry("Short", strategy.short)


plot(osc, color=osc_color, style=histogram, linewidth=2)
plot(0, color=mid_color, style=circles, linewidth=3)
Detail
https://www.fmz.com/strategy/432215
Last Modified
2023-11-15 16:06:37