
6.9 KiB
Name
基于随机-RSI-和-EMA-的自主买入式震荡Scalper策略Stochastic-RSI-with-Auto-Buy-Scalper-Strategy
Author
ChaoZhang
Strategy Description
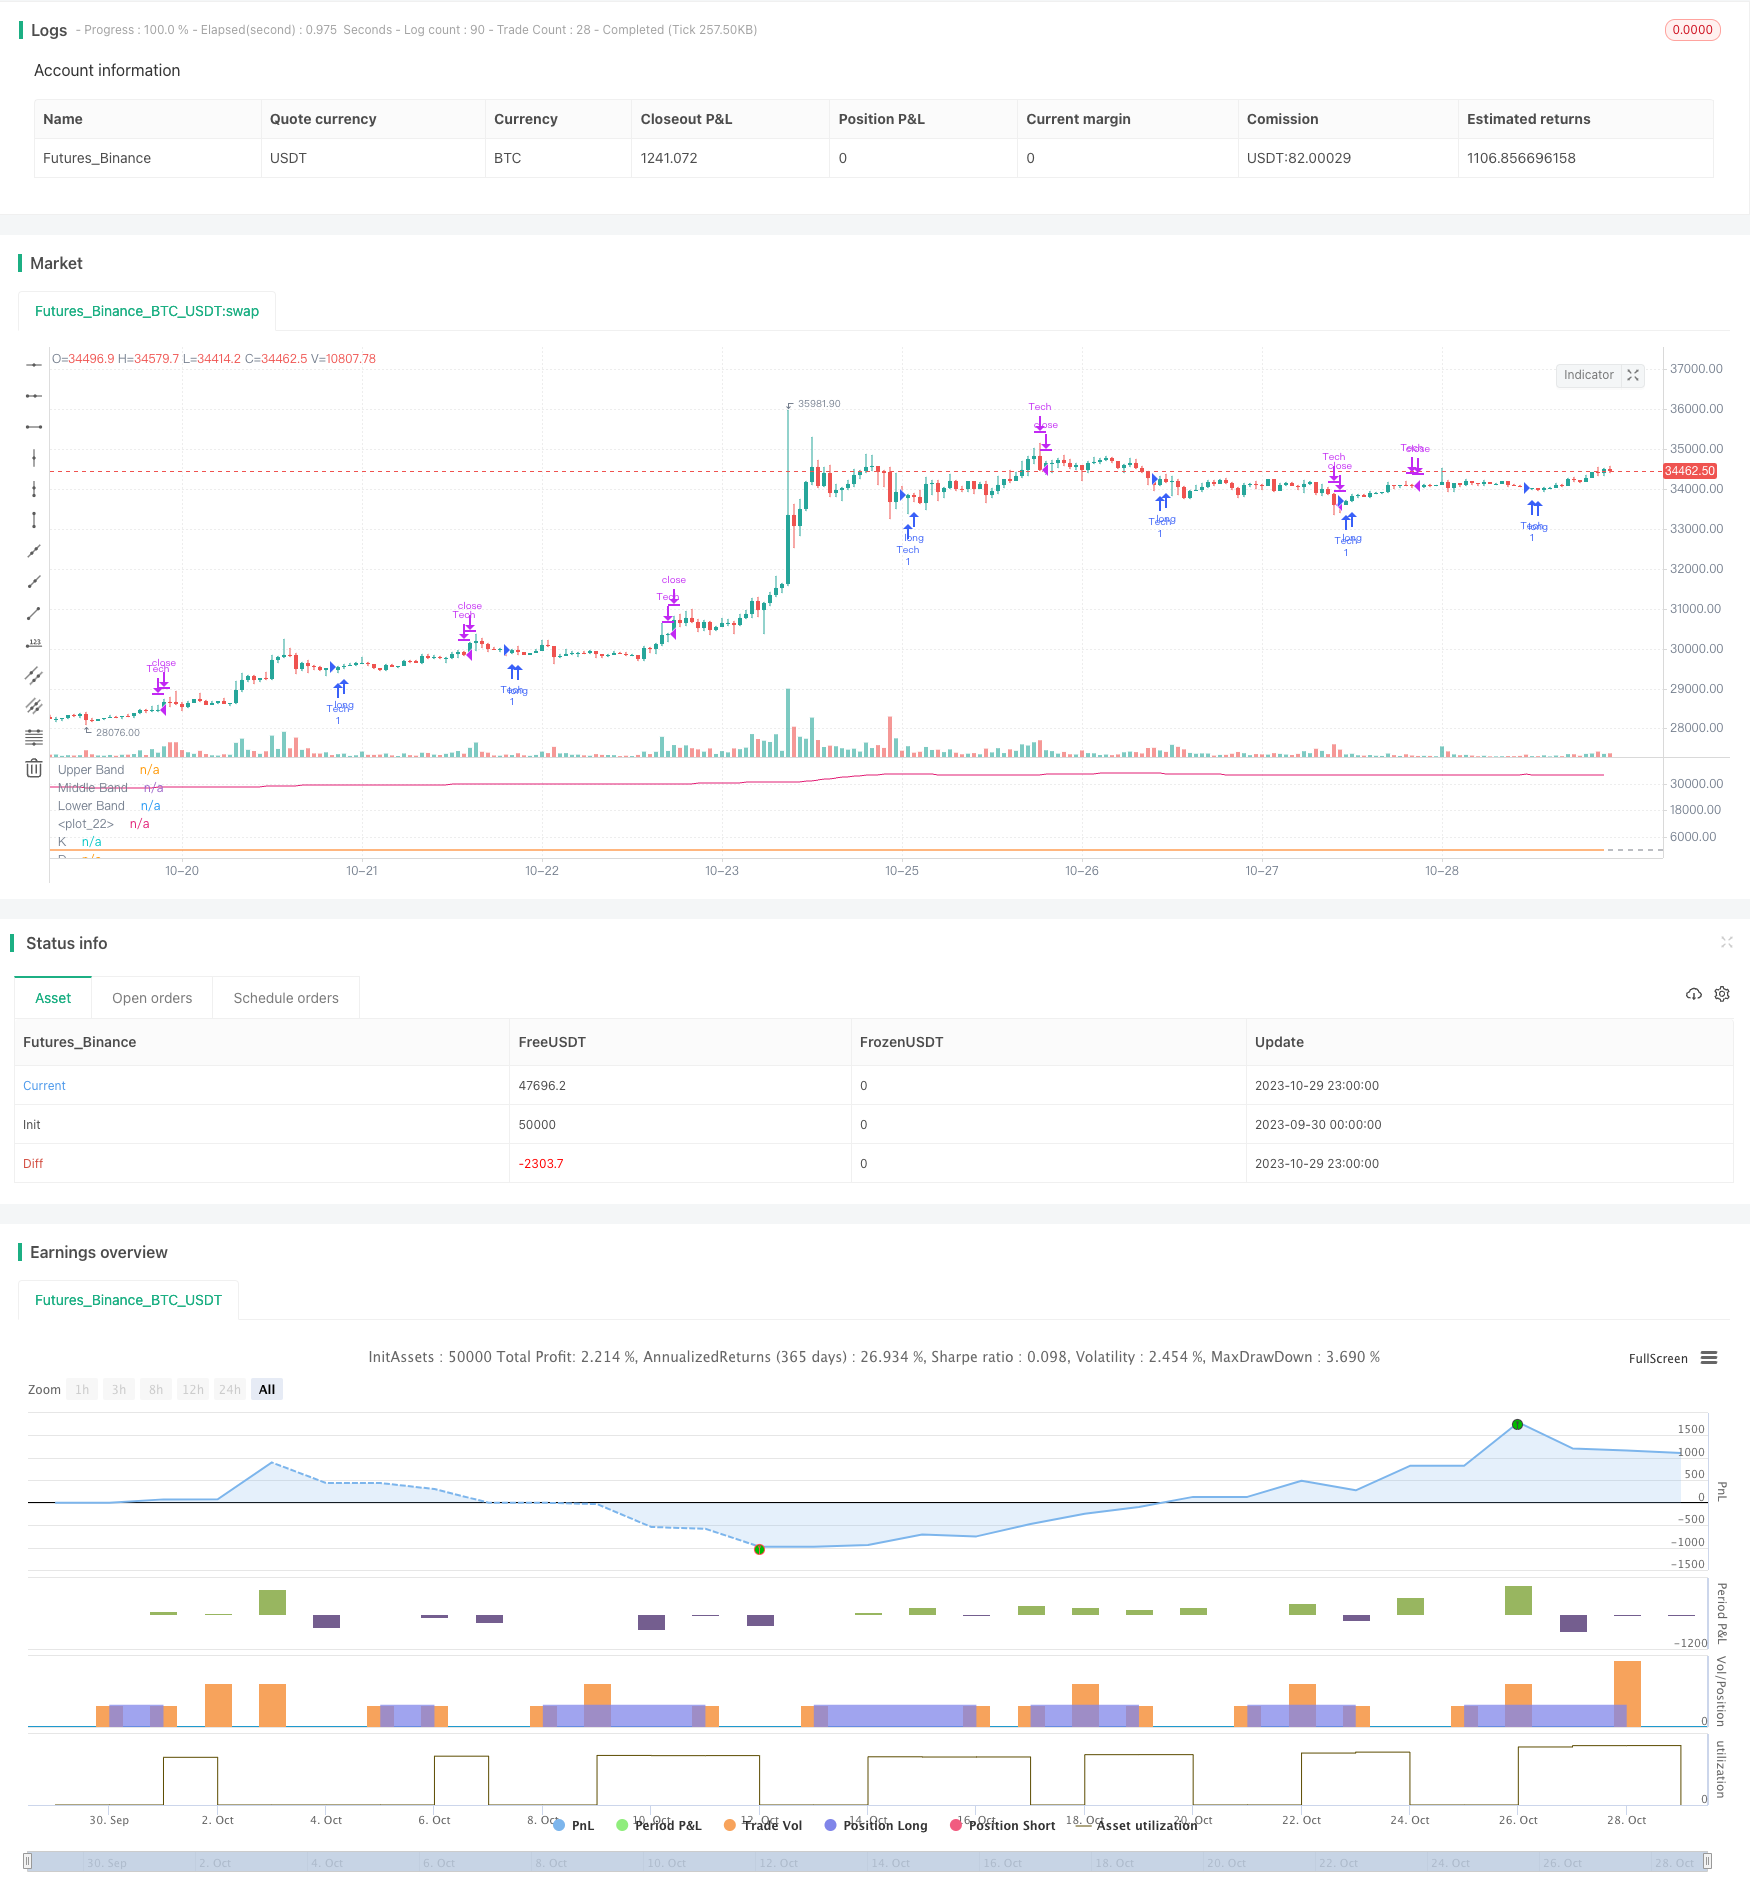 [trans]
概述
该策略旨在实现一种基于随机指数平滑移动平均线(RSI)和指数移动平均线(EMA)指标的自主式买入并持有币种的Scalper交易策略。它适用于5分钟K线,针对BTC进行了优化。策略的目标是在横盘或不大幅下跌时尽可能多持有币种。
策略原理
该策略使用RSI指标判断是否处于超买超卖区域,并结合随机RSI指标的K值和D值关系来发出买入和卖出信号。
当随机RSI的K线低于20时视为超卖,并在K线大于D线时产生买入信号。之后,会根据三个条件判断是否卖出:1)价格上涨超过1%后出现EMA翻转;2)随机RSI指标K线低于D线时;3)止损价格达到入场价的98.5%时。
此外,当短期EMA在上涨后发生向下翻转也会判断为卖出信号。
策略优势
- 使用随机RSI指标判断买入时点更可靠,可以有效过滤假突破。
- 结合EMA指标可以更好地判断趋势改变的时机。
- 采用止损可以有效控制亏损。
- 尽可能多持有币种可以减少交易频率,降低手续费。
策略风险
- RSI指标发出假信号的可能性。可以适当调整RSI参数来优化。
- 止损价格设定过小可能导致亏损扩大。可以适当调整止损幅度。
- EMA指标参数设置不当可能错过趋势改变时机。可以测试不同EMA周期的参数。
优化方向
- 测试不同的RSI和随机RSI参数设置来寻找最优参数组合
- 尝试不同的止损幅度来平衡防止亏损和利润回撤
- 测试EMA的长短周期组合,判断最佳判定趋势改变的参数
- 可以考虑加入其他指标来提高买入卖出时机判断的准确性
总结
该策略整合了随机RSI和EMA等多个指标的优势,采用较为稳健的方法判断买入和卖出时机。通过参数优化及风险管理可以进一步提高策略收益率和稳定性。总体来说,该策略逻辑合理,值得在实盘中进行验证和优化。
||
Overview
This strategy aims to implement an auto buy-in and hold coin scalper trading strategy based on the Stochastic RSI and EMA technical indicators. It is designed for 5-minute candlesticks, optimized for BTC. The goal is to hold coin as much as possible during sideways or non-significant downtrends.
Strategy Logic
The strategy uses RSI indicator to determine overbought and oversold levels, combined with the relationship between K and D values of Stochastic RSI to generate buy and sell signals.
It will trigger a buy signal when Stochastic RSI K line is below 20, considered oversold, and K is above D. After that, it will determine whether to sell based on three conditions: 1) price rises over 1% followed by EMA reversal; 2) Stochastic RSI K line below D; 3) stop loss price reaches 98.5% of entry price.
In addition, a downward turn of short term EMA after an uptrend will also be considered a sell signal.
Advantages
- Using Stochastic RSI for entry timing is more reliable, filtering false breakouts effectively.
- Incorporating EMA can better detect trend change timing.
- Applying stop loss helps control losses effectively.
- Holding coin as much as possible reduces trading frequency and fees.
Risks
- Potential false signals from RSI indicator. Fine tuning RSI parameters may help optimize.
- Stop loss set too tight may lead to expanded losses. Adjusting stop loss percentage appropriately.
- Improper EMA parameter setting may miss trend change timing. Testing different EMA periods.
Optimization Directions
- Test different combinations of RSI and Stochastic RSI parameters for optimal setting.
- Try different stop loss percentages to balance loss prevention and pullbacks.
- Test long and short EMA combinations to determine best parameters for catching trend changes.
- Consider adding other indicators to improve entry and exit timing accuracy.
Summary
This strategy integrates the strengths of Stochastic RSI, EMA and other indicators, using relatively robust methods to determine entry and exit timing. Further improvements on profitability and stability can be achieved through parameter optimization and risk management. Overall the strategy logic is sound and worth verifying and optimizing in live trading.
[/trans]
Strategy Arguments
| Argument | Default | Description |
|---|---|---|
| v_input_int_1 | 3 | K |
| v_input_int_2 | 3 | D |
| v_input_int_3 | 14 | RSI Length |
| v_input_int_4 | 14 | Stochastic Length |
| v_input_1_close | 0 | RSI Source: close |
Source (PineScript)
/*backtest
start: 2023-09-30 00:00:00
end: 2023-10-30 00:00:00
period: 1h
basePeriod: 15m
exchanges: [{"eid":"Futures_Binance","currency":"BTC_USDT"}]
*/

//@version=5
strategy(title="Stochastic RSI W Auto Buy Scalper Scirpt III ", shorttitle="Stoch RSI_III", format=format.price, precision=2)
smoothK = input.int(3, "K", minval=1)
smoothD = input.int(3, "D", minval=1)
lengthRSI = input.int(14, "RSI Length", minval=1)
lengthStoch = input.int(14, "Stochastic Length", minval=1)
src = input(close, title="RSI Source")
rsi1 = ta.rsi(src, lengthRSI)
k = ta.sma(ta.stoch(rsi1, rsi1, rsi1, lengthStoch), smoothK)
d = ta.sma(k, smoothD)
plot(k, "K", color=#2962FF)
plot(d, "D", color=#FF6D00)
h0 = hline(80, "Upper Band", color=#787B86)
hline(50, "Middle Band", color=color.new(#787B86, 50))
h1 = hline(20, "Lower Band", color=#787B86)

longStopLoss  = strategy.opentrades.entry_price(0)* (.985)

stochDropping = ta.falling(k,2)
shortSma = ta.sma(hlc3,12)
shorterSma = ta.sma(hlc3,3)
plot(shortSma[3])

shortSmaFlip = (ta.change(shortSma,3)>0) and ta.falling(hlc3,1)
shorterSmaFlip = (ta.change(shorterSma,2)>0) and ta.falling(hlc3,1)
messageSellText ='"type": "sell", "symbol": "BTCUSD", "marketPosition": "{{strategy.market_position}}"'

messageBuyText ='"type": "buy", "symbol": "BTCUSD", "marketPosition": {{strategy.market_position}}"'

fill(h0, h1, color=color.rgb(33, 150, 243, 90), title="Background")

strategy.entry("Tech", strategy.long, when=(strategy.position_size <= 0 and k<17 and k>d),alert_message=messageBuyText)
//original: strategy.close("TL", when=(strategy.position_size >= 0 and (k>90 and k<d)))

takeProfit = hlc3 > strategy.opentrades.entry_price(0)*1.01
//longStopLoss  = strategy.opentrades.entry_price(0)* (.995)

strategy.close("Tech", when=(strategy.position_size >= 0 and (k>90 and k<d and stochDropping)) or close<longStopLoss, comment="rsi or Stop sell",alert_message=messageSellText)
//strategy.close("Tech", when=(strategy.position_size >= 0 and close<longStopLoss), comment="stopLoss sell",alert_message=messageSellText)

strategy.close("Tech", when=(shortSmaFlip and k>20 and takeProfit),comment="Sma after profit",alert_message=messageSellText)
Detail
https://www.fmz.com/strategy/430648
Last Modified
2023-10-31 11:34:47