
10 KiB
Name
基于逆转与相对强度的组合量化策略Quantitative-Strategy-Based-on-Reversal-and-Comparative-Relative-Strength
Author
ChaoZhang
Strategy Description
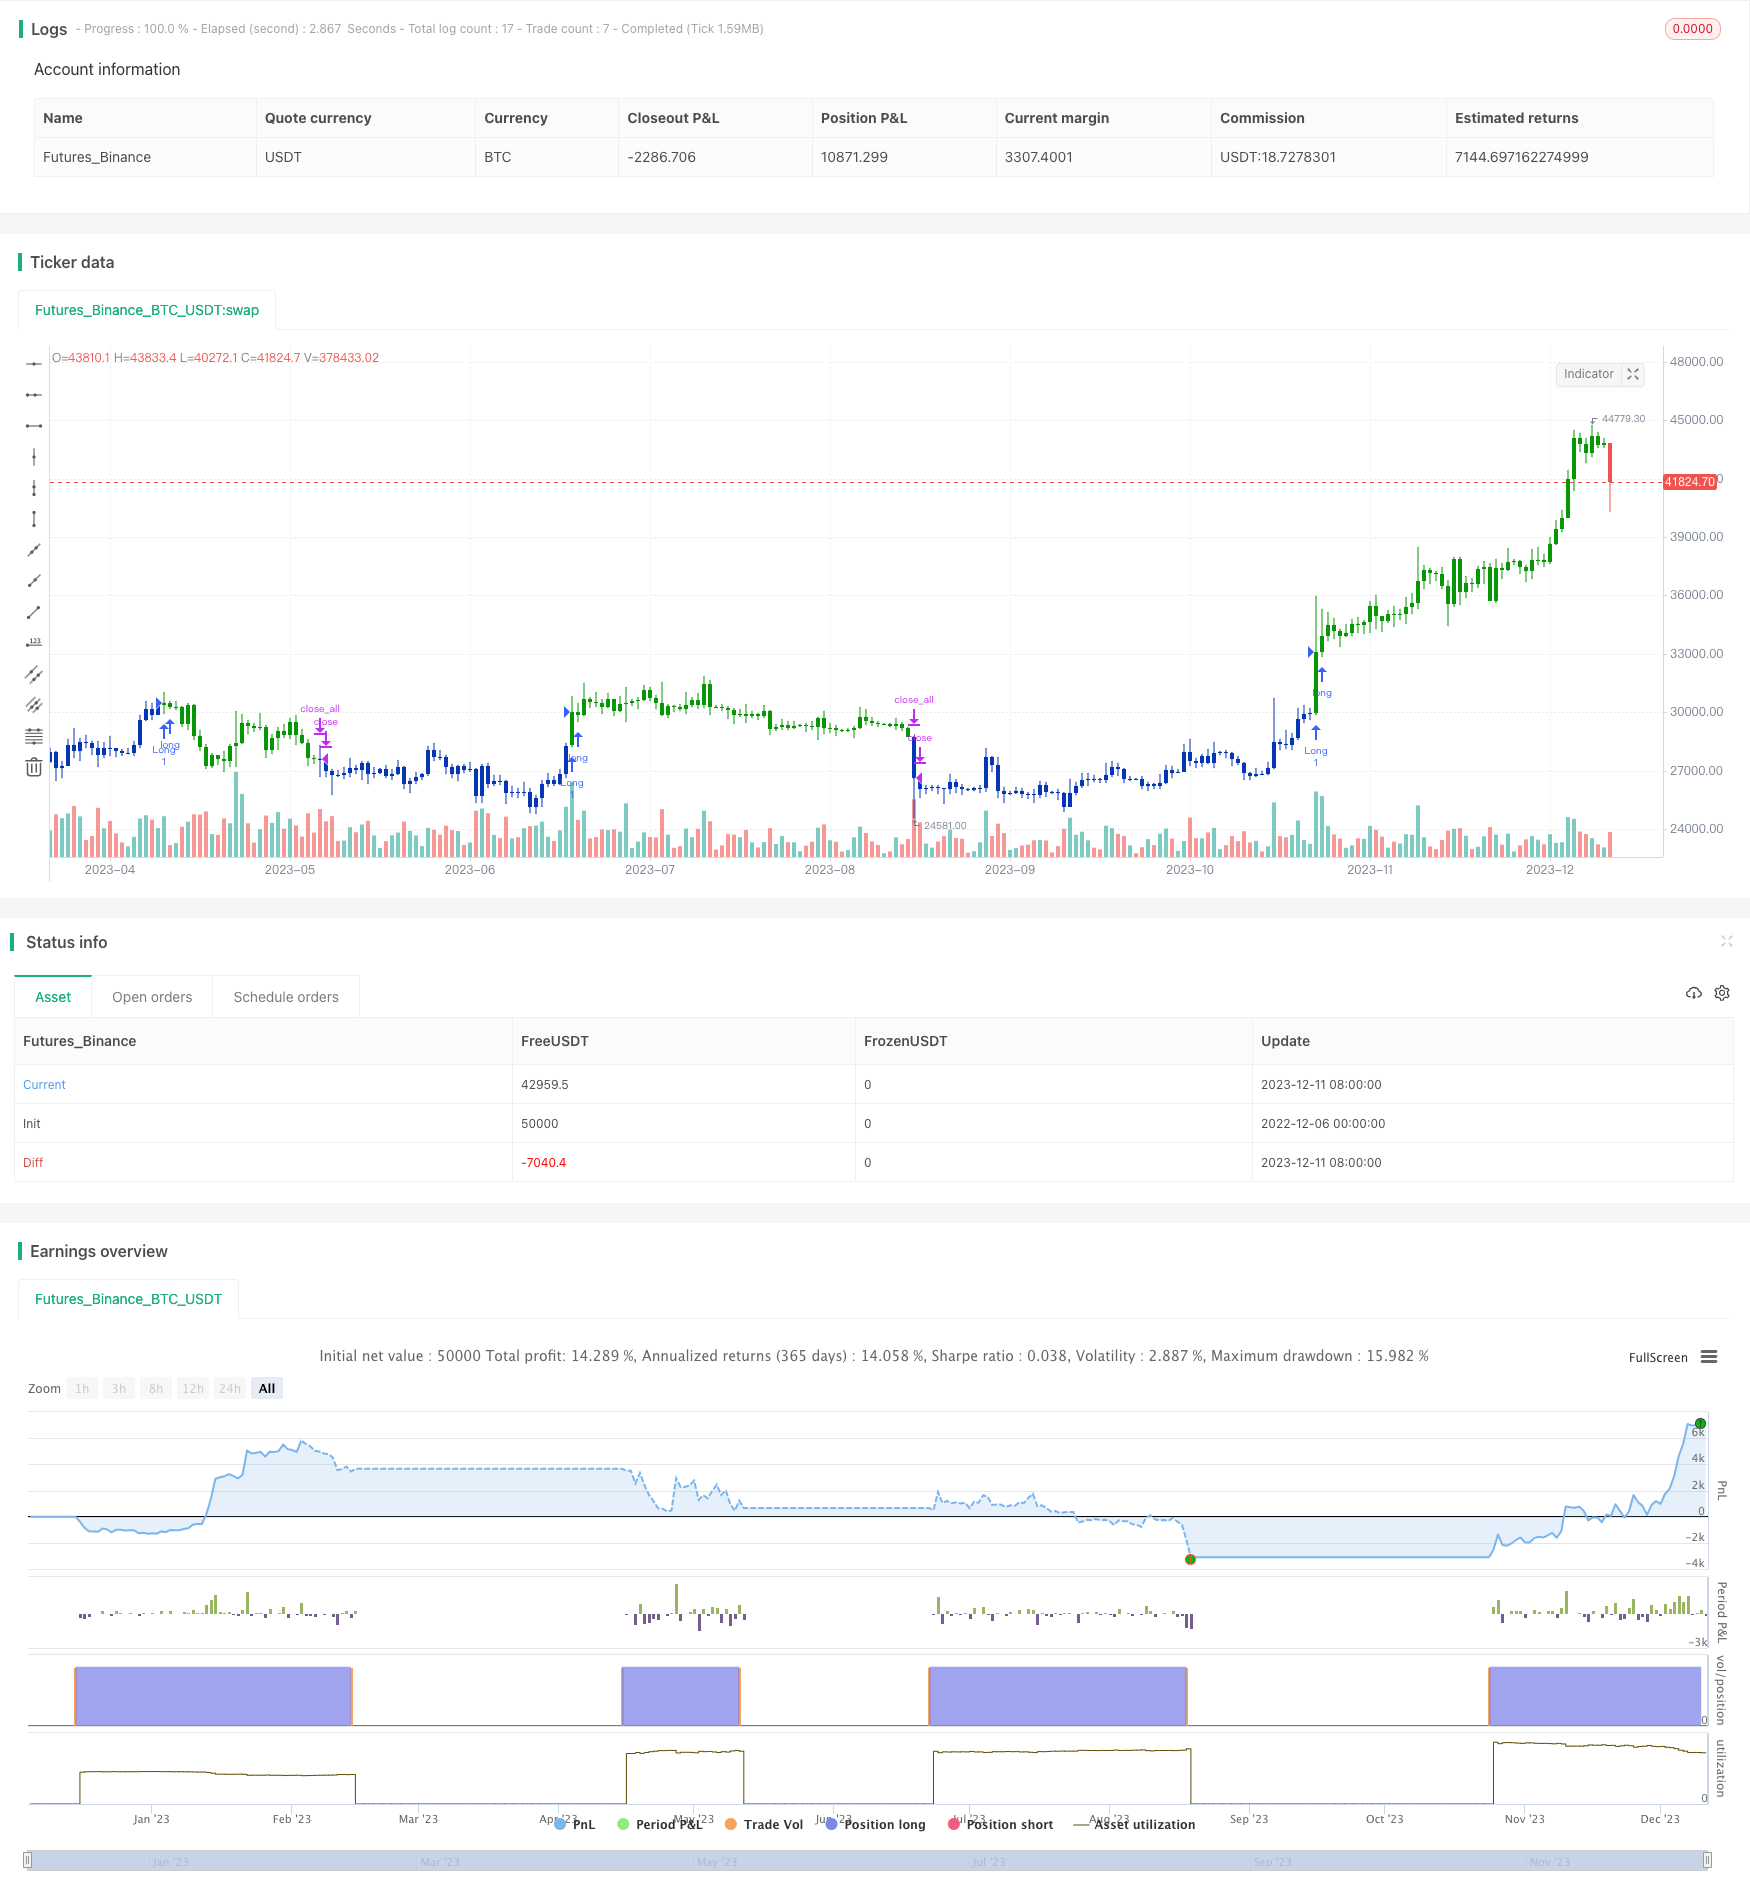 [trans]
概述
该策略首先结合了Ulf Jensen在他的著作《我如何在期货市场上将资金翻三番》第183页中提出的反转策略与比较相对强度指标,进行组合以获取更强的信号。该组合策略名为“基于逆转与相对强度的组合量化策略”。
该策略的主要思路是同时利用多个因子进行判断,结合反转因子和比较相对强度这两个信号,在两者同时发出信号时才进行买入或卖出,以提高策略的稳定性。
策略原理
第一部分为逆转策略。该策略在以下条件下做多:最近两天的收盘价连续上涨,且9日Stochastic慢线位于50以下。平仓条件为:最近两天的收盘价连续下跌,且9日Stochastic快线位于50以上。
第二部分为比较相对强度指标。该指标计算目标股票与标的指数的N日收盘价变化率的移动平均,并与事先设置的买入带、卖出带和平仓带进行比较。当指标上穿买入带时做多,下穿卖出带时做空,在做多情况下下穿平仓带时平仓,在做空情况下上穿平仓带时平仓。
该组合策略会同时判断两部分的信号,只有当两者都发出相同的信号(双买入或双卖出)时,才会进行相应的买入或卖出操作。
优势分析
该策略结合反转因子和相对强度因子,能够发挥两者的优势。反转策略能捕捉短期上的极端点;相对强度策略能把握大市的主要趋势。两者同时发出信号,可以提高信号的可靠性,过滤掉一部分噪声导致的错误信号。
另外,Stochastic 指标作为一个超买超卖区分指标,能较好地判断反转点。组合使用移动平均线之类的趋势指标,也可以形成比较成熟的组合策略。
风险分析
反转策略最大的风险在于无法判断市场反转的时间点,可能发生亏损后继续反向运动的情况。这时相对强度指标可以发挥作用,判断大趋势是否发生转变。
相对强度策略的风险在于指标参数设置不当,导致产生太多错误信号。这时反转策略可以起到过滤作用,减少不必要的交易。
优化方向
该策略可以从以下几个方面进行优化:
-
测试更多的反转因子,寻找更优反转策略。目前使用的只是简单的N日新高/新低统计策略。
-
对相对强度指标的参数进行测试与优化,找到最佳参数组合。当前参数设置较为主观,可能并非最优。
-
增加止损策略。该策略目前没有设置止损,增加合理的止损可以控制亏损风险。
-
可以测试不同的标的指数,再与目标股票计算相对强度,寻找最匹配的指数。
总结
该策略结合反转因子与相对强度因子进行交易,能利用两者的优势提高信号质量,是一种比较成熟的组合策略。该策略优化空间还很大,通过参数优化、止损策略以及策略组合方式的调整,还可以获得更好的效果。
||
Overview
This strategy first combines the reversal strategy proposed by Ulf Jensen on page 183 of his book "How I Tripled My Money in the Futures Market" with the comparative relative strength indicator to obtain stronger signals. The combined strategy is called "Quantitative Strategy Based on Reversal and Comparative Relative Strength".
The main idea of this strategy is to judge by multiple factors at the same time. By combining the reversal factor and the comparative relative strength signal, it will only place buy or sell orders when both give the same signal, in order to improve the stability of the strategy.
Strategy Principle
The first part is a reversal strategy. The strategy goes long when: the closing price has risen continuously for the last two days, and the 9-day Stochastic slow line is below 50. The closing condition is: the closing price has fallen continuously for the last two days, and the 9-day Stochastic fast line is above 50.
The second part is the comparative relative strength indicator. This indicator calculates the moving average of the N-day closing price change rate between the target stock and the benchmark index, and compares it with the preset buy zone, sell zone and close zone. It goes long when the indicator crosses above the buy zone, goes short when it falls below the sell zone, and closes positions when long and the indicator falls below the close zone, and when short and the indicator rises above the close zone.
This combined strategy judges the signals of both parts at the same time. It will only place buy or sell orders when both give the same signal (both buy or both sell).
Advantage Analysis
This strategy combines the advantages of reversal factors and relative strength factors. The reversal strategy can capture extremes in the short term; the relative strength strategy can grasp the main trend of the broader market. Signals from both strategies can improve reliability and filter out some false signals caused by noise.
In addition, the Stochastic indicator, as an indicator for distinguishing overbought and oversold zones, can better determine reversal points. Using it in combination with trend indicators like moving averages can form a more mature combined strategy.
Risk Analysis
The biggest risk of reversal strategies is that they cannot determine the timing of market reversals, which may lead to continued losses after the market reversal. In this case, the relative strength indicator can come into play to judge whether the major trend has changed.
The risk of the relative strength strategy lies in inappropriate parameter settings, which may generate too many false signals. In this case, the reversal strategy can play a role in filtering to reduce unnecessary trades.
Optimization Directions
This strategy can be optimized in the following aspects:
-
Test more reversal factors to find better reversal strategies. The current one uses just a simple N-day new high/low statistics strategy.
-
Test and optimize parameters for the relative strength indicator to find the optimal parameter combination, since current settings are subjective and likely not optimized.
-
Add stop loss strategies. Currently there is no stop loss, adding reasonable stop loss can control downside risk.
-
Test different benchmark indices to calculate relative strength to the target stock and find the best matching index.
Conclusion
This strategy combines reversal factors and relative strength factors for trading. It utilizes the advantages of both to improve signal quality and is a relatively mature combined strategy. There is still much room for optimization by parameters tuning, adding stop loss strategies, and adjusting the strategy combination methods to achieve even better results.
[/trans]
Strategy Arguments
| Argument | Default | Description |
|---|---|---|
| v_input_1 | 14 | Length |
| v_input_2 | true | KSmoothing |
| v_input_3 | 3 | DLength |
| v_input_4 | 50 | Level |
| v_input_5 | BTC_USDT:swap | b |
| v_input_6 | 10 | LengthCRS |
| v_input_7 | 0.9988 | BuyBand |
| v_input_8 | 0.996 | SellBand |
| v_input_9 | 0.9975 | CloseBand |
| v_input_10 | false | Trade reverse |
Source (PineScript)
/*backtest
start: 2022-12-06 00:00:00
end: 2023-12-12 00:00:00
period: 1d
basePeriod: 1h
exchanges: [{"eid":"Futures_Binance","currency":"BTC_USDT"}]
*/

//@version=4
////////////////////////////////////////////////////////////
//  Copyright by HPotter v1.0 30/10/2019
// This is combo strategies for get a cumulative signal.
//
// First strategy
// This System was created from the Book "How I Tripled My Money In The
// Futures Market" by Ulf Jensen, Page 183. This is reverse type of strategies.
// The strategy buys at market, if close price is higher than the previous close
// during 2 days and the meaning of 9-days Stochastic Slow Oscillator is lower than 50.
// The strategy sells at market, if close price is lower than the previous close price
// during 2 days and the meaning of 9-days Stochastic Fast Oscillator is higher than 50.
//
// Second strategy
// Comparative Relative Strength Strategy for ES
//
// WARNING:
// - For purpose educate only
// - This script to change bars colors.
////////////////////////////////////////////////////////////
Reversal123(Length, KSmoothing, DLength, Level) =>
    vFast = sma(stoch(close, high, low, Length), KSmoothing)
    vSlow = sma(vFast, DLength)
    pos = 0.0
    pos := iff(close[2] < close[1] and close > close[1] and vFast < vSlow and vFast > Level, 1,
	         iff(close[2] > close[1] and close < close[1] and vFast > vSlow and vFast < Level, -1, nz(pos[1], 0)))
	pos

CRS(a, b, len, BuyBand, SellBand, CloseBand) =>
    pos = 0.0
    as = security(a, timeframe.period, close)
    bs = security(b, timeframe.period, close)
    nRes = sma(as/bs, len)
    pos := iff(nRes > BuyBand, 1,
	         iff(nRes < SellBand, -1,
	          iff(pos[1] == 1 and nRes < CloseBand, 0,
    	       iff(pos[1] == -1 and nRes > CloseBand, 0, nz(pos[1], 0)))))
    pos

strategy(title="Combo Backtest 123 Reversal & Comparative Relative Strength", shorttitle="Combo", overlay = true)
Length = input(14, minval=1)
KSmoothing = input(1, minval=1)
DLength = input(3, minval=1)
Level = input(50, minval=1)
//-------------------------
a = syminfo.tickerid
b = input("BTC_USDT:swap", type=input.symbol)
LengthCRS = input(10)
BuyBand = input(0.9988, step = 0.0001)
SellBand = input(0.9960, step = 0.0001)
CloseBand = input(0.9975, step = 0.0001)
reverse = input(false, title="Trade reverse")
posReversal123 = Reversal123(Length, KSmoothing, DLength, Level)
posCRS = CRS(a, b, LengthCRS, BuyBand, SellBand, CloseBand)
pos = iff(posReversal123 == 1 and posCRS == 1 , 1,
	   iff(posReversal123 == -1 and posCRS == -1, -1, 0))
possig = iff(reverse and pos == 1, -1,
          iff(reverse and pos == -1 , 1, pos))
if (possig == 1)
    strategy.entry("Long", strategy.long)
if (possig == -1)
    strategy.entry("Short", strategy.short)
if (possig == 0)
    strategy.close_all()
barcolor(possig == -1 ? #b50404: possig == 1 ? #079605 : #0536b3 )
Detail
https://www.fmz.com/strategy/435275
Last Modified
2023-12-13 17:17:10