
11 KiB
Name
基于趋势平均线的多重反转策略Trend-Reversal-Strategy-Based-on-Multiple-Moving-Averages
Author
ChaoZhang
Strategy Description
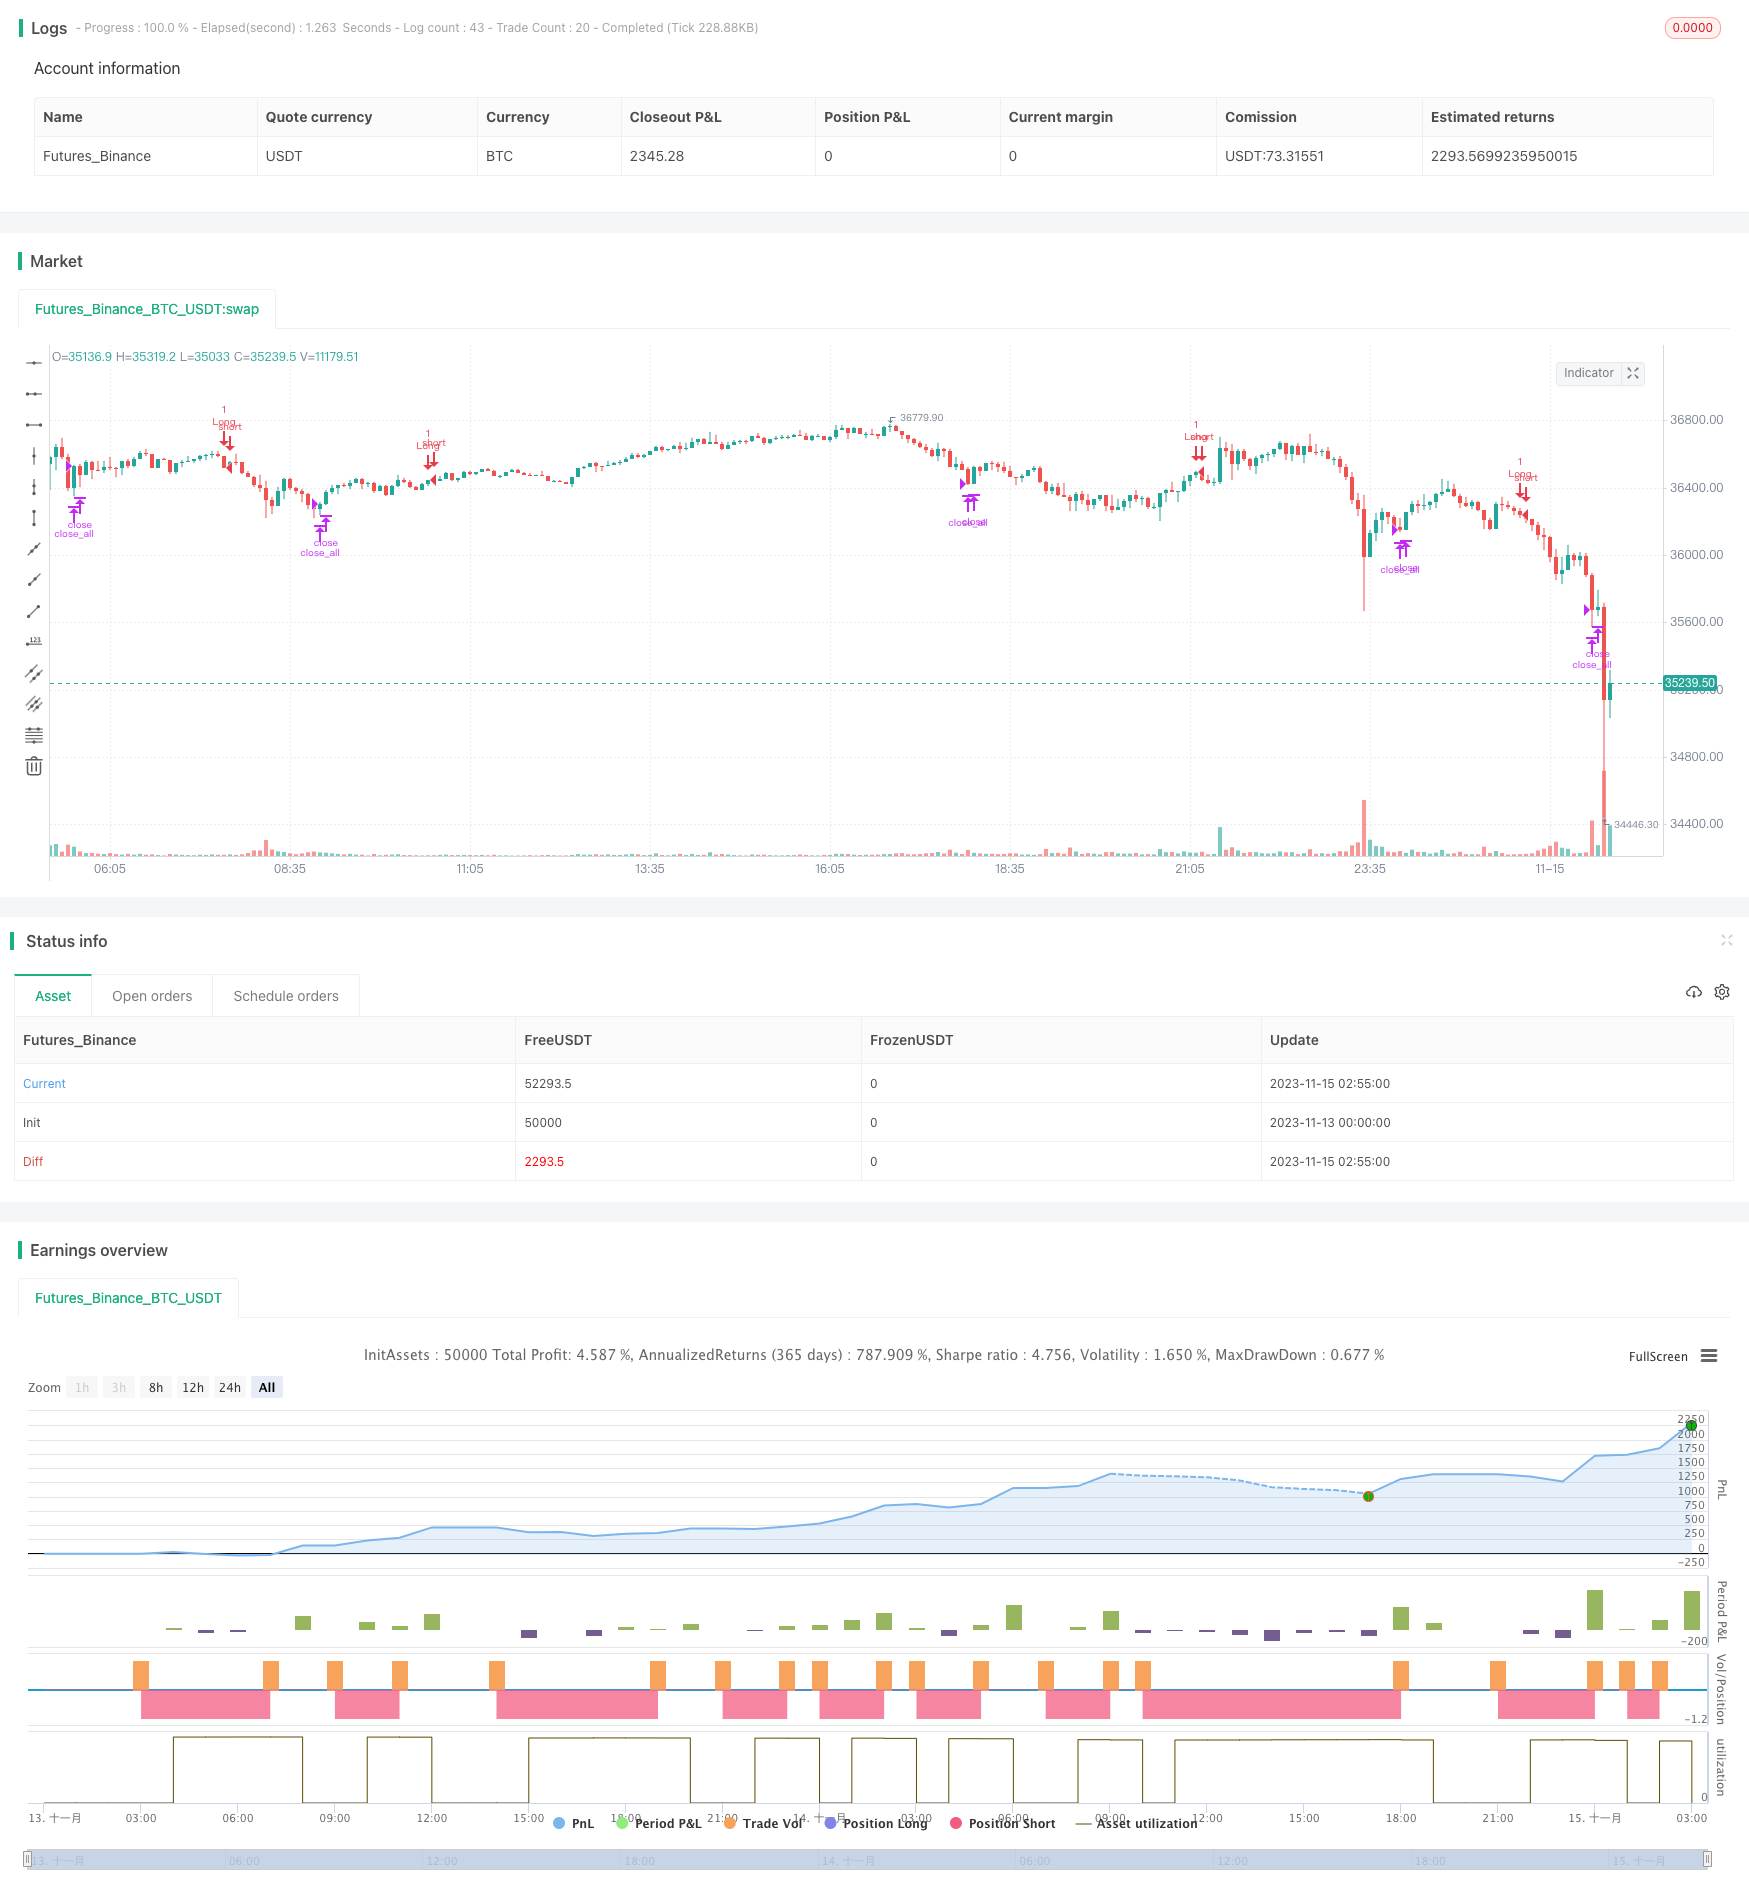 [trans]
概述
该策略通过计算多种趋势指标,在它们发生反转时进行买入和卖出操作。主要的趋势指标有TDI、TCF、TTF和TII。策略会在配置中选择使用哪一个指标来产生交易信号。
策略原理
-
TDI指标
TDI指标基于价格的变化 momentum 来计算。通过 summing 和 smoothing 技术构建。当 TDI 方向指标上穿 TDI 曲线时做多,下穿时清仓。
-
TCF指标
TCF指标计算价格的正变化和负变化,来判断多头和空头的力量。当正变化力量大于负变化力量时做多,否则清仓。
-
TTF指标
TTF指标通过比较高点和低点的力量来判断趋势。做多的信号是 TTF 指标上穿 100, 反之则清仓。
-
TII指标
TII指标结合了均线和价格区间来判断趋势反转。它同时考虑短期和长期趋势。做多信号是 TII 指标上穿 80,清仓是下穿 80。
进入做多和平仓的 logic 根据配置的指标来选择合适的交易信号。
策略优势
该策略融合了多种常用的趋势交易指标,可以灵活适应市场环境。具体优势有:
- 利用趋势反转信号,可以及时捕捉趋势转变机会
- 配置不同指标,可以针对性优化
- 丰富的指标组合,可以组合使用来确认信号
策略风险
该策略主要面临以下风险:
- 趋势指标产生的交易信号可能出现误报导致亏损
- 单一指标无法完全判断趋势,容易受到市场噪音的影响
- 配置错误的指标参数和交易参数可能导致曲解市场,产生错误交易
可以采取以下方法降低风险:
- 优化指标参数,找到最佳参数组合
- 组合多个指标信号进行交易,提高信号质量
- 调整仓位管理策略,控制单笔损失
策略优化方向
该策略可以从以下几个方面进行优化:
- 测试不同市场周期的最优指标和参数组合
- 增加或删减指标,找到最优指标组合
- 对交易信号进行过滤,去除误报信号
- 优化仓位管理策略,比如可变仓位,跟踪止损等
- 增加机器学习评分指标,辅助判断信号质量
总结
该策略结合多种趋势反转指标的优势,通过配置指标和参数进行优化,可以适应不同市场环境,在趋势反转点进行操作。关键是找到最优参数和指标组合,同时控制风险。通过持续优化和验证,可以构建稳定具有 alpha 的策略。
||
Overview
This strategy generates buy and sell signals based on reversals of multiple trend indicators including TDI, TCF, TTF and TII. The strategy allows selecting which indicator signal to use for entries and exits.
Strategy Logic
-
TDI Indicator
The TDI indicator is constructed using price momentum with summing and smoothing techniques. It goes long when TDI direction crosses above TDI line and exits when crossing below.
-
TCF Indicator
TCF indicator measures positive and negative price changes to gauge bullish and bearish forces. It goes long when positive change is greater than negative change, otherwise it exits.
-
TTF Indicator
TTF indicator compares the power of highest and lowest prices to determine trend. The long signal is when TTF crosses above 100 and exit is when crossing below -100.
-
TII Indicator
The TII combines moving average and price bands to identify trend reversals. It considers both short and long term trends. The long signal is above 80 and exit is below 80.
The entry long and close logic selects appropriate signals based on configured indicator.
Advantages
The strategy incorporates several commonly used trend trading indicators, which allows flexibility to adapt to changing market conditions. Specific advantages:
- Captures trend reversal opportunities in a timely manner using reversal signals
- Optimizable through configuring different indicators
- Rich indicator combinations can be used to confirm signals
Risks
The main risks this strategy faces:
- Indicator signals may have false signals resulting in losses
- Individual indicators cannot fully judge trends and are susceptible to market noise
- Incorrect configurations of indicators and trading parameters can misinterpret the market and generate erroneous trades
Risks can be reduced by:
- Optimizing indicator parameters to find best combinations
- Requiring multiple indicator signal confirmations to improve quality
- Adjusting position sizing to control single trade loss
Enhancement Opportunities
The strategy can be enhanced in several areas:
- Test optimal indicators and parameters across different market cycles
- Add or reduce indicators to find best combinations
- Filter out false signals
- Optimize position sizing strategies e.g. variable size, trailing stop loss
- Incorporate machine learning scoring to assist with signal quality
Conclusion
By combining multiple trend reversal indicators and optimizing configurations, this strategy is adaptable to varying market environments foroperating at trend turning points. The key is finding the optimum parameters and indicators while controlling risk. Continued optimizations and validations can build a steady alpha strategy.
[/trans]
Strategy Arguments
| Argument | Default | Description |
|---|---|---|
| v_input_1 | 0 | Use Indicator: TDI |
| v_input_2 | 20 | Length |
| v_input_3 | 35 | Length |
| v_input_4 | 15 | Lookback Length |
| v_input_5 | 60 | Major Length |
| v_input_6 | 30 | Minor Length |
| v_input_7 | 80 | Upper Level |
| v_input_8 | 20 | Lower Level |
| v_input_9 | 2016 | Back Testing Start Year |
| v_input_10 | true | Back Testing Start Month |
| v_input_11 | true | Back Testing Start Day |
| v_input_12 | 2028 | Back Testing Stop Year |
| v_input_13 | 12 | Back Testing Stop Month |
| v_input_14 | 31 | Back Testing Stop Day |
| v_input_15 | 20 | Max Position % |
| v_input_16 | 5 | Max Loss Risk % |
| v_input_17 | 14 | ATR Length |
| v_input_18 | 1.5 | Stop Offset |
| v_input_19 | true | Limit Offset |
Source (PineScript)
/*backtest
start: 2023-11-13 00:00:00
end: 2023-11-15 03:00:00
period: 5m
basePeriod: 1m
exchanges: [{"eid":"Futures_Binance","currency":"BTC_USDT"}]
*/

//@version=4
//
// This source code is subject to the terms of the Mozilla Public License 2.0 at https://mozilla.org/MPL/2.0/
// © kruskakli
//
// Here is a collection of Trend Indicators as defined by M.H Pee and presented
// in various articles of the "STOCKS & COMMODITIES Magazine"
//
// The actual implementation of the indicators here are made by: everget
//
// I have gather them here so that they easily can be tested.
//
// My own test was made using 15 companies from the OMXS30 list
// during the time period of 2016-2018, and I only went LONG.
//
// The result was as follows:
//
//        Average    Std.Dev
//        profit
//  TDI    3.04%      5.97
//  TTF    1.22%.     5.73
//  TII    1.07%      6.2
//  TCF    0.32%      2.68
//
strategy("M.H Pee indicators", overlay=true)


use = input(defval="TDI", title="Use Indicator", type=input.string,
             options=["TDI","TCF","TTF","TII"])

src = close


//
// TDI
//
length = input(title="Length", type=input.integer, defval=20)
mom = change(close, length)
tdi = abs(sum(mom, length)) - sum(abs(mom), length * 2) + sum(abs(mom), length)
// Direction Indicator
tdiDirection = sum(mom, length)
tdiLong = crossover(tdiDirection, tdi)
tdiXLong = crossunder(tdiDirection, tdi)

//
// TCF
//
tcflength = input(title="Length", type=input.integer, defval=35)

plusChange(src) =>
    change_1 = change(src)
    change(src) > 0 ? change_1 : 0.0
minusChange(src) =>
    change_1 = change(src)
    change(src) > 0 ? 0.0 : -change_1

plusCF = 0.0
plusChange__1 = plusChange(src)
plusCF := plusChange(src) == 0 ? 0.0 : plusChange__1 + nz(plusCF[1])

minusCF = 0.0
minusChange__1 = minusChange(src)
minusCF := minusChange(src) == 0 ? 0.0 : minusChange__1 + nz(minusCF[1])

plusTCF = sum(plusChange(src) - minusCF, tcflength)
minusTCF = sum(minusChange(src) - plusCF, tcflength)

tcfLong = plusTCF > 0
tcfXLong = plusTCF < 0

//
// TTF
//
ttflength = input(title="Lookback Length", type=input.integer, defval=15)

hh = highest(length)
ll = lowest(length)

buyPower = hh - nz(ll[length])
sellPower = nz(hh[length]) - ll

ttf = 200 * (buyPower - sellPower) / (buyPower + sellPower)

ttfLong = crossover(ttf, 100)
ttfXLong = crossunder(ttf, -100)

//
// TII
//
majorLength = input(title="Major Length", type=input.integer, defval=60)
minorLength = input(title="Minor Length", type=input.integer, defval=30)
upperLevel = input(title="Upper Level", type=input.integer, defval=80)
lowerLevel = input(title="Lower Level", type=input.integer, defval=20)

sma = sma(src, majorLength)

positiveSum = 0.0
negativeSum = 0.0

for i = 0 to minorLength - 1 by 1
    price = nz(src[i])
    avg = nz(sma[i])
    positiveSum := positiveSum + (price > avg ? price - avg : 0)
    negativeSum := negativeSum + (price > avg ? 0 : avg - price)
    negativeSum

tii = 100 * positiveSum / (positiveSum + negativeSum)

tiiLong = crossover(tii, 80)
tiiXLong = crossunder(tii,80)

//
// LOGIC
//
enterLong = (use == "TDI" and tdiLong) or (use == "TCF" and tcfLong) or (use == "TTF" and ttfLong) or (use == "TII" and tiiLong)
exitLong = (use == "TDI" and tdiXLong) or (use == "TCF" and tcfXLong) or (use == "TTF" and ttfXLong) or (use == "TII" and tiiXLong)


// Time range for Back Testing
btStartYear  = input(title="Back Testing Start Year",  type=input.integer, defval=2016)
btStartMonth = input(title="Back Testing Start Month", type=input.integer, defval=1)
btStartDay   = input(title="Back Testing Start Day",   type=input.integer, defval=1)
startTime = timestamp(btStartYear, btStartMonth, btStartDay, 0, 0)

btStopYear  = input(title="Back Testing Stop Year",  type=input.integer, defval=2028)
btStopMonth = input(title="Back Testing Stop Month", type=input.integer, defval=12)
btStopDay   = input(title="Back Testing Stop Day",   type=input.integer, defval=31)
stopTime  = timestamp(btStopYear, btStopMonth, btStopDay, 0, 0)

window() => time >= startTime and time <= stopTime ? true : false


riskPerc     = input(title="Max Position  %", type=input.float, defval=20, step=0.5)
maxLossPerc  = input(title="Max Loss Risk %", type=input.float, defval=5, step=0.25)

// Average True Range (ATR) measures market volatility.
// We use it for calculating position sizes.
atrLen   = input(title="ATR Length", type=input.integer, defval=14)
stopOffset = input(title="Stop Offset", type=input.float, defval=1.5, step=0.25)
limitOffset = input(title="Limit Offset", type=input.float, defval=1.0, step=0.25)
atrValue = atr(atrLen)


// Calculate position size
maxPos = floor((strategy.equity * (riskPerc/100)) / src)
// The position sizing algorithm is based on two parts:
// a certain percentage of the strategy's equity and
// the ATR in currency value.
riskEquity  = (riskPerc / 100) * strategy.equity
// Translate the ATR into the instrument's currency value.
atrCurrency = (atrValue * syminfo.pointvalue)
posSize0    = min(floor(riskEquity / atrCurrency), maxPos)
posSize     = posSize0 < 1 ? 1 : posSize0

if (window())
    strategy.entry("Long", long=true, qty=posSize0, when=enterLong)
    strategy.close_all(when=exitLong)
Detail
https://www.fmz.com/strategy/432785
Last Modified
2023-11-21 14:53:48