
7.2 KiB
Name
基于质数震荡的交易策略Prime-Number-Oscillator-Trading-Strategy
Author
ChaoZhang
Strategy Description
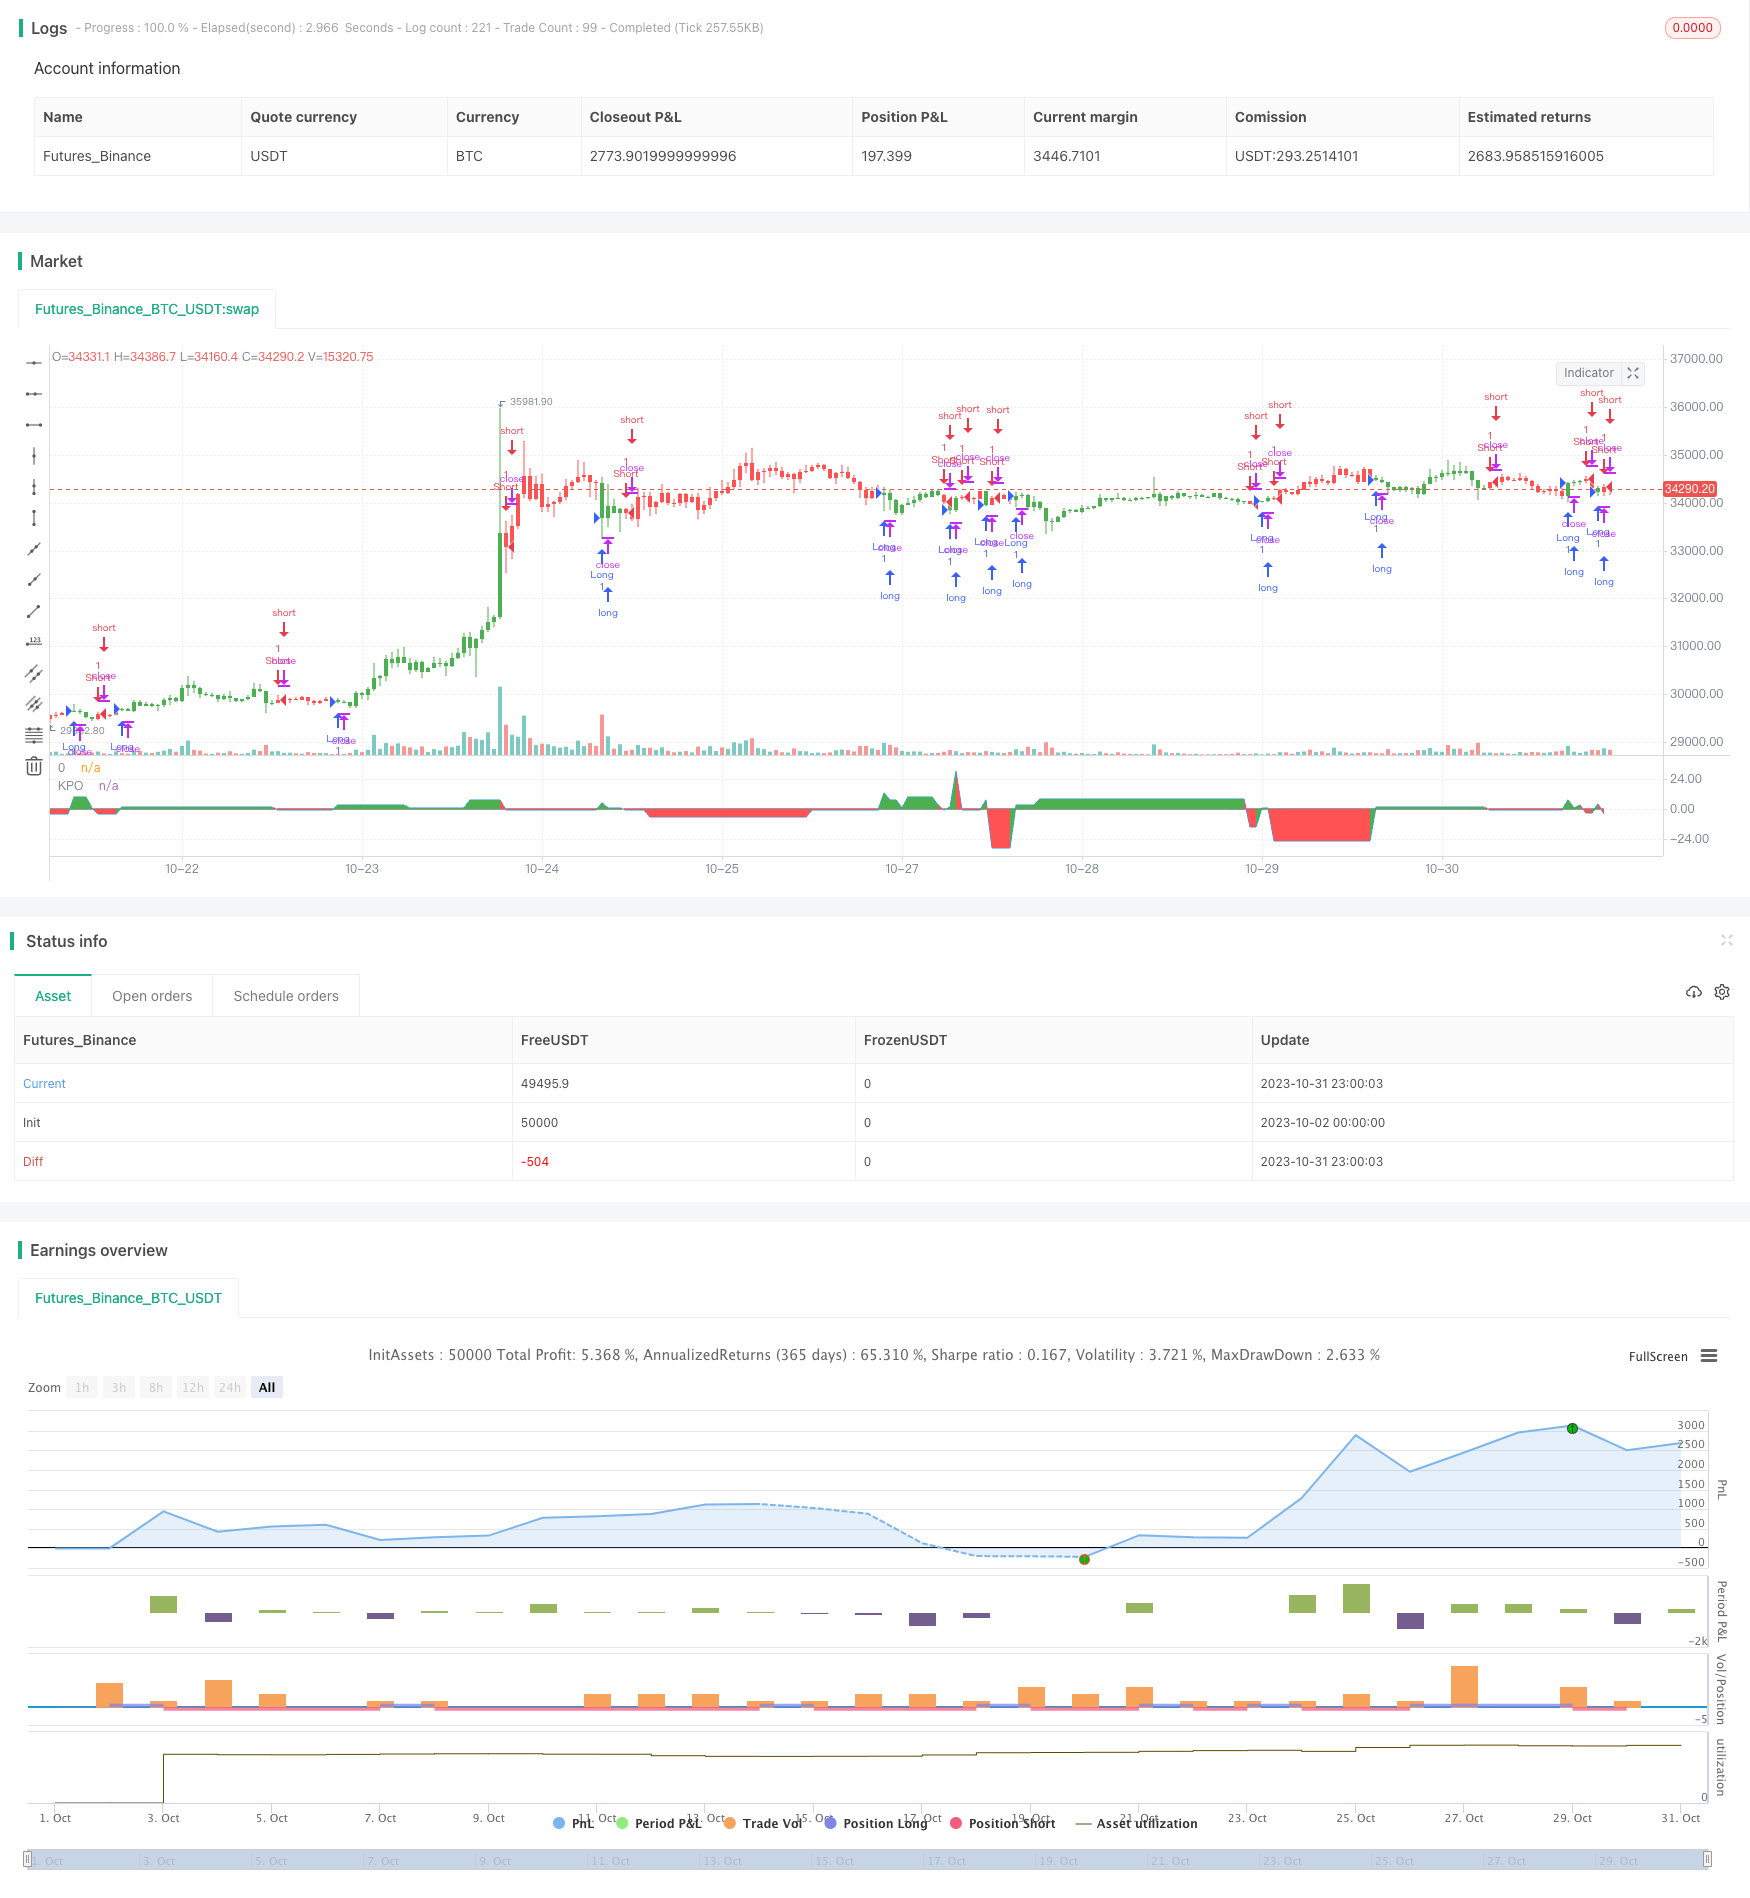 [trans]
概述
该策略基于质数震荡指标来判断市场趋势,并据此构建长短仓位。质数震荡指标计算价格附近的最近质数与价格的差值,正值表示多头趋势,负值表示空头趋势。该策略可以捕捉价格震荡时隐藏的趋势信息,对于突破交易有指导意义。
策略原理
该策略首先定义一个PrimeNumberOscillator函数,传入参数为价格和allowedPercent。该函数会在价格正负allowedPercent的范围内寻找最接近价格的质数,并返回两者的差值。差值大于0表示多头趋势,小于0表示空头趋势。
然后在策略中,调用PrimeNumberOscillator函数计算xPNO值。根据xPNO正负判断仓位方向,乘以reverseFactor来确定最终的交易方向。根据交易方向开仓做多做空。
该策略主要依赖质数震荡指标判断趋势方向。指标本身比较粗糙,需要结合其他因素来验证交易信号。但它基于数学原理,可以提供一定的客观指引。
优势分析
- 基于数学原理,相对客观
- 可以识别隐藏在震荡中的趋势
- 参数调整灵活,可以自由设定敏感度
- 实现简单,容易理解和优化
风险分析
- 质数震荡指标本身比较粗糙,存在多次错判的可能
- 需要结合其他技术指标验证,不能单独使用
- 需谨慎选择参数,过大或过小都会失效
- 交易频率可能过高,需要控制仓位规模
优化方向
- 可以结合移动平均,超买超卖等指标过滤信号
- 可以添加止损策略,降低单笔损失
- 可以根据市场情况动态调整allowedPercent参数
- 可以优化仓位管理,通过波动率等指标控制仓位大小
总结
该策略基于质数震荡原理判断趋势方向,实现简单,逻辑清晰。但质数震荡本身存在一定局限,需谨慎使用。可以通过組合其他技术指标来验证信号,控制交易风险。该策略为数学交易策略的典型代表,对于学习和研究具有一定参考价值。
||
Overview
This strategy uses the Prime Number Oscillator indicator to determine market trends and construct long/short positions accordingly. The PNO calculates the difference between the nearest prime number to price and the price itself, with positive values indicating bullish trends and negative values indicating bearish trends. The strategy can capture hidden trend information during price oscillations and provide guidance for breakout trading.
Strategy Logic
The strategy first defines a PrimeNumberOscillator function that takes price and allowedPercent as parameters. The function searches for the nearest prime number to price within the allowedPercent range and returns their difference. A positive difference indicates bullish and a negative difference indicates bearish.
In the strategy, the PrimeNumberOscillator function is called to compute the xPNO value. The position direction is determined by the sign of xPNO and multiplied by the reverseFactor to get the final trade direction. Long/short positions are opened based on the direction.
The strategy mainly relies on the PNO indicator for trend direction. The indicator itself is quite crude and needs to be combined with other factors for signal verification. But it is based on mathematical principles and can provide some objective guidance.
Advantage Analysis
- Based on mathematical principles, relatively objective
- Can identify trends hidden in oscillations
- Flexible parameter tuning for sensitivity adjustment
- Simple to implement, easy to understand and optimize
Risk Analysis
- PNO itself is crude, prone to multiple false signals
- Needs verification from other technical indicators, cannot be used alone
- Careful parameter selection needed, too large or small will fail
- High trading frequency, position sizing needs control
Optimization Directions
- Add filters like moving average, RSI for signal verification
- Implement stop loss to limit downside risk
- Dynamically adjust allowedPercent based on market conditions
- Optimize position sizing through volatility and other metrics
Conclusion
The strategy determines trend direction based on prime number oscillation principles, with simple logic and implementation. But PNO has limitations that require cautious use. Combining other technical indicators to verify signals and control risk is needed. As a typical representative of mathematical trading strategies, it has reference value for study and research.
[/trans]
Strategy Arguments
| Argument | Default | Description |
|---|---|---|
| v_input_1 | 5 | Tolerance Percentage |
| v_input_2 | false | Trade reverse |
Source (PineScript)
/*backtest
start: 2023-10-02 00:00:00
end: 2023-11-01 00:00:00
period: 1h
basePeriod: 15m
exchanges: [{"eid":"Futures_Binance","currency":"BTC_USDT"}]
*/

//@version=2
////////////////////////////////////////////////////////////
//  Copyright by HPotter v1.0 29/03/2018
// Determining market trends has become a science even though a high number or people
// still believe it’s a gambling game. Mathematicians, technicians, brokers and investors
// have worked together in developing quite several indicators to help them better understand
// and forecast market movements.
//
// Developed by Modulus Financial Engineering Inc., the prime number oscillator indicates the
// nearest prime number, be it at the top or the bottom of the series, and outlines the
// difference between that prime number and the respective series.
//
// You can change long to short in the Input Settings
// WARNING:
//  - For purpose educate only
//  - This script to change bars colors.
////////////////////////////////////////////////////////////
PrimeNumberOscillator(price, percent) =>
    res = 0
    res1 = 0
    res2 = 0
    for j = price to price + (price * percent / 100)
        res1 := j
	    for i = 2 to sqrt(price)
        	res1 := iff(j % i == 0 , 0, j)
            if res1 == 0
                break
		if res1 > 0
		    break
    for j = price to price - (price * percent / 100)
        res2 := j
	    for i = 2 to sqrt(price)
        	res2 := iff(j % i == 0 , 0, j)
            if res2 == 0
                break
		if res2 > 0
		    break
    res := iff(res1 - price < price - res2,  res1 - price, res2 - price)
    res := iff(res == 0, res[1], res)
    res

strategy(title="Prime Number Oscillator Backtest")
percent = input(5, minval=0.01, step = 0.01, title="Tolerance Percentage")
reverse = input(false, title="Trade reverse")
xPNO = PrimeNumberOscillator(close, percent)
pos = iff(xPNO > 0, 1,
       iff(xPNO < 0, -1, nz(pos[1], 0)))
possig = iff(reverse and pos == 1, -1,
          iff(reverse and pos == -1, 1, pos))
if (possig == 1)
    strategy.entry("Long", strategy.long)
if (possig == -1)
    strategy.entry("Short", strategy.short)
barcolor(possig == -1 ? red: possig == 1 ? green : blue )
clr = iff(xPNO > 0, green, red)
p1 = plot(xPNO, color=blue, title="KPO")
p2 = plot(0, color=black, title="0")
fill(p1,p2,color=clr)
Detail
https://www.fmz.com/strategy/430847
Last Modified
2023-11-02 14:42:22