
7.5 KiB
Name
基于移动均线交叉策略Moving-Average-Crossover-Strategy
Author
ChaoZhang
Strategy Description
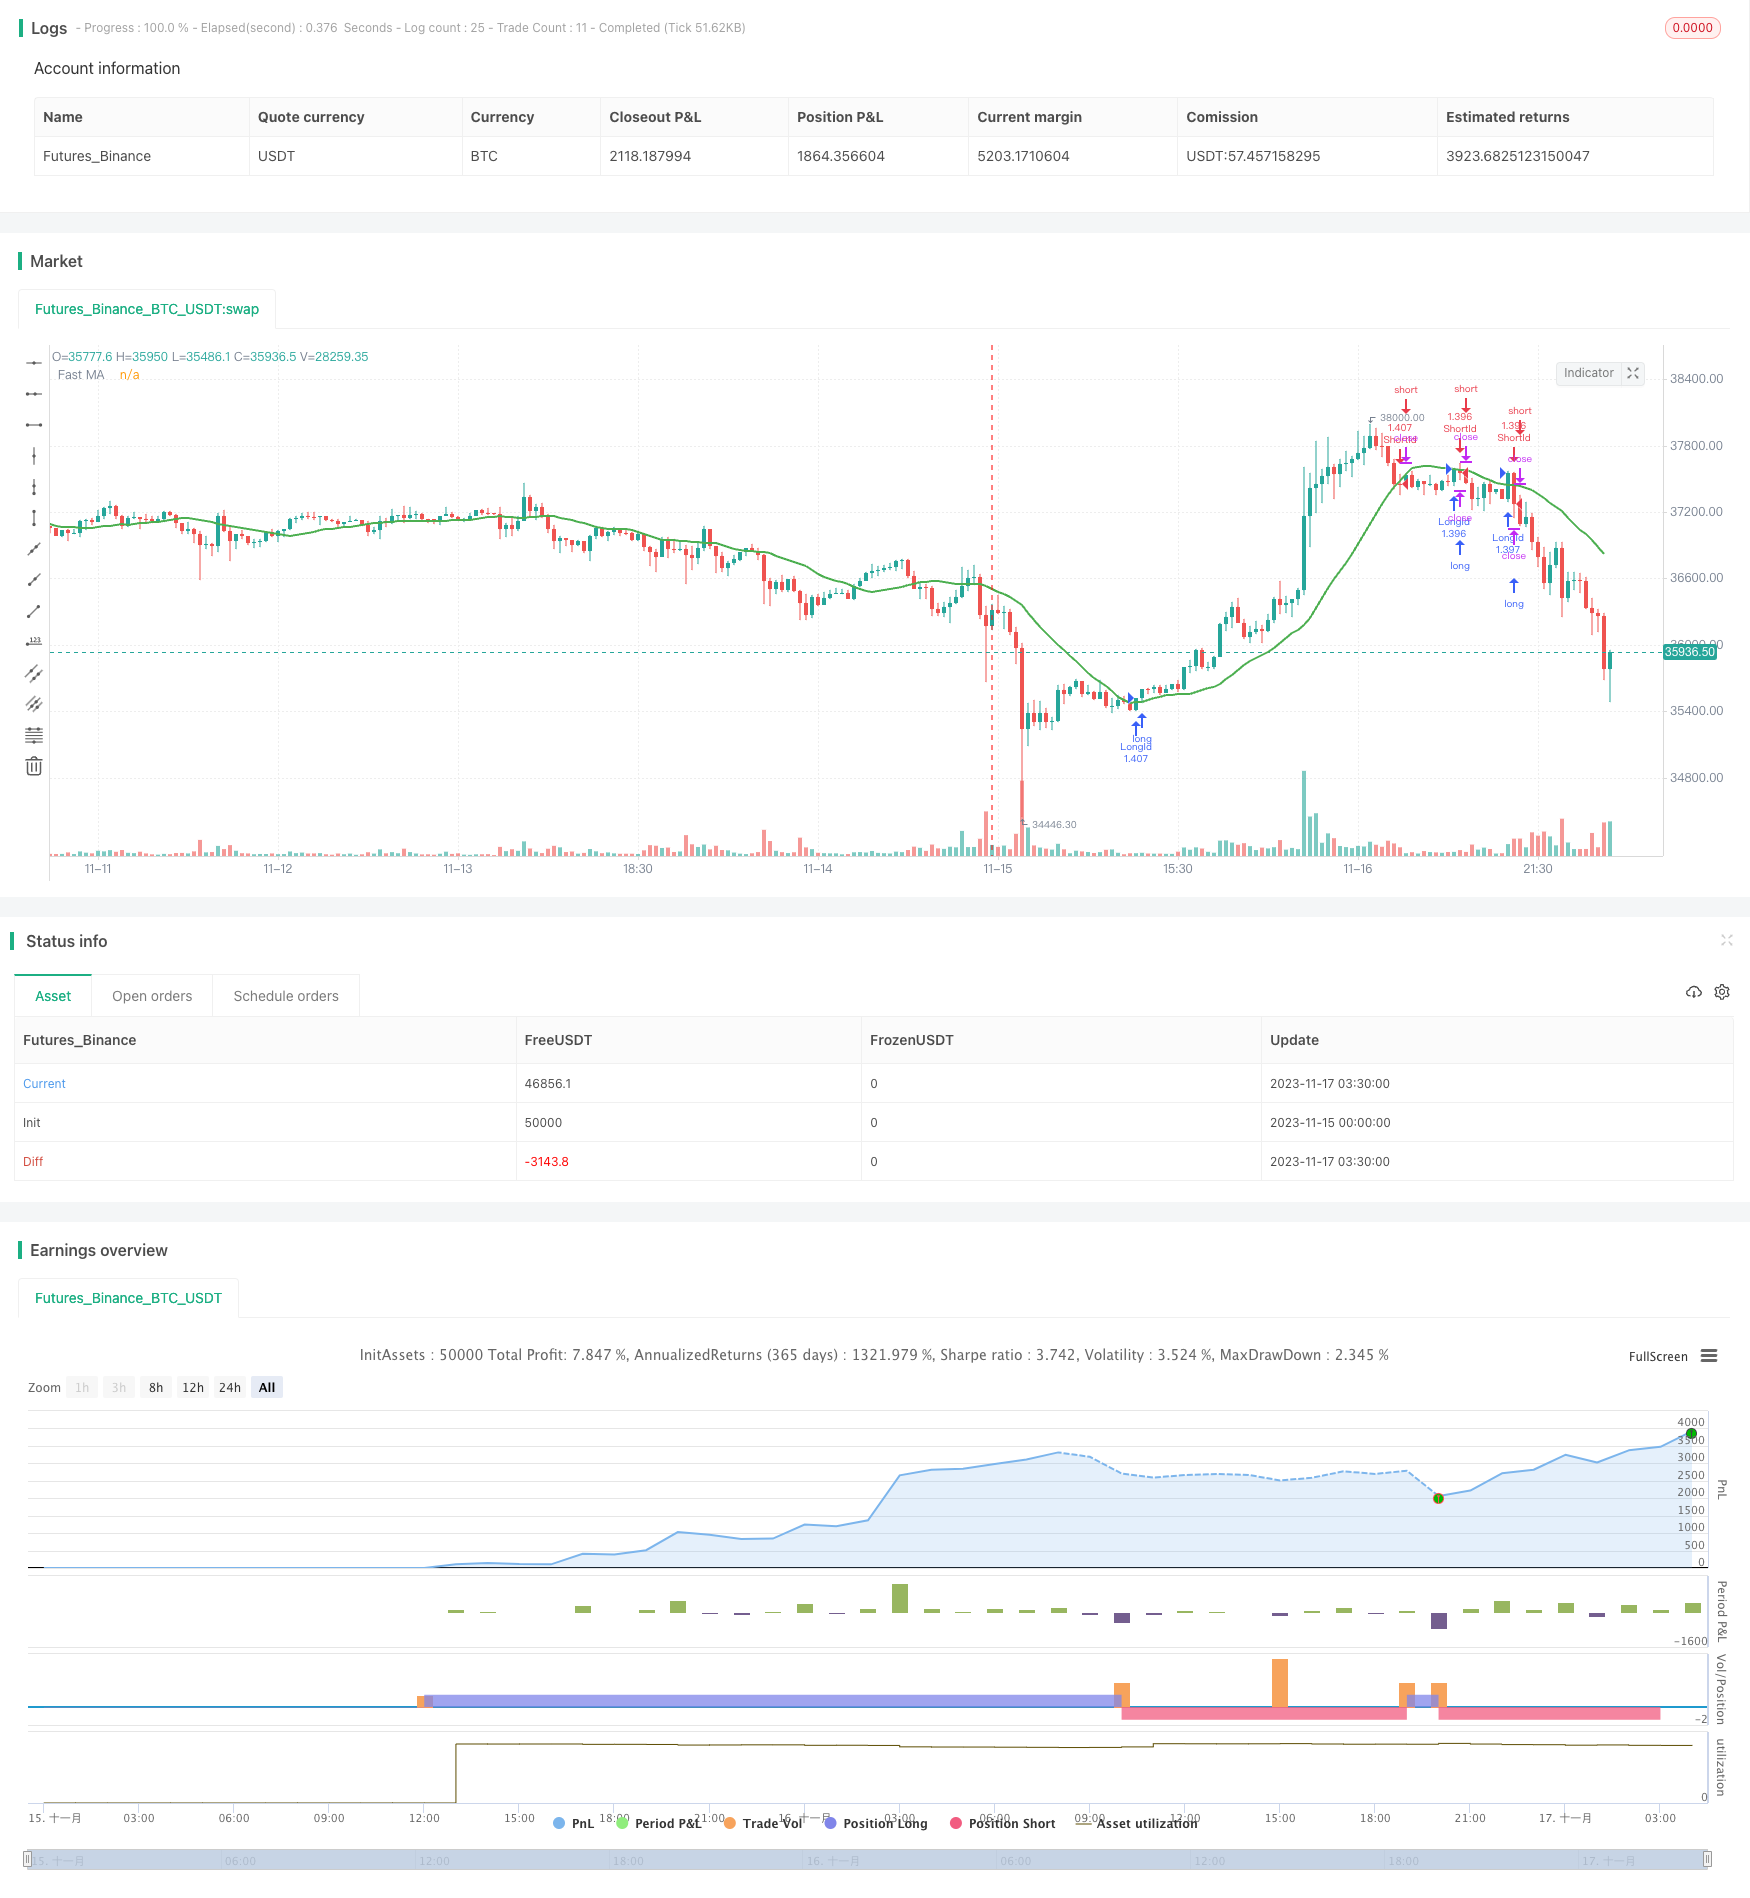
[trans]
概述
均线交叉策略是一个基于移动均线的交易策略。它使用快速移动均线和慢速移动均线的交叉作为买入和卖出信号。当快速均线从下方向上突破慢速均线时,产生买入信号;当快速均线从上方向下跌破慢速均线时,产生卖出信号。
策略原理
该策略使用sma函数计算指定周期的简单移动平均线,作为快速均线和慢速均线。策略默认快速均线周期为18天,可以通过参数调整。
当快速均线从下方向上突破慢速均线时,使用crossunder函数检测到交叉信号,产生买入信号。当快速均线从上方向下跌破慢速均线时,使用crossover函数检测到交叉信号,产生卖出信号。
策略通过track信号和exit信号实现自动交易。多头入场在快速均线从下方突破慢速均线时触发;空头入场在快速均线从上方跌破慢速均线时触发。对应的exit信号也在反向交叉时产生。
优势分析
- 使用移动均线交叉具有较强的趋势跟踪能力,可以有效捕捉价格趋势
- 均线策略较为简单直接,逻辑清晰,容易理解实现
- 可以通过调整均线参数优化策略,适应不同市场环境
- 策略实现自动化交易,无需人工干预,降低操作成本
风险及解决方法
- 当价格处于震荡区间时,会出现多次无效交叉信号,带来交易频繁的风险。可以通过增加过滤条件避免。
- 需关注参数优化问题,不同参数对策略表现有较大影响。可以通过回测优化参数,或引入自适应均线。
- 存在一定的错失信号风险,可以结合其他指标过滤信号或作为辅助条件。
- 可引入止损策略控制单笔损失。
优化方向
- 可以引入自适应均线或动态优化均线参数,使均线参数动态调整,更好跟踪市场。
- 可以增加过滤条件,避免在价格震荡、趋势不明时的错误信号。例如引入交易量过滤。
- 可以结合其他指标,例如布林带作为过滤或入场的辅助条件,提高策略表现。
- 可以引入止损策略,以控制单笔损失在可承受范围。
总结
均线交叉策略整体来说是一个较为经典和简单的趋势跟踪策略。它主要使用均线交叉作为交易信号,原理简单直接,容易理解实现,可通过参数调整适应市场。但也存在一些缺点,如易受震荡和趋势转向的影响, signaling频繁等。这些问题可以通过增加过滤条件、动态调整参数、引入止损等方式得到改进。该策略有着广泛的优化空间和方向,是量化交易的基础策略之一。
||
Overview
The moving average crossover strategy is a trading strategy based on moving averages. It uses the crossover of a fast moving average and a slow moving average as buy and sell signals. When the fast MA crosses above the slow MA from below, a buy signal is generated. When the fast MA crosses below the slow MA from above, a sell signal is generated.
Strategy Logic
The strategy uses the sma function to calculate simple moving averages of a specified period as the fast MA and slow MA. The default fast MA period is 18 days, which can be adjusted through parameters.
When the fast MA crosses above the slow MA from below, the crossunder function detects the crossover signal and generates a buy signal. When the fast MA crosses below the slow MA from above, the crossover function detects the crossover signal and generates a sell signal.
The strategy realizes automated trading through track signals and exit signals. Long entry triggers when the fast MA crosses above the slow MA, and short entry triggers when the fast MA crosses below the slow MA. The corresponding exit signals are also generated on reverse crossovers.
Advantage Analysis
- Moving averages have the ability to track trends effectively and catch price momentum
- MA strategies are simple and straightforward, easy to understand and implement
- Parameters can be optimized to adapt to different market environments
- The strategy automates trading without manual intervention, reducing trading costs
Risks and Solutions
- Price oscillations may cause multiple false signals and high trading frequency. Additional filters can avoid this.
- Parameter optimization is crucial and may significantly impact performance. Backtest optimization and adaptive MAs can help.
- There are risks of missing signals. Other indicators may be combined to filter or supplement trade signals.
- Stop loss can control single trade loss.
Optimization Directions
- Adaptive moving averages can be used to dynamically adjust MA parameters for better tracking.
- Additional filters, like trading volumes, can avoid false signals when trend is unclear.
- Combining other indicators like Bollinger Bands as filters or supplementary conditions can improve strategy performance.
- Stop loss strategy controls single trade loss within acceptable levels.
Conclusion
The MA crossover strategy is a classic and simple trend-following strategy. It mainly uses MA crossovers as trading signals with easy logic and implementation. It can be adapted through parameter tuning. But it also has drawbacks like susceptibility to oscillations and trend reversals, high signal frequency etc. These can be improved through filters, dynamic parameters, stop loss etc. The strategy has extensive optimization space and directions, and is one of the fundamental quantitative trading strategies.
[/trans]
Strategy Arguments
| Argument | Default | Description |
|---|---|---|
| v_input_1_open | 0 | MA Source: open |
| v_input_2 | 18 | MA Period |
| v_input_3 | 2018 | Backtest Start Year |
| v_input_4 | true | Backtest Start Month |
| v_input_5 | true | Backtest Start Day |
| v_input_6 | true | UseStopLoss |
| v_input_7 | 50 | Stop loss percentage(0.1%) |
Source (PineScript)
/*backtest
start: 2023-11-15 00:00:00
end: 2023-11-17 04:00:00
period: 30m
basePeriod: 15m
exchanges: [{"eid":"Futures_Binance","currency":"BTC_USDT"}]
*/

//@version=3
strategy(title = "MA Close Strategy", shorttitle = "MA Close",calc_on_order_fills=true,calc_on_every_tick =true, initial_capital=21000,commission_value=.25,overlay = true,default_qty_type = strategy.percent_of_equity, default_qty_value = 100)

MASource   = input(defval = open, title = "MA Source")
MaLength   = input(defval = 18, title = "MA Period", minval = 1)

StartYear = input(2018, "Backtest Start Year")
StartMonth = input(1, "Backtest Start Month")
StartDay = input(1, "Backtest Start Day")
UseStopLoss = input(true,"UseStopLoss")
stopLoss = input(50, title = "Stop loss percentage(0.1%)")

window() => time >=  timestamp(StartYear, StartMonth, StartDay,00,00) ? true : false

MA = sma(MASource,MaLength)

plot(MA, title = "Fast MA", color = green, linewidth = 2, style = line, transp = 50)

long = crossunder(MA, close)
short = crossover(MA, close)

if (long)
    strategy.entry("LongId", strategy.long, when = long)
    strategy.exit("ExitLong", from_entry = "LongId", when = short)

if (short)
    strategy.entry("ShortId", strategy.short, when = short)
    strategy.exit("ExitShort", from_entry = "ShortId", when = long)

if (UseStopLoss)
    strategy.exit("StopLoss", "LongId", loss = close * stopLoss / 1000 / syminfo.mintick)
    strategy.exit("StopLoss", "ShortId", loss = close * stopLoss / 1000 / syminfo.mintick)
Detail
https://www.fmz.com/strategy/432987
Last Modified
2023-11-23 13:38:02