
12 KiB
Name
基于均线和MACD指标的量化交易策略Trend-Following-Strategy-Based-on-Moving-Average-and-MACD
Author
ChaoZhang
Strategy Description
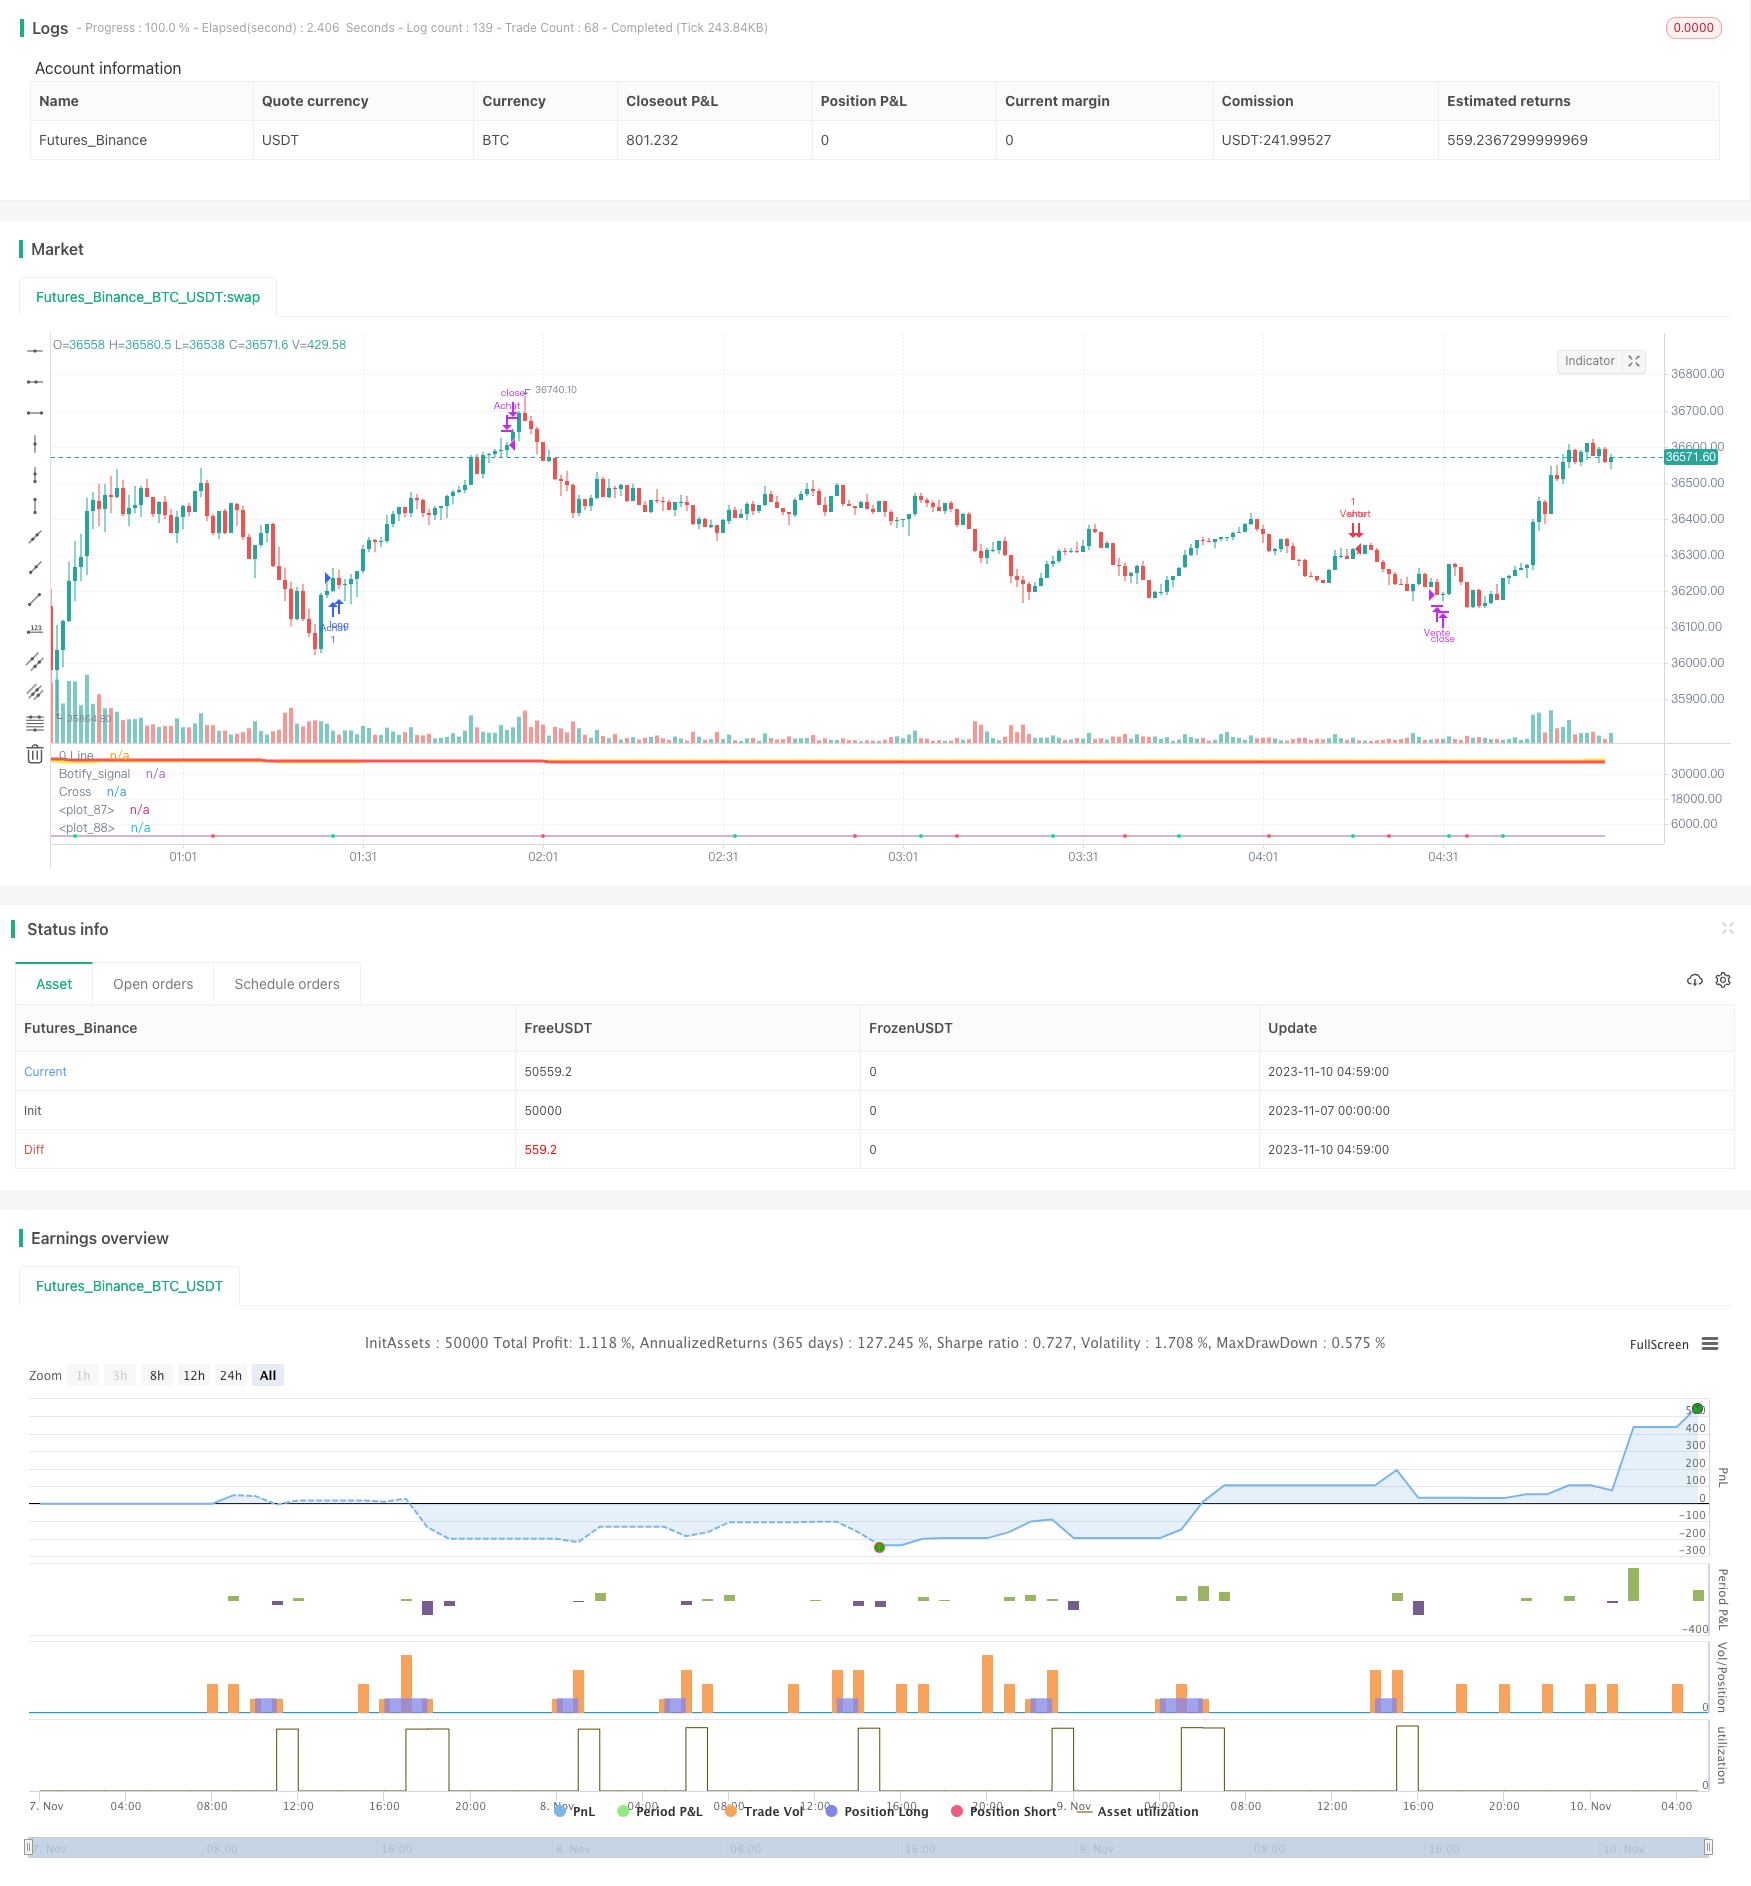
[trans]
概述
该策略结合了均线和MACD指标来判断趋势和发出交易信号,属于典型的趋势跟踪策略。它使用两个不同周期的ZLSMA均线进行判断趋势方向,再结合MACD指标的多空线交叉来发出具体的买入和卖出信号,可以有效捕捉中长线趋势的同时避免被短期市场噪音所误导。
策略原理
该策略主要由以下几部分组成:
-
快速ZLSMA均线和慢速ZLSMA均线:通过不同周期的ZLSMA均线比较,判断总体趋势方向。快速线由32周期ZLSMA组成,慢速线由400周期ZLSMA组成。当快速线上穿慢速线时为看多形态,反之则看空。
-
MACD指标:由快线(12日EMA)减去慢线(26日EMA)得到差离值MACD,再用9日EMA得到信号线。当MACD上穿信号线时为买入信号,下穿为卖出信号。
-
交易信号:只有当ZLSMA形态和MACD信号同向时,才会发出买入或卖出信号。即多头趋势加上MACD金叉时买入,空头趋势加上MACD死叉时卖出。
-
止损止盈:该策略暂未加入止损止盈逻辑,需要后续进一步优化。
以上组合使用均线判断大趋势,MACD判断入场时机,可以有效过滤假突破,避免被短期市场噪音误导。
优势分析
该策略主要有以下优势:
-
捕捉趋势:通过不同周期均线组合判断趋势方向,可以顺势而为,有效捕捉中长线趋势。
-
过滤噪音:MACD指标的应用可以过滤短期市场噪音,避免被小范围震荡误导。
-
参数可调:均线周期和MACD参数都可以自定义,可以针对不同市场进行优化。
-
易于实施:各项指标均为常用技术指标,组合逻辑简单清晰,易于理解和实施。
-
风险可控:有明确的止损和止盈策略,可以控制每笔交易的风险和收益比。
风险分析
该策略也存在以下风险:
-
大趋势判断错误:如果判断大趋势方向错误,则所有交易均可能失利。
-
参数优化不当:必须要对均线参数和MACD参数进行详细测试和优化,否则效果可能不佳。
-
缺乏止损机制:目前没有设置止损点,存在亏损过大的风险。
-
盈利空间有限:作为趋势跟踪策略,每个交易盈利空间有限,需要数量来获得更高收益。
-
交易频率过高:参数设置不当可能导致交易频率过高,增加交易成本和滑点成本。
优化方向
该策略可以从以下几个方面进行进一步优化:
-
加入止损机制:设置合理的止损点,严格控制单笔交易的最大亏损。
-
优化参数:通过回测和优化找到最佳的均线和MACD参数组合。
-
降低交易频率:调整参数,确保只在趋势较明显时才发出交易信号。
-
结合其他因素:可加入交易量变化等其他因素来确认趋势和信号。
-
优化入场时机:进一步优化MACD指标的应用,提高入场的准确性。
-
多品种通用:通过参数优化,使策略可以广泛适用于不同品种,扩大适用范围。
总结
整体来说,该策略通过简单有效的均线和MACD指标组合,实现了对中长线趋势的捕捉,可以作为量化交易的基础策略。但仍需要进一步优化参数,控制风险,并结合其他因素来实现更稳定的交易效果。具有一定的实战价值和拓展空间。
||
Overview
This strategy combines moving averages and the MACD indicator to determine trends and generate trading signals. It belongs to a typical trend following strategy. It uses two ZLSMA moving averages of different timeframes to determine the trend direction, and MACD crossover to generate specific buy and sell signals. This allows it to effectively capture mid-to-long term trends while avoiding being misled by short-term market noise.
Strategy Logic
The strategy consists of the following main components:
-
Fast ZLSMA and Slow ZLSMA: Comparing ZLSMA moving averages of different timeframes determines the overall trend direction. The fast line consists of 32-period ZLSMA, and the slow line consists of 400-period ZLSMA. When the fast line crosses above the slow line, it is a bullish signal, and vice versa.
-
MACD Indicator: MACD is calculated by subtracting the slow line (26-period EMA) from the fast line (12-period EMA). The signal line is a 9-period EMA of the MACD. When MACD crosses above the signal line, it is a buy signal, and when MACD crosses below the signal line, it is a sell signal.
-
Trading signals: Buy and sell signals are generated only when the ZLSMA trend direction aligns with the MACD crossover signals. Specifically, go long when bull trend coincides with MACD golden cross, and go short when bear trend coincides with MACD death cross.
-
Stop loss and take profit: The strategy does not currently include stop loss and take profit logic, which needs further optimization.
The combination of using moving averages to determine the major trend and MACD to time the entry can effectively filter out false breakouts and avoid being misled by short-term market noise.
Advantage Analysis
The main advantages of this strategy are:
-
Catching trends: Using moving averages of different timeframes to determine trend direction allows trading with the trend and capturing mid-to-long term trends effectively.
-
Filtering noise: Applying the MACD indicator helps filter out short-term market noise and avoid being misled by small ranging markets.
-
Customizable parameters: The moving average periods and MACD parameters are customizable and can be optimized for different markets.
-
Easy to implement: All indicators used are common technical indicators. The strategy logic is simple and clear, easy to understand and implement.
-
Controllable risk: With clear stop loss and take profit in place, the risk and reward of each trade can be controlled.
Risk Analysis
The main risks of this strategy are:
-
Wrong trend determination: If the major trend is determined incorrectly, all trades can result in losses.
-
Improper parameter optimization: The moving average and MACD parameters must be thoroughly tested and optimized, otherwise the results may be unsatisfactory.
-
Lack of stop loss: Currently no stop loss is in place, posing the risk of oversized losses.
-
Limited profit potential: As a trend following strategy, the profit potential of each trade is limited, requiring high volume to increase profitability.
-
High trading frequency: Improper parameter tuning may result in excessive trading frequency, increasing transaction costs and slippage.
Optimization Directions
The strategy can be further optimized in the following aspects:
-
Add stop loss mechanism: Set proper stop loss points to strictly control the maximum loss per trade.
-
Optimize parameters: Backtest and optimize to find the optimal moving average and MACD parameter combination.
-
Lower trading frequency: Adjust parameters to ensure trading signals are only generated when the trend is pronounced.
-
Incorporate other factors: Factors like volume changes can be added to confirm trend and signals.
-
Improve entry timing: Further enhance MACD usage to increase entry accuracy.
-
Make universally applicable: Optimize parameters to make the strategy broadly applicable across different products, expanding applicability.
Conclusion
In conclusion, this strategy effectively captures mid-to-long term trends through simple yet effective combination of moving averages and MACD, making it a solid quantitative trading strategy foundation. But parameters need further optimization, risks require better control, and other factors should be incorporated to achieve more consistent results. It has practical value and much room for improvement.
[/trans]
Strategy Arguments
| Argument | Default | Description |
|---|---|---|
| v_input_1 | true | Use Current Chart Resolution? |
| v_input_2 | true | Show MacD & Signal Line? Also Turn Off Dots Below |
| v_input_3 | true | Show Dots When MacD Crosses Signal Line? |
| v_input_4 | true | Show Histogram? |
| v_input_5 | true | Change MacD Line Color-Signal Line Cross? |
| v_input_6 | true | MacD Histogram 4 Colors? |
| v_input_7 | 12 | fastLength |
| v_input_8 | 26 | slowLength |
| v_input_9 | 9 | signalLength |
| v_input_10 | 32 | Longueur |
| v_input_11 | false | Décalage |
| v_input_12_close | 0 | Source: close |
| v_input_13 | 400 | Longueur |
| v_input_14 | false | Décalage |
| v_input_15 | 0.5 | Sensibilité |
Source (PineScript)
/*backtest
start: 2023-11-07 00:00:00
end: 2023-11-10 05:00:00
period: 1m
basePeriod: 1m
exchanges: [{"eid":"Futures_Binance","currency":"BTC_USDT"}]
*/

// This source code is subject to the terms of the Mozilla Public License 2.0 at https://mozilla.org/MPL/2.0/
// © veryfid

//@version=5
strategy("Stratégie ZLSMA Bruno", shorttitle="Stratégie ZLSMA Bruno", overlay=false)

source = close
useCurrentRes = input(true, title="Use Current Chart Resolution?")
smd = input(true, title="Show MacD & Signal Line? Also Turn Off Dots Below")
sd = input(true, title="Show Dots When MacD Crosses Signal Line?")
sh = input(true, title="Show Histogram?")
macd_colorChange = input(true,title="Change MacD Line Color-Signal Line Cross?")
hist_colorChange = input(true,title="MacD Histogram 4 Colors?")

//res = useCurrentRes ? period : resCustom

fastLength = input(12),
slowLength=input(26)
signalLength=input(9)

fastMA = ta.ema(source, fastLength)
slowMA = ta.ema(source, slowLength)

macd = fastMA - slowMA
signal = ta.sma(macd, signalLength)
hist = macd - signal

outMacD =  macd
outSignal = signal
outHist =  hist

histA_IsUp = outHist > outHist[1] and outHist > 0
histA_IsDown = outHist < outHist[1] and outHist > 0
histB_IsDown = outHist < outHist[1] and outHist <= 0
histB_IsUp = outHist > outHist[1] and outHist <= 0

//MacD Color Definitions
macd_IsAbove = outMacD >= outSignal
macd_IsBelow = outMacD < outSignal

//plot_color = hist_colorChange ? histA_IsUp ? aqua : histA_IsDown ? blue : histB_IsDown ? red : histB_IsUp ? maroon :yellow :gray
macd_color = macd_colorChange ? macd_IsAbove ? color.lime : color.red : color.red
//signal_color = macd_colorChange ? macd_IsAbove ? yellow : yellow : lime

circleYPosition = outSignal

//plot(smd and outMacD ? outMacD : na, title="MACD", color=macd_color, linewidth=4)
//plot(smd and outSignal ? outSignal : na, title="Signal Line", color=signal_color, style=line ,linewidth=2)
//plot(sh and outHist ? outHist : na, title="Histogram", color=plot_color, style=histogram, linewidth=4)
plot(sd and ta.cross(outMacD, outSignal) ? circleYPosition : na, title="Cross", style=plot.style_circles, linewidth=4, color=macd_color)
hline(0, '0 Line', linestyle=hline.style_solid, linewidth=2, color=color.white)

// Paramètres de la ZLSMA
length = input(32, title="Longueur")
offset = input(0, title="Décalage")
src = input(close, title="Source")
lsma = ta.linreg(src, length, offset)
lsma2 = ta.linreg(lsma, length, offset)
eq = lsma - lsma2
zlsma = lsma + eq

length_slow = input(400, title="Longueur")
offset_slow = input(0, title="Décalage")
lsma_slow = ta.linreg(src, length_slow, offset_slow)
lsma2_slow = ta.linreg(lsma_slow, length_slow, offset_slow)
eq_slow = lsma_slow - lsma2_slow
zlsma_slow = lsma_slow + eq_slow

// Paramètres de la sensibilité
sensitivity = input(0.5, title="Sensibilité")

// Règles de trading
longCondition = zlsma < zlsma_slow and  zlsma_slow < zlsma_slow[1] and zlsma > zlsma[1] and ta.cross(outMacD, outSignal) and  macd_color == color.lime//ta.crossover(zlsma, close) and ta.crossover(zlsma, zlsma[1]) // Croisement vers le haut
shortCondition = zlsma > zlsma_slow and  zlsma_slow > zlsma_slow[1] and zlsma < zlsma[1] and ta.cross(outMacD, outSignal) and  macd_color == color.lime   //ta.crossunder(zlsma, close) and ta.crossunder(zlsma, zlsma[1]) // Croisement vers le bas

// Entrée en position
strategy.entry("Achat", strategy.long, when=longCondition)
strategy.entry("Vente", strategy.short, when=shortCondition)
botifySignalZLSMA = longCondition ? 1 : shortCondition ? -1 : 0
plot(botifySignalZLSMA, title='Botify_signal', display=display.none)
// Sortie de position
strategy.close("Achat", when=ta.crossunder(zlsma, close)) // Close the "Achat" position
strategy.close("Vente", when=ta.crossover(zlsma, close)) // Close the "Vente" position


// Tracé de la courbe ZLSMA
plot(zlsma, color=color.yellow, linewidth=3)
plot(zlsma_slow, color=color.red, linewidth=3)
Detail
https://www.fmz.com/strategy/432213
Last Modified
2023-11-15 15:58:19