
6.8 KiB
Name
基于双EMA交叉的量化交易策略Quantitative-Trading-Strategy-Based-on-Double-EMA-Crossover
Author
ChaoZhang
Strategy Description
 [trans]
概述
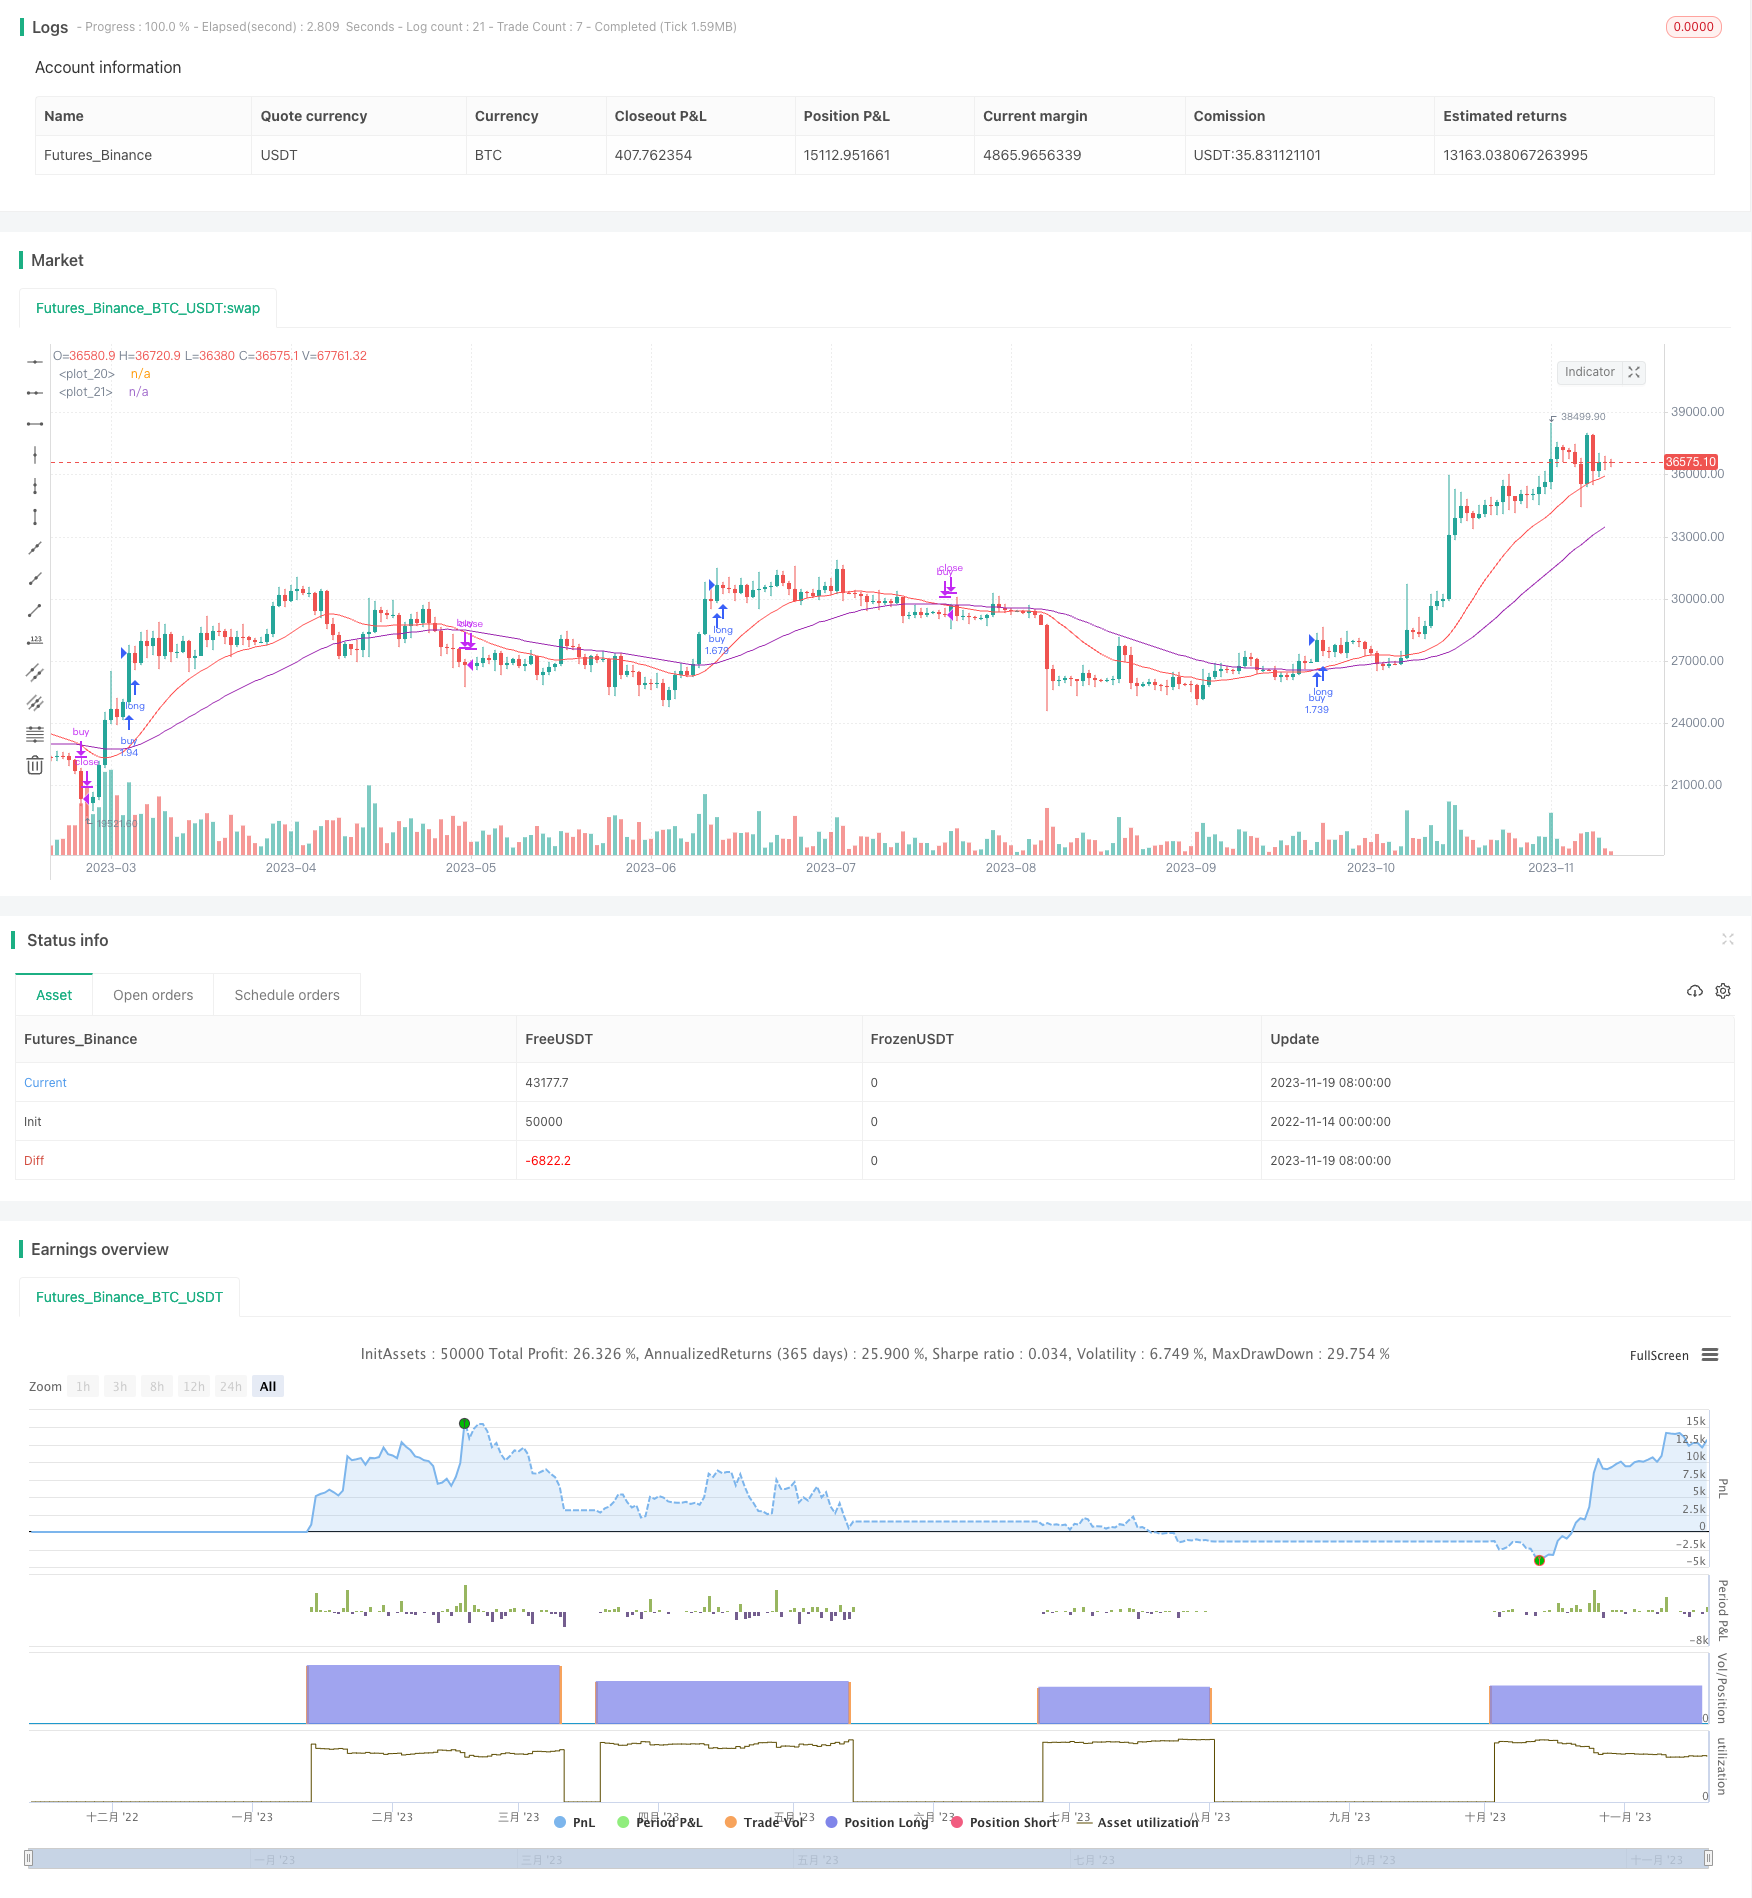
该策略通过计算两个不同周期的EMA均线的交叉来判断市场趋势,并据此产生交易信号。当短周期EMA上穿长周期EMA时,认为市场进入上升趋势,该策略将开仓做多;当短周期EMA下穿长周期EMA时,认为市场进入下降趋势,该策略将平仓退出。
策略原理
该策略主要应用双EMA均线的金叉死叉理论。双EMA均线分为长线EMA和短线EMA。短线EMA参数设置为10天,长线EMA参数设置为21天。
当短线EMA上穿长线EMA时,产生买入信号;当短线EMA下穿长线EMA时,产生卖出信号。该策略同时设置了增长率阈值,只有增长率超过阈值时才会开仓做多,跌幅超过阈值时才会平仓。
具体来说,买入条件为短线EMA高于长线EMA,且股价增长率超过设定的正阈值;平仓条件为短线EMA低于长线EMA,且股价增长率低于设定的负阈值。
策略优势
- 利用双EMA均线的金叉死叉理论,相对简单可靠
- 增加增长率阈值设定,避免增长乏力时错误交易
- 可严格控制最大损失比例
- 可灵活调整EMA均线参数,适用于不同周期
风险分析
- EMA均线具有滞后性,可能错过价格反转点
- 均线交叉具有一定迟滞性,可能导致失去最佳开仓时机
- 需依赖参数优化,参数设定不当可能导致交易频繁或信号不足
优化方向
- 结合其他指标进行优化,如MACD,KD等,提高信号准确率
- 增加止损策略,如跟踪止损,确保利润最大化
- 优化EMA周期参数,针对不同品种设定最佳参数
- 结合实时数据与机器学习方法进行动态参数调整优化
总结
本策略整体较为简单可靠,通过双EMA交叉判断价格趋势,并设定增长率阈值发出交易信号。相比单一均线交叉,可过滤部分假信号。但EMA均线本身存在滞后性问题,结合其他指标或动态调参可进一步提升策略效果。
||
Overview
This strategy generates trading signals by calculating the crossover between two EMA lines of different periods to determine market trends. It will open long positions when the shorter period EMA crosses over the longer period EMA, indicating an uptrend, and it will close positions when the shorter period EMA crosses below the longer period EMA, indicating a downtrend.
Principles
The strategy mainly applies the golden cross and death cross theory of double EMA lines. The double EMA lines consist of a long EMA and a short EMA. The short EMA parameter is set to 10 days and the long EMA parameter is set to 21 days.
When the short EMA crosses over the long EMA, a buy signal is generated. When the short EMA crosses below the long EMA, a sell signal is generated. The strategy also sets growth rate thresholds, opening long positions only when growth exceeds a positive threshold and closing positions only when decline exceeds a negative threshold.
Specifically, the buy condition is when the short EMA is higher than the long EMA and the stock growth rate exceeds the positive threshold. The close position condition is when the short EMA is lower than the long EMA and the stock growth rate falls below the negative threshold.
Advantages
- Utilizes the golden cross and death cross theory of double EMA lines for simplicity and reliability
- Adds growth rate thresholds to avoid erroneous trades during weak growth
- Can strictly control maximum loss ratio
- EMA period parameters can be flexibly adjusted for different cycles
Risk Analysis
- EMA lines have lagging effects, possibly missing price reversal points
- Line crossovers have some lag, possibly missing best entry points
- Relies on parameter optimization, improper settings may cause overtrading or insufficient signals
Optimization Directions
- Combine with other indicators like MACD, KD etc. to improve signal accuracy
- Add stop loss strategies like trailing stop loss to maximize profits
- Optimize EMA period parameters for best settings across different products
- Incorporate real-time data and machine learning methods for dynamic parameter adjustment and optimization
Summary
The overall strategy is relatively simple and reliable, using double EMA crossovers to determine price trends and setting growth rate thresholds to generate trading signals. Compared to single line crossovers, it can filter out some false signals. But EMA lines themselves have lagging issues. Combining other indicators or dynamic parameter adjustment can further improve strategy performance.
[/trans]
Strategy Arguments
| Argument | Default | Description |
|---|---|---|
| v_input_1 | false | Use Start Time Limiter? |
| v_input_2 | 2016 | Start From Year |
| v_input_3 | 5 | Start From Month |
| v_input_4 | true | Start From Day |
| v_input_5 | false | Start From Hour |
| v_input_6 | false | Start From Minute |
| v_input_7 | 10 | lenght0 |
| v_input_8 | 21 | lenght1 |
| v_input_9 | 0.05 | Threshold Up |
| v_input_10 | -0.165 | Threshold Down |
Source (PineScript)
/*backtest
start: 2022-11-14 00:00:00
end: 2023-11-20 00:00:00
period: 1d
basePeriod: 1h
exchanges: [{"eid":"Futures_Binance","currency":"BTC_USDT"}]
*/

//@version=3
strategy(title="ema(ema10-21)", overlay=true, pyramiding = 0, default_qty_type = strategy.percent_of_equity, default_qty_value = 100, initial_capital = 15000, commission_type = strategy.commission.percent, commission_value = 0.2)

useTimeLimit    = input(defval = false, title = "Use Start Time Limiter?")
startYear       = input(defval = 2016, title = "Start From Year",  minval = 0, step = 1)
startMonth      = input(defval = 05, title = "Start From Month",  minval = 0,step = 1)
startDay        = input(defval = 01, title = "Start From Day",  minval = 0,step = 1)
startHour       = input(defval = 00, title = "Start From Hour",  minval = 0,step = 1)
startMinute     = input(defval = 00, title = "Start From Minute",  minval = 0,step = 1)

startTimeOk() => true

lenght0 = input(10)
lenght1 = input(21)

source = close

EmaShort = ema(ema(source, lenght0), lenght0)
EmaLong = ema(ema(source, lenght1),lenght1)
plot(EmaShort, color=red)
plot(EmaLong, color=purple)

growth = ((EmaShort-EmaLong)*100)/((EmaShort+EmaLong)/2)
thresholdUp = input(defval=0.05, title="Threshold Up", type=float, step=0.01)
thresholdDown = input(defval=-0.165, title="Threshold Down", type=float, step=0.001)

if( startTimeOk() )
    buy_condition = EmaShort > EmaLong and growth > thresholdUp
    buy_exit_condition = EmaShort < EmaLong and growth < thresholdDown
    strategy.entry("buy", strategy.long, comment="buy", when=buy_condition)
    strategy.close(id='buy', when=buy_exit_condition)
Detail
https://www.fmz.com/strategy/432763
Last Modified
2023-11-21 11:41:40