
9.3 KiB
Name
基于卡马利拉通道的突破策略Breakout-Strategy-Based-on-Camarilla-Channels
Author
ChaoZhang
Strategy Description
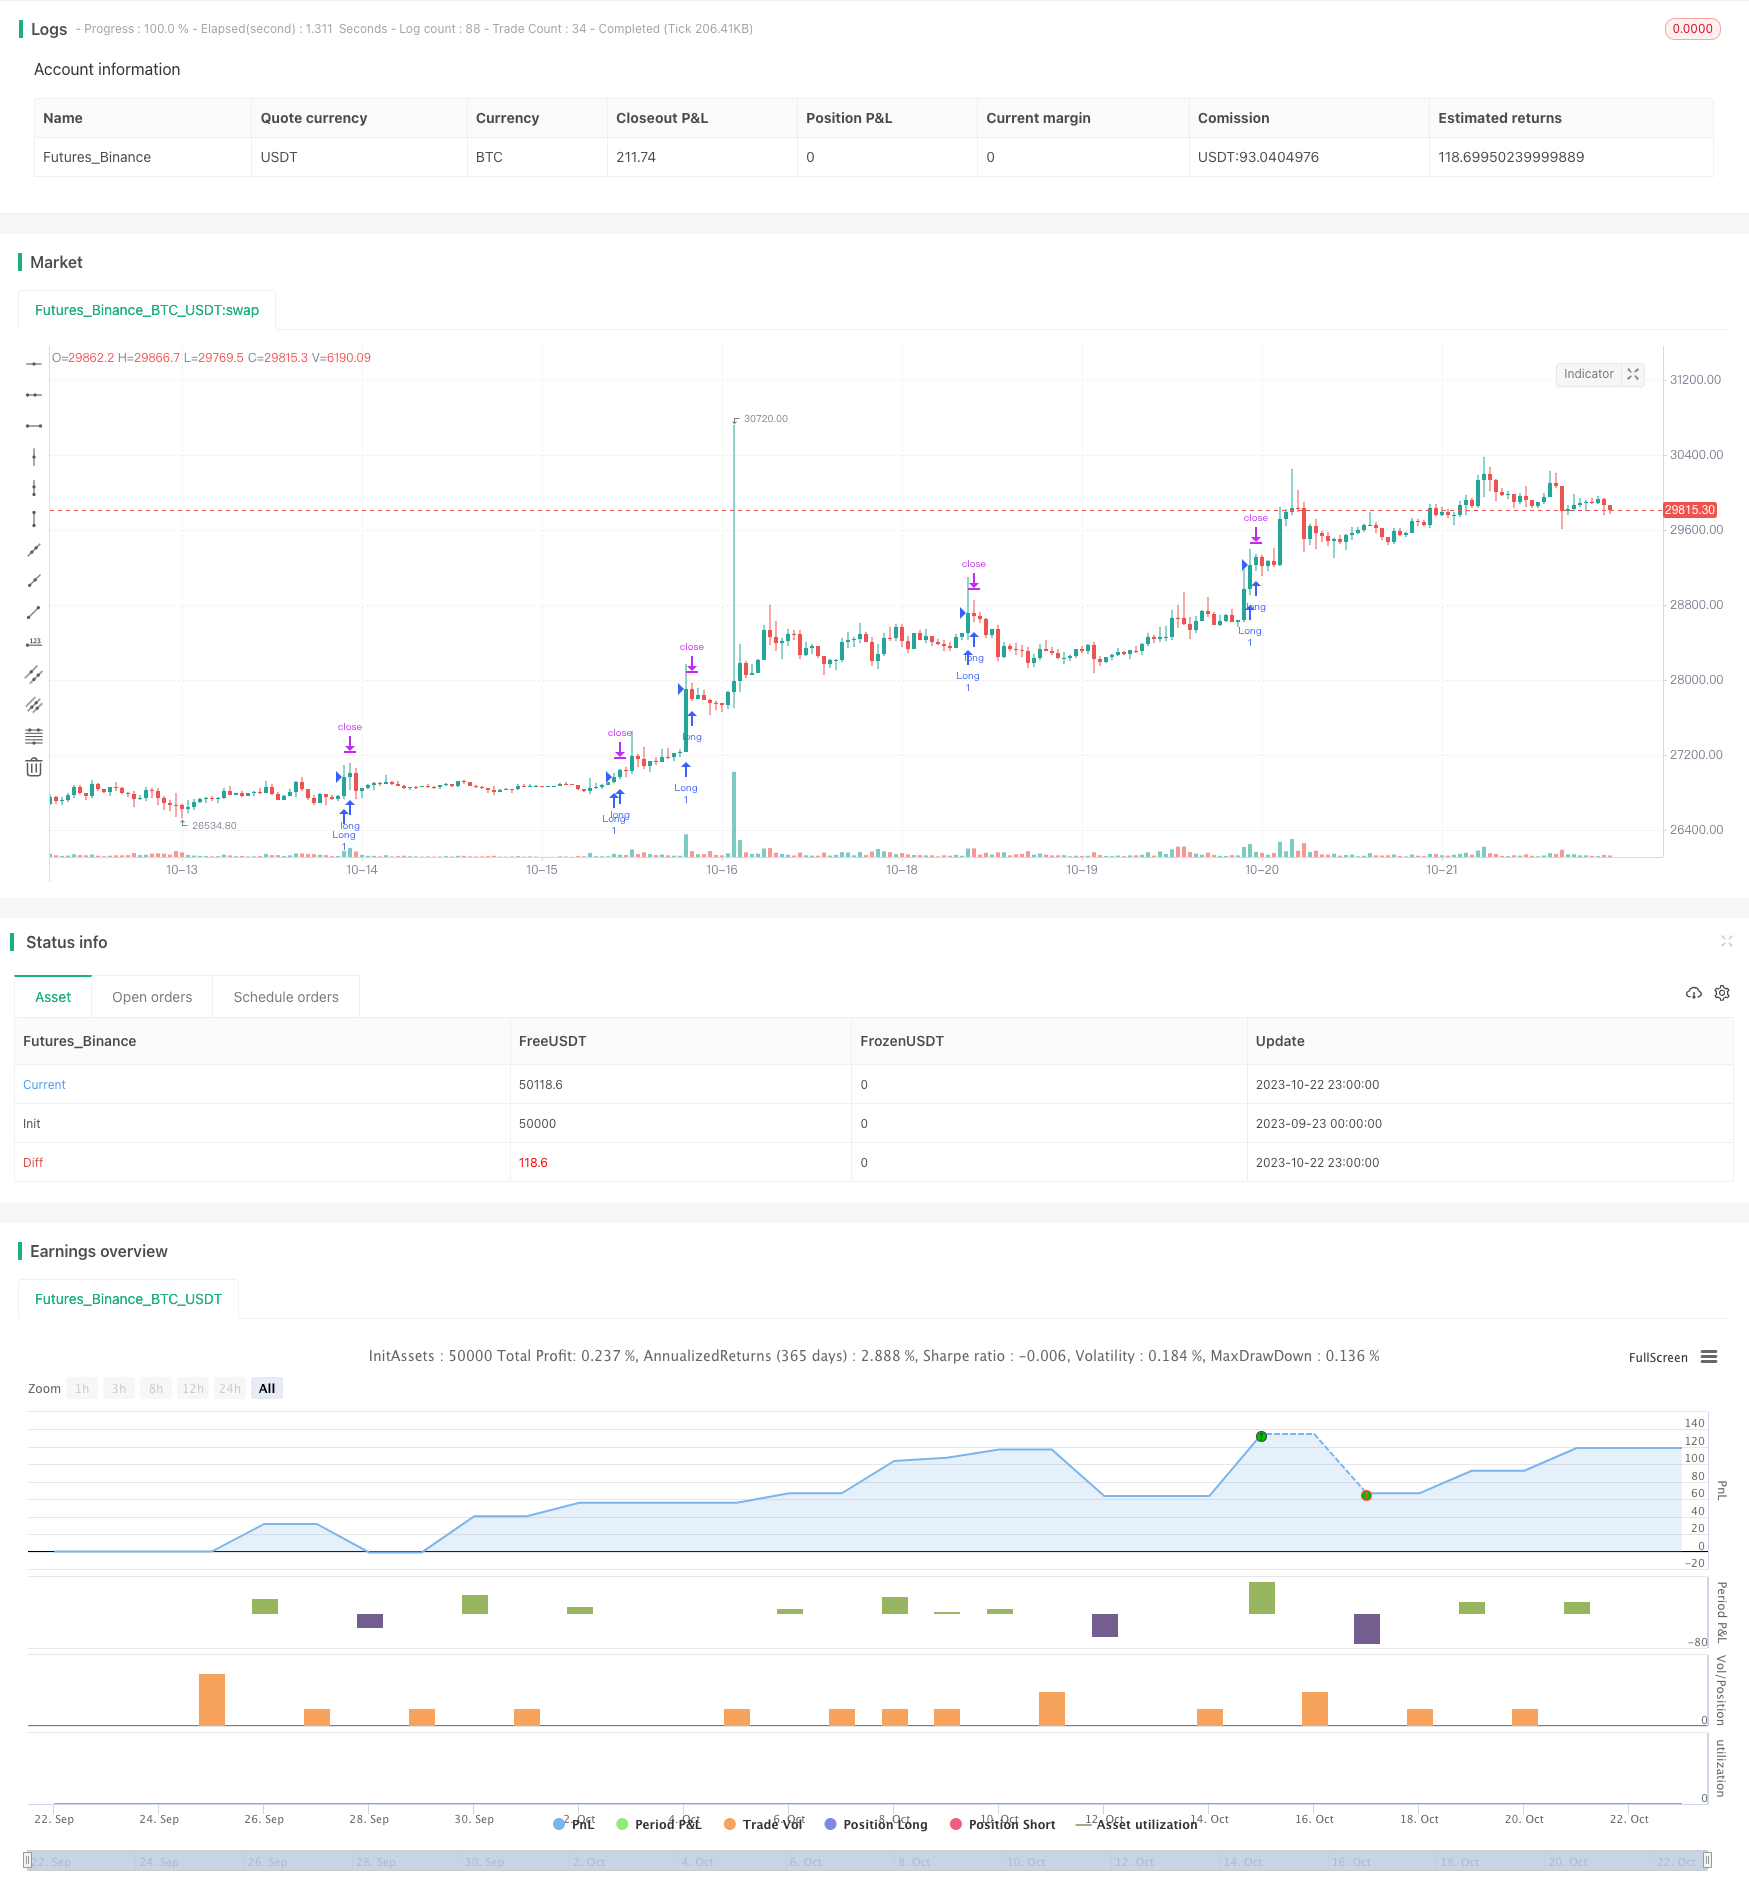
[trans]
概述
该策略主要基于卡马利拉通道和移动均线来判断市场的突破点,进而实现趋势跟踪。策略相对简单,但具有较强的实用性。
策略原理
-
计算卡马利拉通道的支撑和阻力线。包括H4,L4等线。
-
判断价格是否突破该通道线。例如收盘价上穿H4线且开盘价低于H4线,认为有突破信号。
-
加入移动均线判断,进一步确认突破信号。例如EMA低于收盘价则为多头突破。
-
进入做多头仓位,设置止损和止盈条件,如设置固定止损点数,以及追踪止损方式。
-
针对空头也是同样判断逻辑。
以上是策略的主要判断逻辑,相对简单直观,容易理解和实现。通过动态追踪止损,可以持续获利直至趋势反转。
优势分析
该策略具有以下优势:
-
基于卡马利拉通道,可以准确定位潜在的支撑和阻力。
-
结合均线过滤,可以有效区分突破信号的真假。
-
采用追踪止损方式,可以持续获利,避免反转止损。
-
策略信号简单明确,容易判断操作。
-
无需频繁调整参数,适合参数固定的自动交易。
风险及解决方案
该策略也存在以下风险:
-
卡马利拉通道无法有效判断趋势反转点,可能导致亏损扩大。
- 解决方法:结合其他指标如震荡指标判断趋势反转
-
追踪止损点数设置不合理可能导致过早止损或亏损扩大。
- 解决方法:优化和测试不同的止损点数设置
-
突破信号可能存在假突破情况。
- 解决方法:加入更多滤波指标进行确认,或适当放宽突破判定标准。
-
大幅震荡市场中存在多次假突破。
- 解决方法:在震荡期避免交易,或适当放宽突破标准。
优化建议
该策略还可以从以下方面进行优化:
-
增加复合过滤指标,提高突破准确率。可以考虑KDJ,MACD等。
-
优化止损止盈策略,如引入动态止损,结合ATR指标等。
-
对不同品种参数进行优化,提高稳定性。
-
增加对大周期趋势的判断,避免逆势交易。
-
结合当日量能分析,聚焦高量能突破。
-
开发自动参数优化程序,实时优化参数。
-
扩展成多品种套利策略,利用价差。
总结
本策略整体思路清晰简单,实用性强,是典型的突破跟踪策略。通过卡马利拉通道判断潜在支撑阻力,再结合均线过滤确定突破方向。止损方式也较为合理。但该策略可扩展性也很强,可以引入更多指标进行优化,使策略更稳健可靠。也可以扩展为多品种策略。总体来说,本策略具有很好的改进潜力。
||
Overview
This strategy mainly uses Camarilla channels and moving averages to identify breakout points in the market, and thus implement trend following. The strategy is relatively simple but quite practical.
Strategy Logic
-
Calculate support and resistance levels using Camarilla channels, including H4, L4 etc.
-
Identify if price breaks through these channel lines. For example, close above H4 and open below H4 indicates a breakout signal.
-
Add moving average filter for further confirmation. For example, if EMA is below close, it's a bullish breakout.
-
Enter long position with stop loss and take profit. Such as fixed stop loss points, and trailing stop loss.
-
Same logic applies for short positions.
The logic is straightforward and easy to understand. With trailing stop loss, the strategy can ride trends effectively.
Advantages
The advantages of this strategy:
-
Camarilla channels accurately locate potential supports and resistances.
-
Moving averages filter helps validate true breakout signals.
-
Trailing stop loss takes profits while avoiding reversal stops.
-
Signals are clear and easy to act upon.
-
No frequent adjustments needed for automated trading.
Risks and Solutions
There are some risks to be aware of:
-
Camarilla channels cannot identify turning points effectively.
- Solution: Add oscillators to detect trend reversal.
-
Improper stop loss points setting may lead to premature exit or enlarged losses.
- Solution: Optimize and test different stop loss levels.
-
Breakout signals may turn out to be false signals.
- Solution: Add more filters for confirmation, or relax breakout criteria.
-
Many false breakouts may happen in ranging markets.
- Solution: Avoid trading in ranging periods, or relax criteria.
Improvement Suggestions
The strategy can be further improved from the following aspects:
-
Add more indicators as filters to increase breakout accuracy, such as KDJ, MACD etc.
-
Optimize exits, such as dynamic trailing stop loss, integrating ATR etc.
-
Optimize parameters for different products to increase robustness.
-
Add higher time frame trend filter to avoid counter-trend trading.
-
Focus on high volume breakouts for confirmation.
-
Develop auto parameter optimization for dynamic tuning.
-
Expand to multi-product arbitrage strategies.
Conclusion
The strategy has a clear and simple logic with strong practicality. It identifies potential supports and resistances using Camarilla and confirms breakout direction with moving averages. The exit method is also reasonable. There is also huge potential for enhancement, such as adding more indicators, multi-product expansion etc. Overall this is a promising strategy with good potential.
[/trans]
Source (PineScript)
/*backtest
start: 2023-09-23 00:00:00
end: 2023-10-23 00:00:00
period: 1h
basePeriod: 15m
exchanges: [{"eid":"Futures_Binance","currency":"BTC_USDT"}]
*/

//@version=2
//Created by CristianD
strategy(title="CamarillaStrategyV1", shorttitle="CD_Camarilla_StrategyV1", overlay=true)
//sd = input(true, title="Show Daily Pivots?")
EMA = ema(close,8)

//Camarilla
pivot = (high + low + close ) / 3.0
range = high - low
h5 = (high/low) * close
h4 = close + (high - low) * 1.1 / 2.0
h3 = close + (high - low) * 1.1 / 4.0
h2 = close + (high - low) * 1.1 / 6.0
h1 = close + (high - low) * 1.1 / 12.0
l1 = close - (high - low) * 1.1 / 12.0
l2 = close - (high - low) * 1.1 / 6.0
l3 = close - (high - low) * 1.1 / 4.0
l4 = close - (high - low) * 1.1 / 2.0
h6 = h5 + 1.168 * (h5 - h4)
l5 = close - (h5 - close)
l6 = close - (h6 - close)

// Daily line breaks
//sopen = request.security(syminfo.tickerid, "D", open [1])
//shigh = request.security(syminfo.tickerid, "D", high [1])
//slow = request.security(syminfo.tickerid, "D", low [1])
//sclose = request.security(syminfo.tickerid, "D", close [1])
//
// Color
//dcolor=sopen != sopen[1] ? na : black
//dcolor1=sopen != sopen[1] ? na : red
//dcolor2=sopen != sopen[1] ? na : green

//Daily Pivots
dtime_pivot = request.security(syminfo.tickerid, 'D', pivot[1])
dtime_h6 = request.security(syminfo.tickerid, 'D', h6[1])
dtime_h5 = request.security(syminfo.tickerid, 'D', h5[1])
dtime_h4 = request.security(syminfo.tickerid, 'D', h4[1])
dtime_h3 = request.security(syminfo.tickerid, 'D', h3[1])
dtime_h2 = request.security(syminfo.tickerid, 'D', h2[1])
dtime_h1 = request.security(syminfo.tickerid, 'D', h1[1])
dtime_l1 = request.security(syminfo.tickerid, 'D', l1[1])
dtime_l2 = request.security(syminfo.tickerid, 'D', l2[1])
dtime_l3 = request.security(syminfo.tickerid, 'D', l3[1])
dtime_l4 = request.security(syminfo.tickerid, 'D', l4[1])
dtime_l5 = request.security(syminfo.tickerid, 'D', l5[1])
dtime_l6 = request.security(syminfo.tickerid, 'D', l6[1])

//offs_daily = 0
//plot(sd and dtime_pivot ? dtime_pivot : na, title="Daily Pivot",color=dcolor, linewidth=2)
//plot(sd and dtime_h6 ? dtime_h6 : na, title="Daily H6", color=dcolor2, linewidth=2)
//plot(sd and dtime_h5 ? dtime_h5 : na, title="Daily H5",color=dcolor2, linewidth=2)
//plot(sd and dtime_h4 ? dtime_h4 : na, title="Daily H4",color=dcolor2, linewidth=2)
//plot(sd and dtime_h3 ? dtime_h3 : na, title="Daily H3",color=dcolor1, linewidth=3)
//plot(sd and dtime_h2 ? dtime_h2 : na, title="Daily H2",color=dcolor2, linewidth=2)
//plot(sd and dtime_h1 ? dtime_h1 : na, title="Daily H1",color=dcolor2, linewidth=2)
//plot(sd and dtime_l1 ? dtime_l1 : na, title="Daily L1",color=dcolor2, linewidth=2)
//plot(sd and dtime_l2 ? dtime_l2 : na, title="Daily L2",color=dcolor2, linewidth=2)
//plot(sd and dtime_l3 ? dtime_l3 : na, title="Daily L3",color=dcolor1, linewidth=3)
//plot(sd and dtime_l4 ? dtime_l4 : na, title="Daily L4",color=dcolor2, linewidth=2)
//plot(sd and dtime_l5 ? dtime_l5 : na, title="Daily L5",color=dcolor2, linewidth=2)
//plot(sd and dtime_l6 ? dtime_l6 : na, title="Daily L6",color=dcolor2, linewidth=2)

longCondition = close >dtime_h4 and open < dtime_h4 and EMA < close
if (longCondition)
    strategy.entry("Long", strategy.long)
    strategy.exit ("Exit Long","Long",  trail_points = 140,trail_offset = 1, loss =170)
    //trail_points = 40, trail_offset = 3, loss =70 and


shortCondition = close <dtime_l4 and open >dtime_l4 and EMA > close
if (shortCondition)
    strategy.entry("Short", strategy.short)
    strategy.exit ("Exit Short","Short", trail_points = 110,trail_offset = 1, loss =120)
Detail
https://www.fmz.com/strategy/430054
Last Modified
2023-10-24 16:18:30