
6.6 KiB
Name
基于价格波浪理论和平移平均线策略FX-Strategy-Based-on-Fractal-Waves-and-SMMA
Author
ChaoZhang
Strategy Description
 [trans]
概述
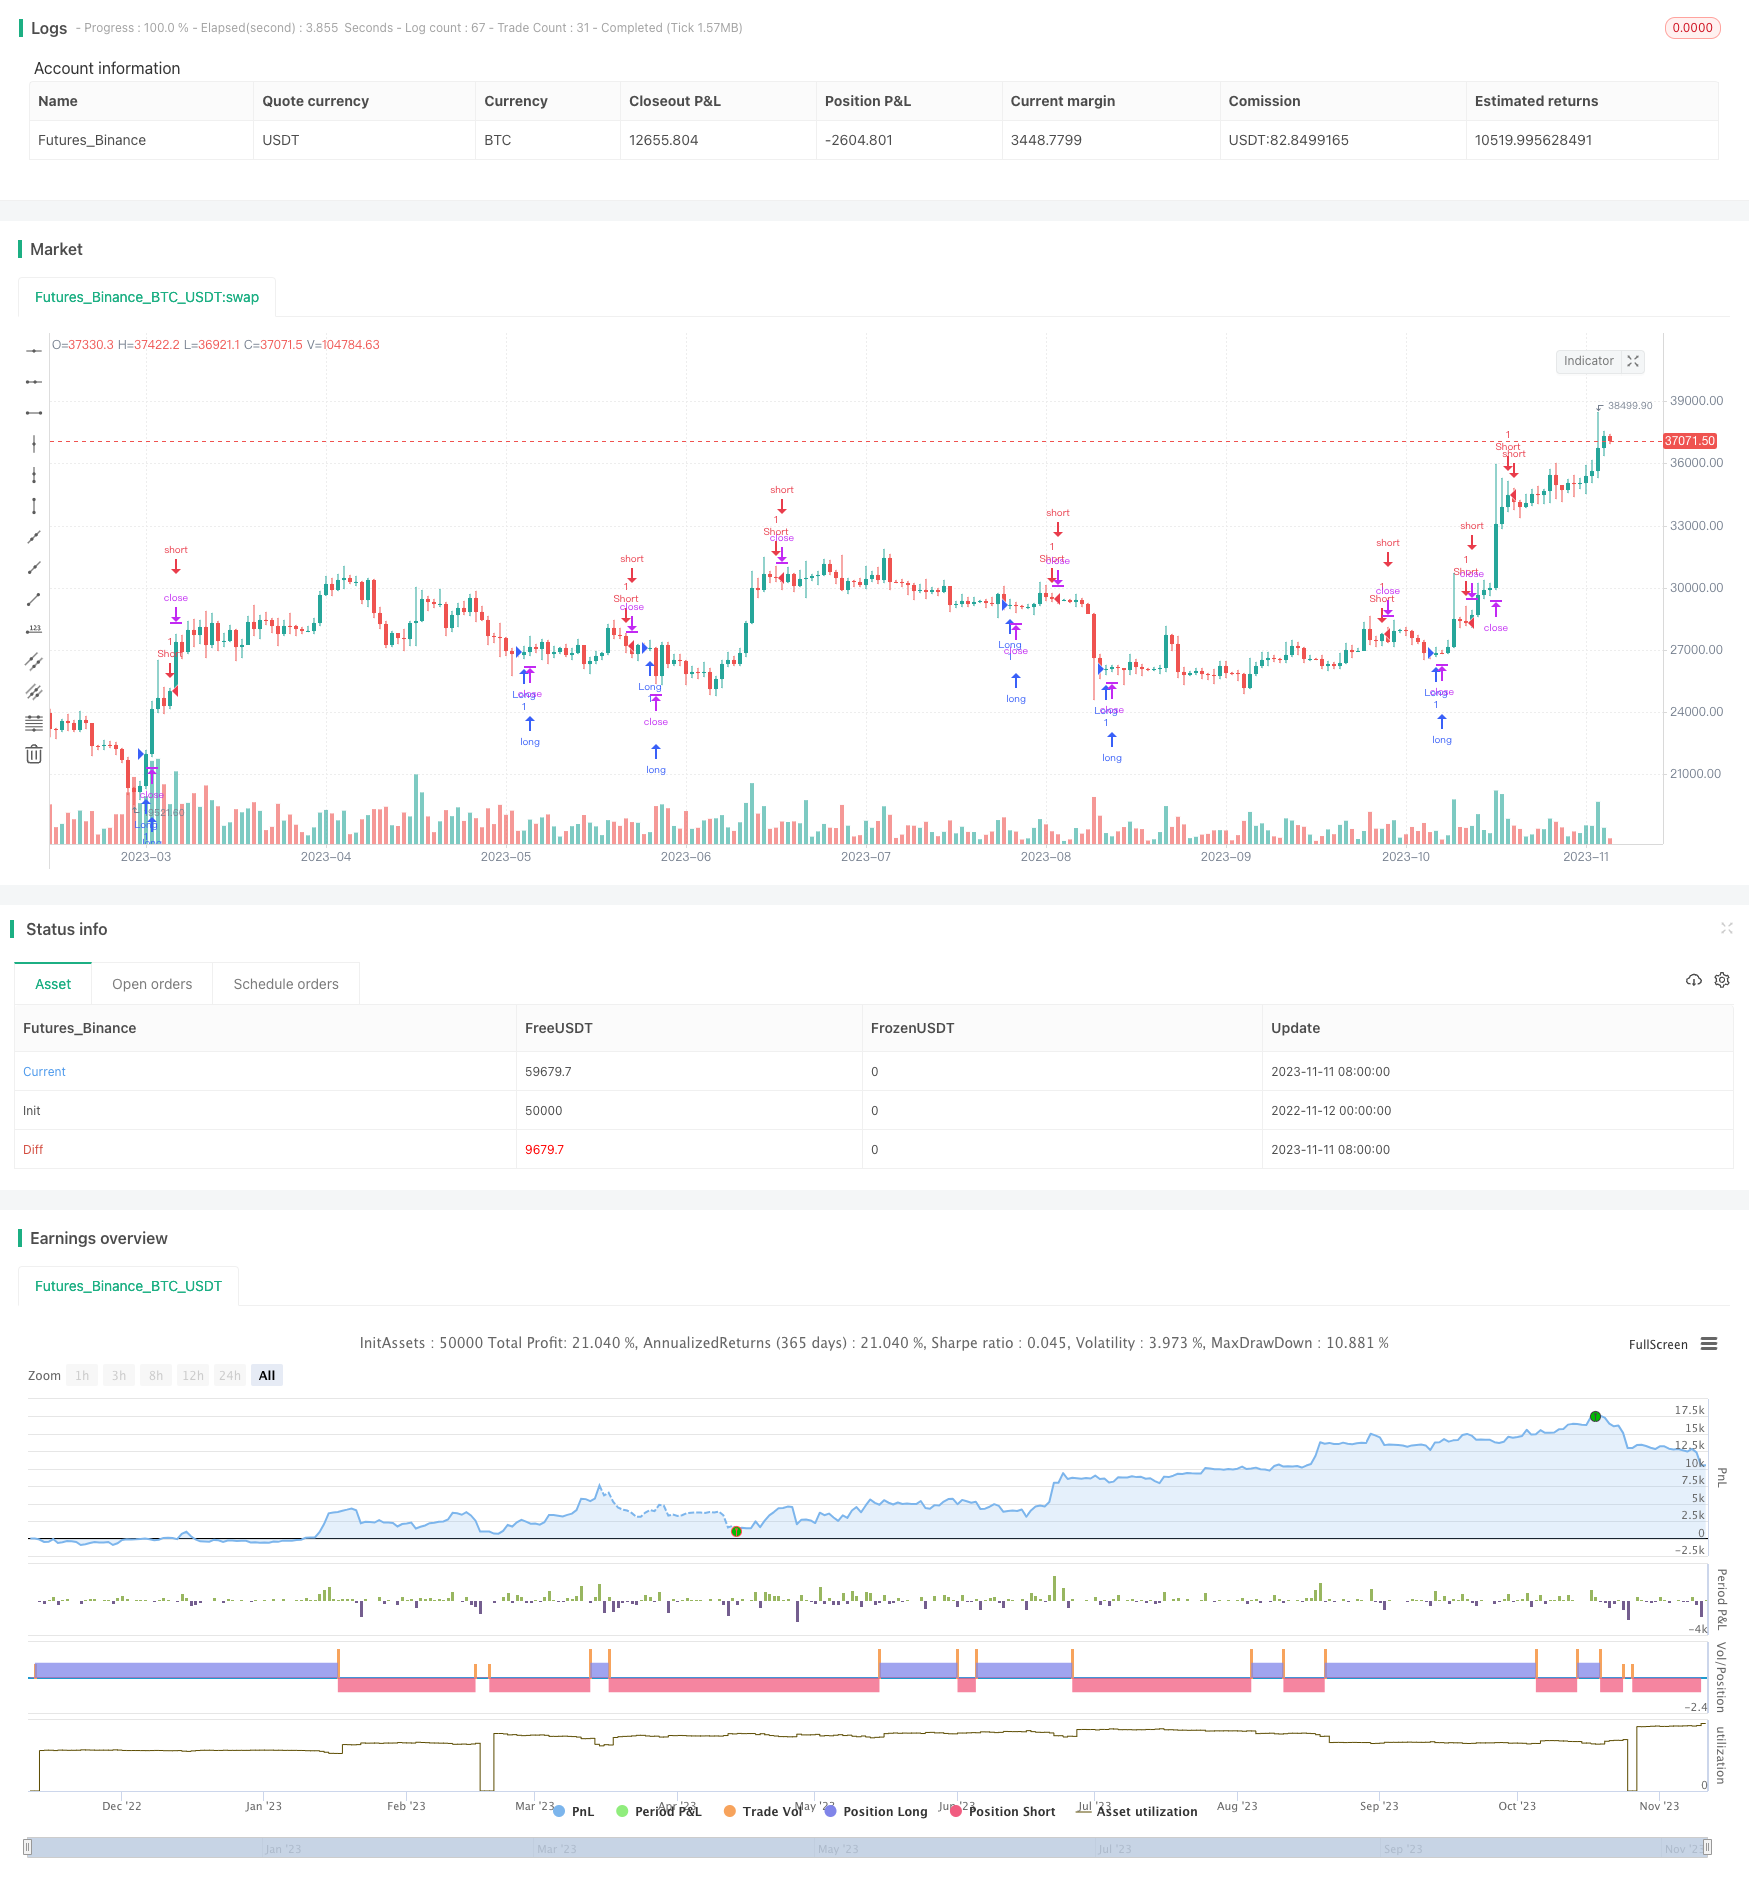
本策略运用价格波浪理论与平移平均线相结合,寻找趋势形成机会,设置合理止损与追踪止损来控制风险,以期获利最大化。策略仅在指定的交易时间段开仓,避免特定时间的市场波动。
策略原理
- 使用SMMA平移平均线计算价格平均值,滤波市场噪音,识别趋势方向
- 根据一定周期内的最高价与最低价判断价格波浪,识别趋势转折点
- 价格波浪上破平移平均线时看空,下破时看多
- 设置止损点与基于ATR的追踪止损来控制风险
- 仅在指定交易时间开仓,避免周末及日间特定时间段的市场波动
- 发出反向信号时平仓止盈
优势分析
- 利用价格波浪理论判断价格转折点,辅以平移平均线判断趋势方向,可以有效识别趋势
- 停损点设置与ATR动态追踪止损可以有效控制单笔止损
- 仅在具有流动性的交易时间开仓,可以避免不必要的滑点与特定时间段的剧烈波动
- 严格遵循抛物线止盈原则,在出现反向信号时止盈,可以最大程度获利
风险分析
- 价格波浪判断不准确时,可能在非趋势区域反复交易
- 平移平均线滞后性可能错过趋势反转点
- 止损点过小容易被止损,过大可能造成更大损失
- 固定止盈无法根据不同行情灵活调整
风险解决:
- 优化波浪周期参数,调整平移平均线参数
- 结合 Stochastics 指标等确定反转信号
- 动态优化止损点与止盈条件
优化方向
- 优化波浪周期参数,寻找最佳平移平均线周期
- 加入Stoch指标判断反转,set信号过滤假突破
- 尝试动态调整止损点与止盈位置
- 扩大止损点带宽,避免被套
- 根据不同品种、交易时段优化参数
总结
本策略整合价格波浪理论与平移平均线指标,在避开指定交易时间带后,通过判断价格波浪方向与趋势确认入场,设置止损与追踪止损来控制风险,在反向信号出现时止盈。策略可以通过参数优化与加入辅助指标进一步提高稳定性与收益率。
||
Overview
This strategy combines fractal wave theory and SMMA to identify trend opportunities, and uses proper stop loss and trailing stop to control risks for profit maximization. It only enters positions during specified trading sessions to avoid market swings at certain times.
Strategy Logic
- Use SMMA to calculate average price and filter market noise for trend direction
- Identify trend reversal points using highest/lowest price within certain periods as fractal waves
- Go short when price wave breaks above SMMA, go long when breaks below
- Set stop loss and trailing stop based on ATR to control risks
- Only trade within specified sessions, avoiding weekend and intraday swings
Advantage Analysis
- Fractal wave theory accurately identifies trend reversal points, combined with SMMA for trend direction
- Stop loss and ATR trailing stop effectively limits loss per trade
- Only trading during liquid sessions avoids excessive slippage and volatility
- Following parabolic SAR strictly to exit at reversal signal maximizes profit
Risk Analysis
- Inaccurate fractal wave may cause whipsaws in non-trending periods
- SMMA lag may miss ideal trend reversal points
- Stop loss too tight may get stopped out easily, too loose may incur larger loss
- Fixed profit taking unable to adjust to different market conditions
Solutions:
- Optimize parameters for fractal period and SMMA
- Add Stochastics to confirm reversal signals
- Dynamically optimize stop loss, profit target
Optimization Directions
- Optimize fractal period and SMMA parameters
- Add Stochastics indicator to filter false breakouts
- Experiment with dynamic stop loss and profit taking
- Widen stop loss to avoid getting stopped out
- Optimize parameters for different products and trading sessions
Summary
This strategy integrates fractal wave theory and SMMA to identify trend and reversal points to trade, with proper stop loss and profit taking. It can be further improved by optimizing parameters and adding confirming indicators for higher stability and profitability.
[/trans]
Strategy Arguments
| Argument | Default | Description |
|---|---|---|
| v_input_1 | 30 | SMMA Period |
| v_input_2 | 7 | Stop Loss % |
| v_input_3 | 2.7 | Trailing Stop Coefficient |
| v_input_4 | 5 | Fractal Period |
Source (PineScript)
/*backtest
start: 2022-11-12 00:00:00
end: 2023-11-12 00:00:00
period: 1d
basePeriod: 1h
exchanges: [{"eid":"Futures_Binance","currency":"BTC_USDT"}]
*/

//@version=4
strategy("FX Strategy Based on Fractals and SMMA", overlay=true)

// パラメータ
SMMAPeriod1 = input(30, title="SMMA Period")
StopLoss1 = input(7, title="Stop Loss %")
TrailingStopCoef1 = input(2.7, title="Trailing Stop Coefficient")
fractalPeriod = input(5, title="Fractal Period")

// SMMAの計算関数
smma(src, length) =>
    var float smma = na
    if na(smma[1])
        smma := sma(src, length)
    else
        smma := (smma[1] * (length - 1) + src) / length
    smma

// フラクタルの近似
highFractal = high[2] > high[1] and high[2] > high[3] and high[2] > high[4] and high[2] > high
lowFractal = low[2] < low[1] and low[2] < low[3] and low[2] < low[4] and low[2] < low

// エントリー条件
longEntrySignal = lowFractal and close[1] < smma(close, SMMAPeriod1)
shortEntrySignal = highFractal and close[1] > smma(close, SMMAPeriod1)

// エントリー実行
if (longEntrySignal)
    strategy.entry("Long", strategy.long)

if (shortEntrySignal)
    strategy.entry("Short", strategy.short)

// トレーリングストップの計算
atrValue = atr(10)
longStopPrice = close - atrValue * TrailingStopCoef1
shortStopPrice = close + atrValue * TrailingStopCoef1

// トレーリングストップの設定
strategy.exit("Exit Long", "Long", stop=longStopPrice)
strategy.exit("Exit Short", "Short", stop=shortStopPrice)

// バックテスト期間の設定(MetaTraderのバックテストと同じ期間)
startYear = 2007
startMonth = 05
startDay = 01
endYear = 2022
endMonth = 04
endDay = 01

startDate = timestamp(startYear, startMonth, startDay, 00, 00)
endDate = timestamp(endYear, endMonth, endDay, 23, 59)

// バックテスト期間内でのみトレードを実行
if (time >= startDate and time <= endDate)
    if (longEntrySignal)
        strategy.entry("Long", strategy.long)
    if (shortEntrySignal)
        strategy.entry("Short", strategy.short)
Detail
https://www.fmz.com/strategy/431956
Last Modified
2023-11-13 16:39:41