
10 KiB
Name
坐标滑动止损策略Coordinate-Sliding-Stop-Loss-Strategy
Author
ChaoZhang
Strategy Description
 [trans]
概述
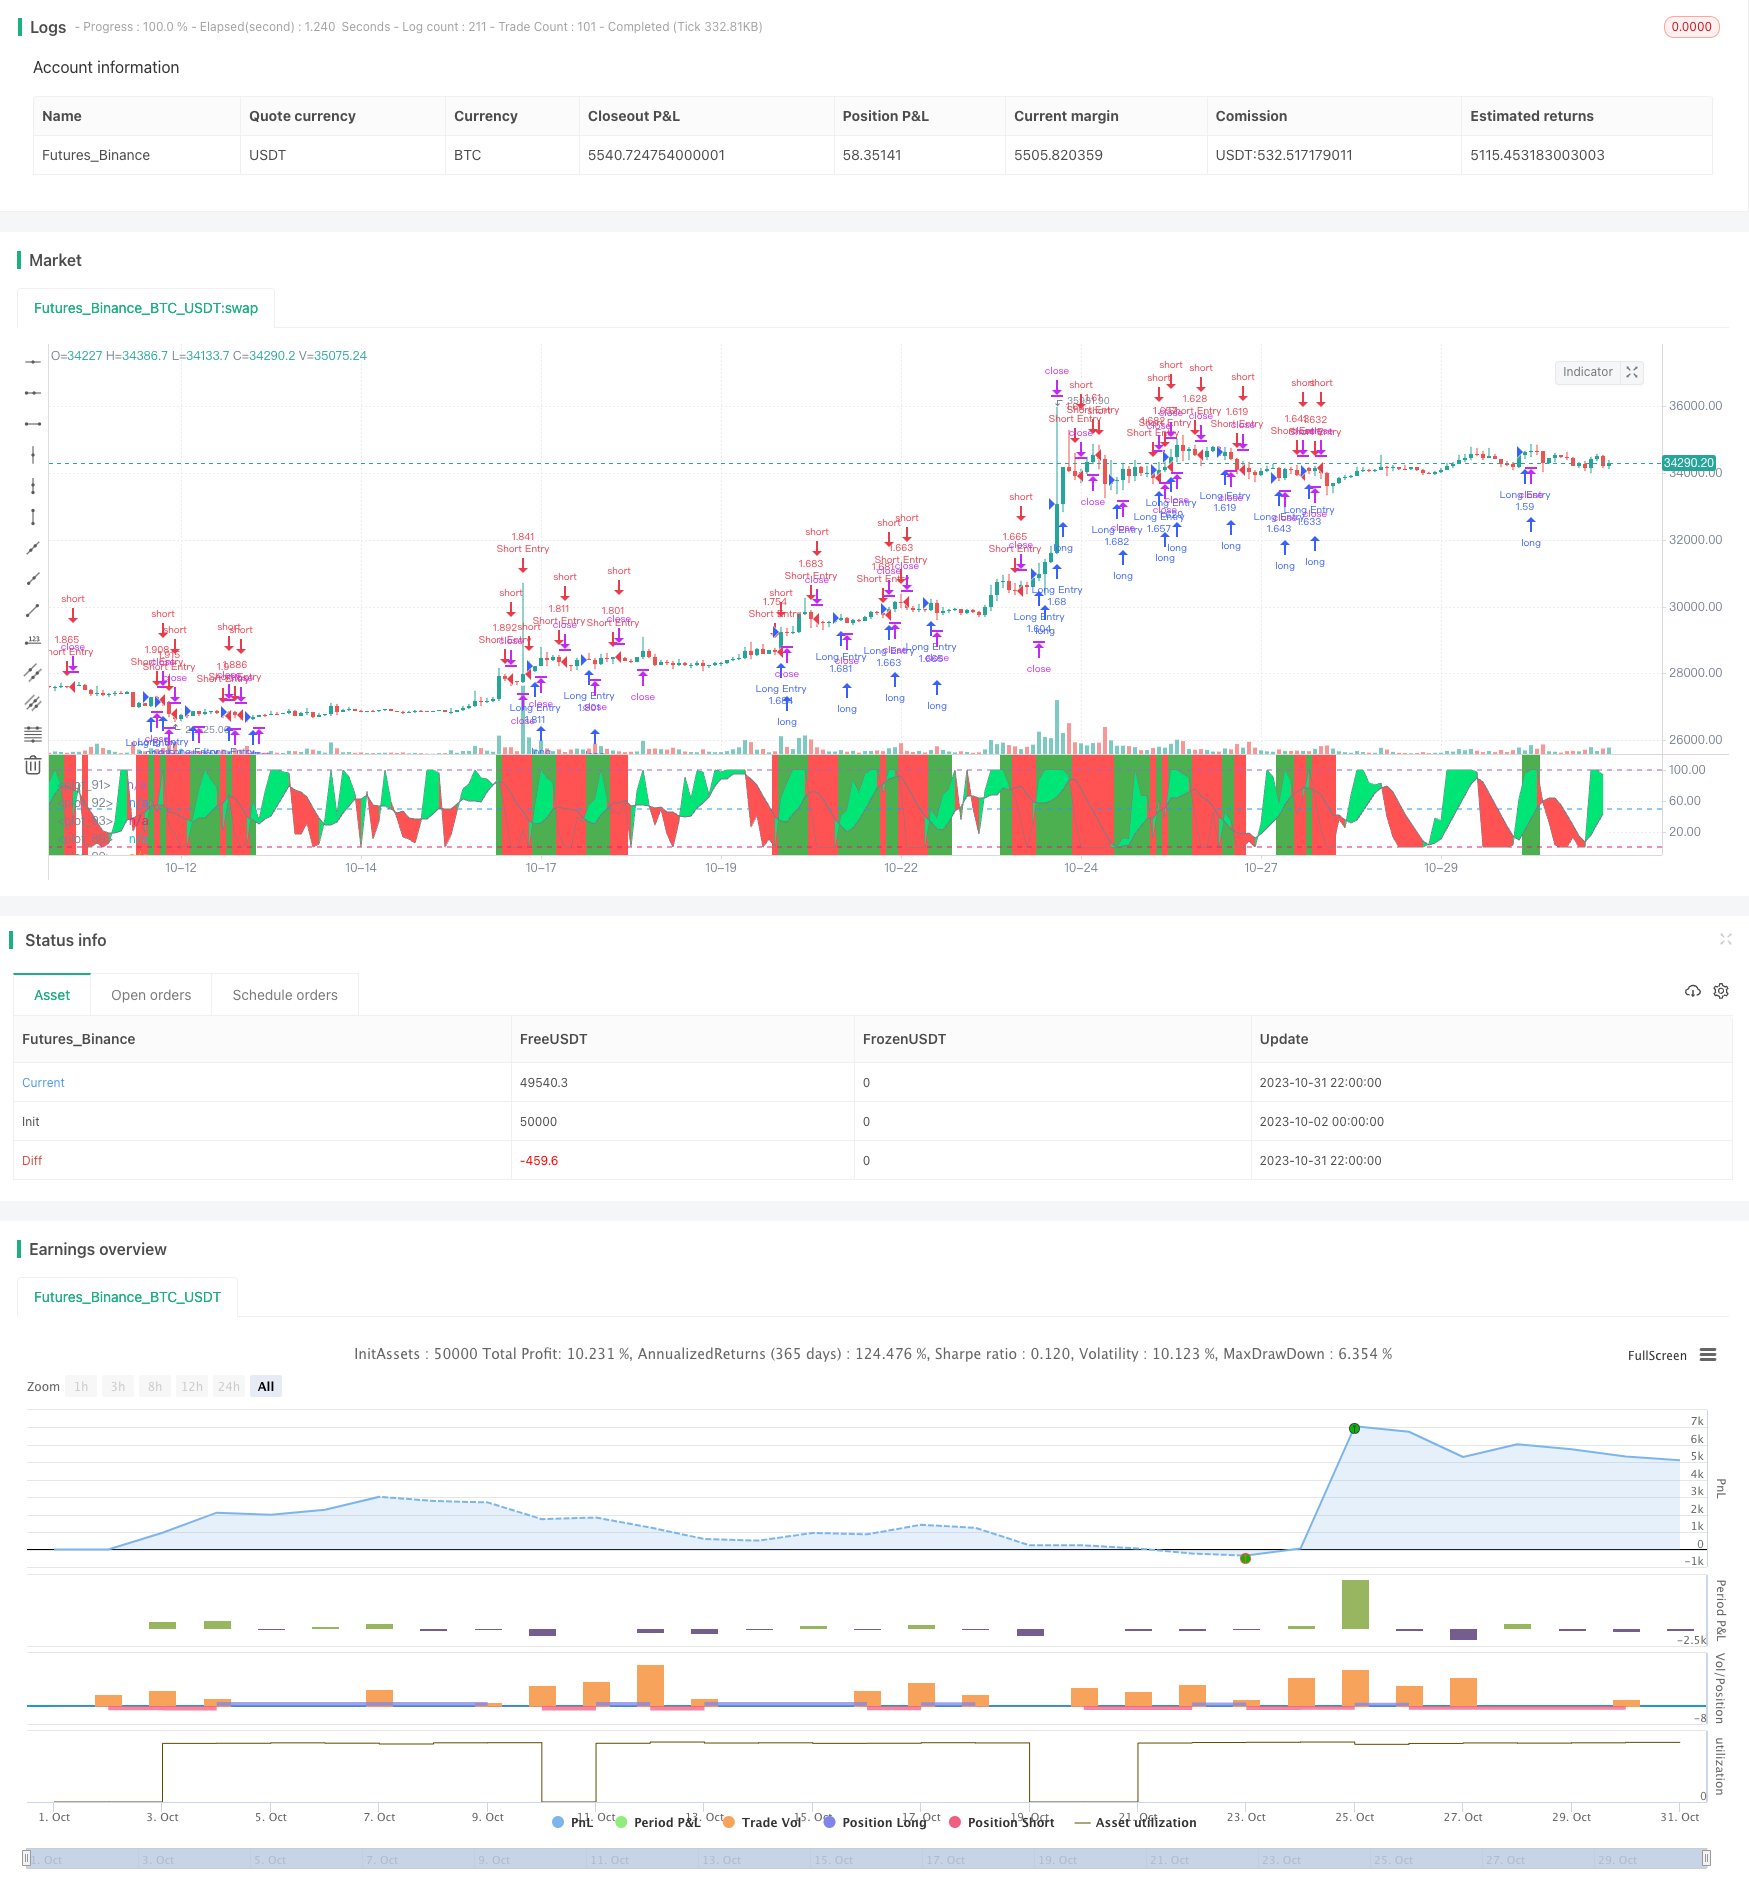
该策略使用Stochastic RSI和价格变动率指标,识别趋势方向进入多空单,并使用坐标滑动止损方法进行风险管理。
策略原理
首先,策略使用长度为5的RSI指标和长度为7的Stochastic指标计算Stochastic RSI。当Stochastic RSI的K值高于D值时为看涨信号,K值低于D值时为看跌信号。
其次,策略计算价格的变动率指标EMA ROC。当EMA ROC高于阈值的一半或低于阈值的负一半时,认为价格在活跃变动。
然后,结合Stochastic RSI的多空信号和价格变动率指标,可以识别趋势方向。当Stochastic RSI看涨且价格活跃变动时,做多;当Stochastic RSI看跌且价格活跃变动时,做空。
最后,该策略使用坐标滑动止损方式管理风险。在开仓后,继续刷新最高价或最低价,并以一定比例距离最高价或最低价作为止损位。
优势分析
该策略具有以下优势:
-
使用Stochastic RSI指标可以有效识别趋势和超买超卖情况。
-
价格变动率指标可以过滤掉震荡盘整的市场,避免假信号。
-
坐标滑动止损方式可以最大程度锁定盈利,同时也能控制风险。
-
策略参数优化空间大,可以针对不同品种进行调整。
-
策略思路简单清晰,容易理解实现。
风险分析
该策略也存在一些风险:
-
Stochastic RSI可能产生假信号,需要结合其他因素确认。
-
坐标滑动止损可能过于激进,被隔夜gaps击出。
-
短期内反转可能导致止损被触发。
-
策略参数需要针对不同品种进行优化,否则效果可能不佳。
-
交易成本会影响策略盈利能力,需要考虑合理的交易频率。
优化方向
该策略还可以从以下几个方面进行优化:
-
优化Stochastic RSI参数,降低假信号率。可以测试不同的K值和D值参数。
-
优化价格变动率指标参数,提高过滤效果。可以测试不同的窗口期和变动率阈值。
-
结合趋势判断指标,避免被反转止损。例如添加移动平均线等指标。
-
优化止损比例,降低被套风险。可以测试不同的止损幅度。
-
添加仓位数管理,控制单笔风险。例如固定止损金额,或根据账户余额动态调整仓位。
-
测试不同品种参数,提高适应性。优选在多市场多时间周期验证。
总结
该策略整体思路清晰简单,使用Stochastic RSI识别趋势方向,并配合价格变动率指标过滤信号,可以有效捕捉中长线趋势机会。坐标滑动止损方式可以锁定盈利同时控制风险。通过进一步优化,该策略可以成为一个非常实用的趋势跟踪策略。
||
Overview
This strategy uses Stochastic RSI and price rate of change indicator to identify trend direction for entry, and coordinate sliding stop loss for risk management.
Strategy Logic
Firstly, the strategy calculates Stochastic RSI using RSI indicator with length 5 and Stochastic indicator with length 7. When Stochastic RSI K value is above D value, it is bullish signal. When K is below D, it is bearish signal.
Secondly, the strategy calculates price rate of change indicator EMA ROC. When EMA ROC is above the threshold half or below negative half of threshold, it identifies active price movement.
Then, combining Stochastic RSI signals and price rate of change, it identifies trend direction. When Stochastic RSI is bullish and price actively moving, go long. When Stochastic RSI bearish and price actively moving, go short.
Finally, the strategy uses coordinate sliding stop loss for risk management. After opening position, it continues to refresh highest/lowest price, and uses certain percentage distance from highest/lowest price as stop loss level.
Advantage Analysis
The advantages of this strategy:
-
Stochastic RSI indicator effectively identifies trends and overbought/oversold situations.
-
Price rate of change filters out range-bound market to avoid false signals.
-
Coordinate sliding stop loss can lock in profits to the largest extent while controlling risk.
-
The strategy has big optimization space for parameters tuning based on different products.
-
The strategy logic is simple and clear, easy to understand and implement.
Risk Analysis
The risks of this strategy:
-
Stochastic RSI may generate false signals, needs confirmation with other factors.
-
Coordinate sliding stop loss may be too aggressive, could be stopped out by gaps overnight.
-
Short term reversal may trigger stop loss.
-
Parameters need optimization for different products, otherwise performance may be poor.
-
Trading cost impacts the strategy profitability, reasonable trading frequency needed.
Optimization Directions
The strategy can be further optimized in the following aspects:
-
Optimize Stochastic RSI parameters to reduce false signals. Can test different K and D values.
-
Optimize price rate of change parameters to improve filtering effect. Can test different length and threshold values.
-
Add trend indicator to avoid being stopped out by reversals. Such as moving averages.
-
Optimize stop loss percentage to reduce risk of being trapped. Can test different stop loss width.
-
Add position sizing management to control single trade risk. Such as fixed stop loss amount, or dynamically adjust position size based on account equity.
-
Test parameters on different products to improve adaptiveness. Verify on multiple markets and timeframes.
Summary
In summary, this strategy has clear and simple logic, identifies trend direction with Stochastic RSI and filters signals with price rate of change, which can effectively capture mid-long term trends. Coordinate sliding stop loss locks in profits and controls risk. With further optimization, this strategy can become a very practical trend following strategy.
[/trans]
Strategy Arguments
| Argument | Default | Description |
|---|---|---|
| v_input_1 | 2017 | Backtest Start Year |
| v_input_2 | true | Backtest Start Month |
| v_input_3 | true | Backtest Start Day |
| v_input_4 | 2019 | Backtest Stop Year |
| v_input_5 | 12 | Backtest Stop Month |
| v_input_6 | 31 | Backtest Stop Day |
| v_input_7 | true | smoothK |
| v_input_8 | 7 | smoothD |
| v_input_9 | 5 | lengthRSI |
| v_input_10 | 7 | lengthStoch |
| v_input_11_close | 0 | RSI Source: close |
| v_input_12 | 14 | roclength |
| v_input_13 | 2 | pcntChange |
| v_input_14 | 2 | Stop Loss % |
| v_input_15 | 9 | Take Profit % |
Source (PineScript)
/*backtest
start: 2023-10-02 00:00:00
end: 2023-11-01 00:00:00
period: 2h
basePeriod: 15m
exchanges: [{"eid":"Futures_Binance","currency":"BTC_USDT"}]
*/

//@version=4
strategy("Sto2", overlay=false, initial_capital=10000, default_qty_type=strategy.percent_of_equity, default_qty_value=100, commission_type=strategy.commission.percent, commission_value=0.0)

/////////////// Time Frame ///////////////
testStartYear = input(2017, "Backtest Start Year")
testStartMonth = input(1, "Backtest Start Month")
testStartDay = input(1, "Backtest Start Day")
testPeriodStart = timestamp(testStartYear,testStartMonth,testStartDay, 0, 0)

testStopYear = input(2019, "Backtest Stop Year")
testStopMonth = input(12, "Backtest Stop Month")
testStopDay = input(31, "Backtest Stop Day")
testPeriodStop = timestamp(testStopYear,testStopMonth,testStopDay, 0, 0)

testPeriod() => true

///////////// Stochastic calc /////////////
smoothK = input(1, minval=1)
smoothD = input(7, minval=1)
lengthRSI = input(5, minval=1)
lengthStoch = input(7, minval=1)
src = input(close, title="RSI Source")

up = sma(max(change(src), 0), lengthRSI)
down = sma(-min(change(src), 0), lengthRSI)
rsi1 = down == 0 ? 100 : up == 0 ? 0 : 100 - (100 / (1 + up / down))

k = sma(stoch(rsi1, rsi1, rsi1, lengthStoch), smoothK)
d = sma(k, smoothD)

///////////// Rate Of Change /////////////
source = close, roclength = input(14, minval=1), pcntChange = input(2, minval=1)
roc = 100 * (source - source[roclength]) / source[roclength]
emaroc = ema(roc, roclength / 2)
isMoving() => emaroc > (pcntChange / 2) or emaroc < (0 - (pcntChange / 2))

/////////////// STRATEGY ///////////////
long = k > d and isMoving()
short = k < d and isMoving()

last_long = 0.0
last_short = 0.0
last_long := long ? time : nz(last_long[1])
last_short := short ? time : nz(last_short[1])

long_signal = crossover(last_long, last_short)
short_signal = crossover(last_short, last_long)

last_open_long_signal = 0.0
last_open_short_signal = 0.0
last_open_long_signal := long_signal ? open : nz(last_open_long_signal[1])
last_open_short_signal := short_signal ? open : nz(last_open_short_signal[1])

last_long_signal = 0.0
last_short_signal = 0.0
last_long_signal := long_signal ? time : nz(last_long_signal[1])
last_short_signal := short_signal ? time : nz(last_short_signal[1])

in_long_signal = last_long_signal > last_short_signal
in_short_signal = last_short_signal > last_long_signal

last_high = 0.0
last_low = 0.0
last_high := not in_long_signal ? na : in_long_signal and (na(last_high[1]) or high > nz(last_high[1])) ? high : nz(last_high[1])
last_low := not in_short_signal ? na : in_short_signal and (na(last_low[1]) or low < nz(last_low[1])) ? low : nz(last_low[1])
sl_inp = input(2.0, title='Stop Loss %') / 100
tp_inp = input(9.0, title='Take Profit %') / 100

take_level_l = strategy.position_avg_price * (1 + tp_inp)
take_level_s = strategy.position_avg_price * (1 - tp_inp)

since_longEntry = barssince(last_open_long_signal != last_open_long_signal[1]) // LONG SL
since_shortEntry = barssince(last_open_short_signal != last_open_short_signal[1]) // SHORT SL

slLong = in_long_signal ? strategy.position_avg_price * (1 - sl_inp) : na
slShort = strategy.position_avg_price * (1 + sl_inp)
long_sl = in_long_signal ? slLong : na
short_sl = in_short_signal ? slShort : na

// Strategy
if testPeriod()
    strategy.entry("Long Entry",  strategy.long, when=long)
    strategy.entry("Short Entry", strategy.short, when=short)
    strategy.exit("Long Ex", "Long Entry", stop=long_sl, limit=take_level_l, when=since_longEntry > 0)
    strategy.exit("Short Ex", "Short Entry", stop=short_sl, limit=take_level_s, when=since_shortEntry > 0)

///////////// Plotting /////////////
bgcolor(isMoving() ? long ? color.green : short ? color.red : na : color.white, transp=80)
p1 = plot(k, color=color.gray, linewidth=0)
p2 = plot(d, color=color.gray, linewidth=0)
h0 = hline(100)
h1 = hline(50)
h3 = hline(0)
fill(p1, p2, color = k > d ? color.lime : color.red, transp=70)
Detail
https://www.fmz.com/strategy/430880
Last Modified
2023-11-02 16:28:55