
21 KiB
Name
均线穿越策略Trend-Following-Strategy-Based-on-Moving-Average-Crossover
Author
ChaoZhang
Strategy Description
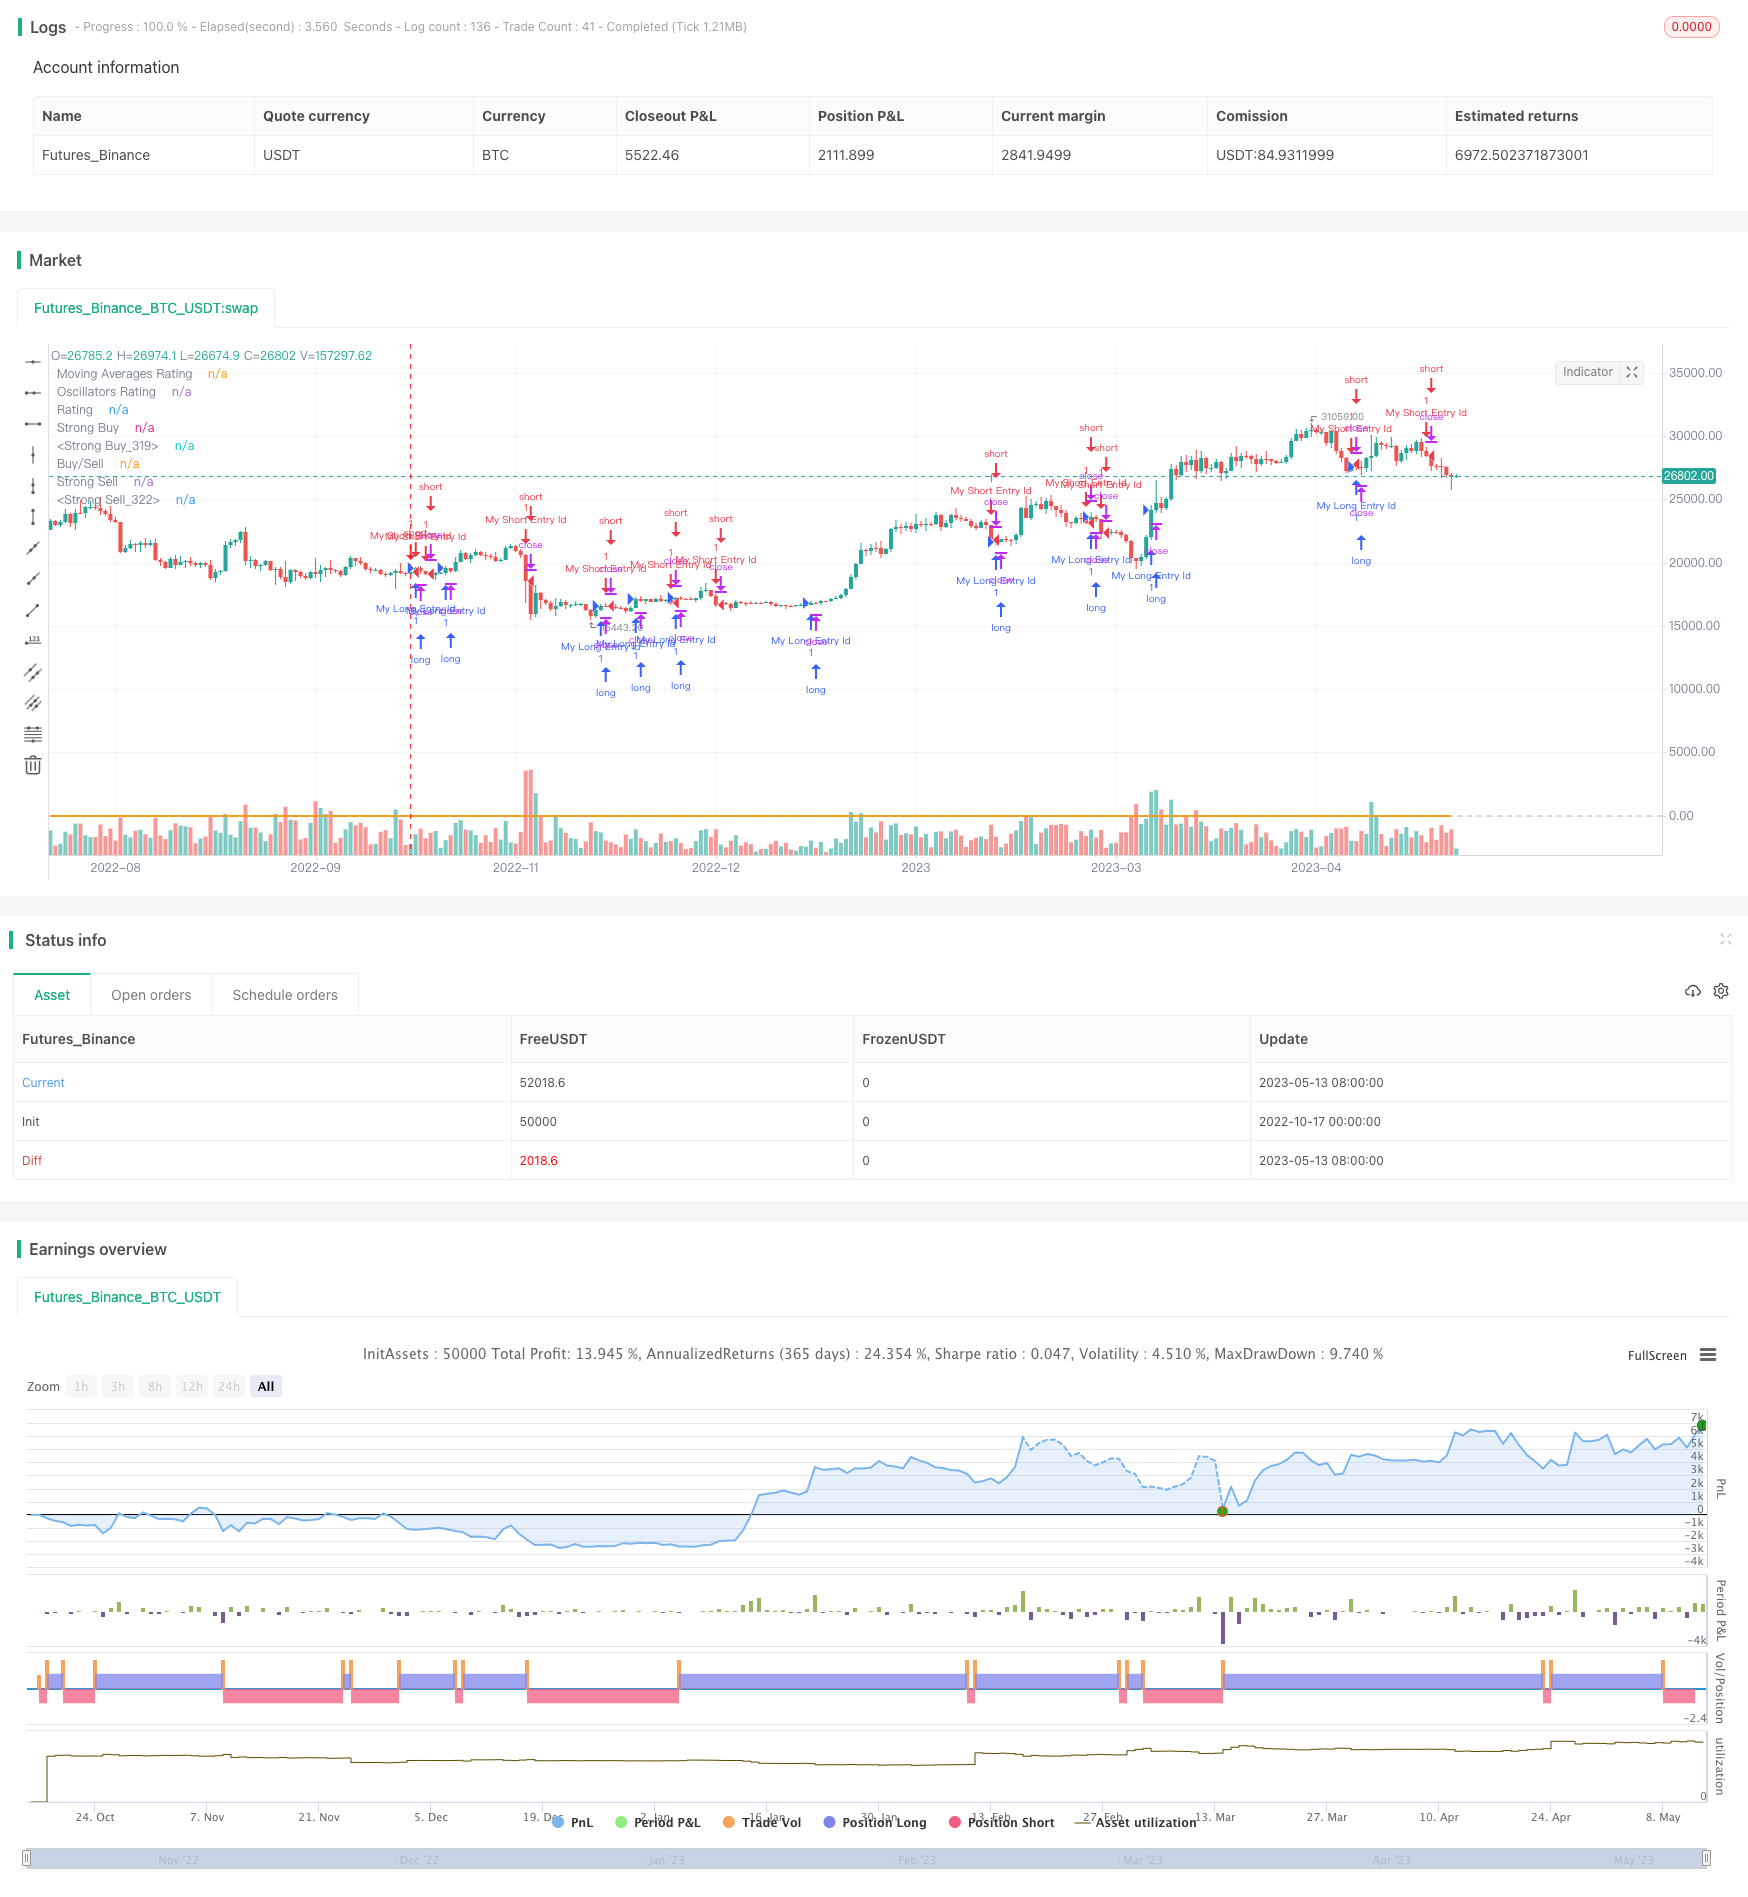
[trans]
概述
该策略运用移动平均线、震荡指标等多种技术指标,结合均线穿越形态,识别股票价格趋势和涨跌转折点,进行买入卖出操作。
原理
该策略主要分为以下几部分:
-
选择区间:设置K线图的时间区间分钟数,如1分钟、5分钟等。
-
选择移动平均线:配置常用的EMA、SMA等移动平均线的参数,如10日线、20日线等。
-
选择震荡指标:配置RSI、MACD、威廉指标等震荡指标的参数。
-
计算买入卖出信号:通过自定义的函数,计算移动平均线和震荡指标的数值。当短期均线上穿长期均线时产生买入信号;短期均线下穿长期均线时产生卖出信号。同时结合超买超卖指标识别极端点。
-
评级系统:将各个指标的买入卖出信号进行数值化打分,然后取平均,得到整体的评级指数。评级指数大于0为买入信号,小于0为卖出信号。
-
交易信号:根据评级指数大于或小于0生成最终的交易信号,进行买入或卖出操作。
该策略运用了多种指标进行组合,能够有效识别价格趋势和转折点,增强信号的可靠性。均线穿越是行之有效的趋势技术信号,结合震荡指标有助于避免假突破。评级系统也使得交易信号更加明确。
优势
- 结合均线穿越和多种震荡指标,交易信号更加可靠,避免假信号
- 评级系统使买入卖出信号更加明确
- 运用自定义函数进行模块化编程,代码结构清晰
- 采用多种时间周期进行组合分析,提高准确性
- 优化了参数设置,如RSI长度、MACD快慢均线周期等
- 通过参数可自定义配置指标和均线参数,提高了灵活性
存在的风险
- 大盘趋势下个股表现存在差异
- 交易频率可能较高,增加交易成本和滑点风险
- 需要反复测试优化参数,以适应不同股票特性
- 存在一定的回撤和亏损风险
可以通过以下方法降低上述风险:
- 结合大盘走势进行选股
- 适当调整持仓时间,降低交易频率
- 优化参数设置,使之更符合个股特点
- 采用止损策略,控制亏损
优化方向
该策略可以从以下几个方面进行进一步优化:
- 增加更多指标,如波动率指标,强化信号
- 结合机器学习方法自动优化参数
- 增加个股和行业选择模块
- 结合量化选股方法
- 采用自适应止损、尾随止损等方法
- 考虑大盘状况,避开不确定环境
- 分析实盘交易结果,调整评分权重
综上所述,该策略整合均线突破和多种指标,能有效识别价格走势。但需不断测试优化,控制风险。未来可从组合选股、参数优化、止损方面进行改进。
总结
该策略以均线穿越为主要交易信号,辅以多种震荡指标确认,采用评分系统产生明确的买入卖出信号。能够有效识别价格趋势和转折点,但需要控制交易频率,降低交易成本和风险,同时还需持续优化参数。具有一定的实用价值和改进空间。
||
Overview
This strategy employs multiple technical indicators including moving averages and oscillators to identify price trends and reversal points for buy and sell signals.
Principles
The strategy consists of the following main components:
-
Timeframe Selection: Select the timeframe such as 1-min, 5-min etc for the candlestick chart.
-
Moving Average Selection: Configure parameters for commonly used moving averages like 10-day MA, 20-day MA etc.
-
Oscillator Selection: Configure parameters for oscillators like RSI, MACD, Williams %R etc.
-
Buy/Sell Signal Calculation: Custom functions are used to calculate values of moving averages and oscillators. Golden cross (shorter MA crossing above longer MA) generates buy signal while death cross (shorter MA crossing below longer MA) generates sell signal. Oscillators help identify overbought/oversold conditions.
-
Rating System: Each indicator generates a numerical score for buy/sell signal and a final rating index is calculated by taking average. Rating above 0 gives buy signal while rating below 0 gives sell signal.
-
Trade Signals: Final trade signals for long/short are generated based on the rating index being above or below 0.
The strategy combines multiple indicators to improve reliability of signals and identify trend reversals more accurately. Moving average crossover is an effective trend following technique and oscillators help avoid false signals. The rating system also provides clear buy/sell signals.
Advantages
-
Combines moving average crossover and multiple oscillators for more reliable signals and avoid false signals
-
Rating system provides clear buy/sell signals
-
Modular programming with custom functions improves code structure
-
Analyzes multiple timeframes for better accuracy
-
Optimized parameters like RSI length, MACD periods etc.
-
Customizable parameters provide flexibility to adjust indicators
Risks Involved
-
Individual stocks performance may diverge from broad market trend
-
High trading frequency increases costs and slippage risks
-
Parameters need continuous testing and optimization for different stock characteristics
-
Involves drawdowns and loss risks
Risks can be reduced through:
-
Stock selection based on market conditions
-
Adjusting holding period to lower trading frequency
-
Optimizing parameters based on stock specifics
-
Using stop loss to control losses
Enhancement Opportunities
The strategy can be further improved in the following ways:
-
Adding more indicators like volatility indices to strengthen signals
-
Automated parameter optimization using machine learning
-
Incorporating stock/sector selection filters
-
Combining with quantitative stock selection
-
Using adaptive stop loss, trailing stop loss etc.
-
Considering overall market conditions to avoid uncertainty
-
Adjusting rating weights based on real trading outcomes
In summary, the strategy integrates moving average crossover and multiple oscillators to effectively identify trends. But constant testing and risk control is required. Future enhancements can focus on portfolio selection, parameter optimization, stop loss etc.
Conclusion
The strategy uses moving average crossover as the primary signal along with oscillator confirmation, and generates clear buy/sell signals through the rating system. It can effectively identify trends and reversals but requires controlling trading frequency and risks. There is scope for continuous parameter optimization. The strategy has practical value and room for improvements.
[/trans]
Strategy Arguments
| Argument | Default | Description |
|---|---|---|
| v_input_1 | 0 | Resolution (minutes): 240 |
| v_input_2 | 14 | RSI Length |
| v_input_3 | 14 | STOCH K |
| v_input_4 | 3 | STOCH D |
| v_input_5 | 3 | STOCH Smooth |
| v_input_6 | 20 | CCI Length |
| v_input_7 | 10 | Momentum Length |
| v_input_8 | 12 | MACD fast |
| v_input_9 | 27 | MACD slow |
| v_input_10 | 14 | ADX Smoothing |
| v_input_11 | 14 | DI Length |
| v_input_12 | 13 | BBP EMA Length |
| v_input_13 | 14 | William Perc Range Length |
| v_input_14 | 7 | UO Length 7 |
| v_input_15 | 14 | UO Length 14 |
| v_input_16 | 28 | UO Length 28 |
Source (PineScript)
/*backtest
start: 2022-10-17 00:00:00
end: 2023-05-14 00:00:00
period: 1d
basePeriod: 1h
exchanges: [{"eid":"Futures_Binance","currency":"BTC_USDT"}]
*/

//@version=4
strategy("TV Signal", overlay=true, initial_capital = 500, currency = "USD")

// -------------------------------------- GLOBAL SELECTION --------------------------------------------- //
//res  = input(defval="5"  , title="resolution " , type=resolution)
res_num  = input("240", title="Resolution (minutes)", options=["1", "5", "15", "60", "240"] )
res = res_num
src  = close

// -----------------------------------MOVING AVERAGES SELECTION----------------------------------------- //
// EMAS input
ema10                 = 10
ema20                 = 20
ema30                 = 30
ema50                 = 50
ema100                = 100
ema200                = 200
// SMAS input
sma10                 = 10
sma20                 = 20
sma30                 = 30
sma50                 = 50
sma100                = 100
sma200                = 200
// Ichimoku - is not active in the calculation brought to you by TV TEAM for the lolz
// VWMA
vwma20                = 20
// Hull
hma9                  = 9

// -----------------------------------OSCILLATORS SELECTION----------------------------------------- //
//RSI
rsi_len         = input(14, minval=1, title="RSI Length")
//STOCH K
stoch_k         = input(14, minval=1, title="STOCH K")
stoch_d         = input(3,  minval=1, title="STOCH D")
stoch_smooth    = input(3,  minval=1, title="STOCH Smooth")
//CCI
cci_len         = input(20, minval=1, title="CCI Length")
//Momentum
momentum_len = input(10, minval=1, title="Momentum Length")
//MACD
macd_fast           = input(12,  title="MACD fast")
macd_slow           = input(27,  title="MACD slow")
//ADX
adxlen = input(14, title="ADX Smoothing")
dilen  = input(14, title="DI Length")
//BBP
bbp_len           = input(13,  title="BBP EMA Length")
//William Percentage Range
wpr_length = input(14, minval=1,  title="William Perc Range Length")
//Ultimate Oscillator
uo_length7 = input(7, minval=1, title="UO Length 7"), uo_length14 = input(14, minval=1, title="UO Length 14"), uo_length28 = input(28, minval=1, title="UO Length 28")

// -------------------------------------- FUNCTIONS - Moving Averages -------------------------------------- //
// Simple Moving Averages Calculation Function - SELL indicator values < price // BUY – indicator values > price
calc_sma_index(len, src, res) =>
    sma_val = request.security(syminfo.tickerid, res, sma(src, len))
    sma_index  = if( sma_val > close )
        -1
    else
        1
    sma_index
// Exponential Moving Averages Calculation Function - SELL indicator values < price // BUY – indicator values > price
calc_ema_index(len, src, res) =>
    ema_val = request.security(syminfo.tickerid, res, sma(src, len))
    ema_index  = if( ema_val > close )
        -1
    else
        1
    ema_index
// Hull Moving Averages Calculation Function - SELL indicator values < price // BUY – indicator values > price
calc_hull_index(len, src, res) =>
    hull_val = request.security(syminfo.tickerid, res, wma(2*wma(src, len/2)-wma(src, len), round(sqrt(len))))
    hull_index  = if( hull_val > close )
        -1
    else
        1
    hull_index
// VW Moving Averages Calculation Function - SELL indicator values < price // BUY – indicator values > price
calc_vwma_index(len, src, res) =>
    vwma_val = request.security(syminfo.tickerid, res, vwma(src, len))
    vwma_index  = if( vwma_val > close )
        -1
    else
        1
    vwma_index
// -------------------------------------- FUNCTIONS - Oscillators -------------------------------------- //
// RSI indicator < lines that represent oversold conditions(70) and indicator values are rising    = -1
// RSI indicator > lines that represent overbought conditions(30) and indicator values are falling = +1
calc_rsi_index(len, src, res) =>
    up         = rma(max(change(src), 0), len)
    down       = rma(-min(change(src), 0), len)
    rsi        = down == 0 ? 100 : up == 0 ? 0 : 100 - (100 / (1 + up / down))
    rsi_res    = request.security(syminfo.tickerid, res, rsi)
    rsi_change = rsi_res - rsi_res[1]
    rsi_index  = 0
    if( rsi_res > 70 and rsi_change < 0 )
        rsi_index := -1
    if( rsi_res < 30 and rsi_change > 0  )
        rsi_index := 1
    rsi_index

// STOCH indicator – main line < lower band (20) and main line crosses the signal line from bottom-up
// STOCH indicato  – main line > upper band (80) and main line crosses the signal line from above-down
calc_stoch_index(len_k, len_d, smoothK, res) =>
    stoch_k     = sma(stoch(close, high, low, len_k), smoothK)
    stoch_d     = sma(stoch_k, len_d)
    res_stoch_k = request.security(syminfo.tickerid, res, stoch_k)
    res_stoch_d = request.security(syminfo.tickerid, res, stoch_d)
    spread      = (res_stoch_k/res_stoch_d -1)*100
    stoch_index = 0
    if( res_stoch_k > 80 and spread < 0 )
        stoch_index := -1
    if( res_stoch_k < 20 and spread > 0  )
        stoch_index := 1
    stoch_index

// CCI indicator – indicator < oversold level (-100) and reversed upwards
// CCI indicator – indicator > overbought level (100) and reversed downwards
calc_cci_index(len, src, res) =>
    cci_ma     = sma(src, len)
    cci        = (src - cci_ma) / (0.015 * dev(src, len))
    cci_res    = request.security(syminfo.tickerid, res, cci)
    cci_change = cci_res - cci_res[1]
    cci_index  = 0
    if( cci_res > 100 and cci_change > 0 )
        cci_index := -1
    if( cci_res < -100 and cci_change < 0  )
        cci_index := 1
    cci_index

//AWESOME OSCILLATOR – saucer and values are greater than 0 or zero line cross from bottom-up - BUY
//AWESOME OSCILLATOR – saucer and values are lower than 0 or zero line cross from above-down  - SELL
calc_awesome_index(src, res) =>
    ao        = sma(hl2,5) - sma(hl2,34)
    ao_res    = request.security(syminfo.tickerid, res, ao)
    ao_change = ao_res - ao_res[1]
    ao_index  = 0
    if( ao_res > 0 and ao_change > 0 )
        ao_index := 1
    if( ao_res < 0 and ao_change < 0 )
        ao_index := -1
    ao_index

// Momentum indicator - indicator values are rising  - BUY
// Momentum indicator - indicator values are falling - SELL
calc_momentum_index(len, src, res) =>
    mom       = src - src[len]
    res_mom   = request.security(syminfo.tickerid, res, mom)
    mom_index = 0
    if res_mom>= 0
        mom_index := 1
    if res_mom <= 0
        mom_index := -1
    mom_index

// MACD - main line values > signal line values  - BUY
// MACD - main line values < signal line values - SELL
calc_macd_index(macd_fast, macd_slow, src, res) =>
    macd       = ema(src, macd_fast) - ema(src, macd_slow)
    res_macd   = request.security(syminfo.tickerid, res, macd)
    macd_index = 0
    if res_macd>= 0
        macd_index := 1
    if res_macd <= 0
        macd_index := -1
    macd_index

//STOCHRSI - main line < lower band (20) and main line crosses the signal line from bottom-up
//STOCHRSI - main line > upper band (80) and main line crosses the signal line from above-down
calc_stochrsi_index(len_rsi, len_stoch, smoothK, smoothD, src, res) =>
    rsi     = rsi(src, len_rsi)
    stoch_k = sma(stoch(rsi, rsi, rsi, len_stoch), smoothK)
    stoch_d = sma(stoch_k, smoothD)
    res_stoch_k = request.security(syminfo.tickerid, res, stoch_k)
    res_stoch_d = request.security(syminfo.tickerid, res, stoch_d)
    spread  = (res_stoch_k/res_stoch_d -1)*100
    stochrsi_index = 0
    if( res_stoch_k > 80 and spread < 0 )
        stochrsi_index := -1
    if( res_stoch_k < 20 and spread > 0  )
        stochrsi_index := 1
    stochrsi_index

//Williams % Range  - line is above -20 and values are dropping - Overbough conditions - SELL
//Williams % Range  - line is below -80 and values are rising   - Oversold conditions  - BUY
calc_wpr_index(len, src, res) =>
    wpr_upper = highest(len)
    wpr_lower = lowest(len)
    wpr = 100 * (src - wpr_upper) / (wpr_upper - wpr_lower)
    wpr_res = request.security(syminfo.tickerid, res, wpr)
    wpr_change = wpr_res - wpr_res[1]
    wpr_index = 0
    if( wpr_res < -80 and wpr_change > 0 )
        wpr_index := 1
    if( wpr_res > -20 and wpr_change < 0 )
        wpr_index := -1
    wpr_index

//Ultimate Oscillator - line is above -20 and values are dropping - Overbough conditions - SELL
//Ultimate Oscillator - line is below -80 and values are rising   - Oversold conditions  - BUY
average(bp, tr_, length) => sum(bp, length) / sum(tr_, length)

calc_uo_index(len7, len14, len28, res) =>
    high_ = max(high, close[1])
    low_ = min(low, close[1])
    bp = close - low_
    tr_ = high_ - low_
    avg7 = average(bp, tr_, len7)
    avg14 = average(bp, tr_, len14)
    avg28 = average(bp, tr_, len28)
    uo = 100 * (4*avg7 + 2*avg14 + avg28)/7
    uo_res = request.security(syminfo.tickerid, res, uo)
    uo_index = 0
    if uo_res >= 70
        uo_index := 1
    if uo_res <= 30
        uo_index := -1
    uo_index

//Average Directional Index - indicator > 20 and +DI line crossed -DI line from bottom-up
//Average Directional Index - indicator > 20 and +DI line crossed -DI line from above-down
dirmov(len) =>
	up = change(high)
	down = -change(low)
	truerange = rma(tr, len)
	plus = fixnan(100 * rma(up > down and up > 0 ? up : 0, len) / truerange)
	minus = fixnan(100 * rma(down > up and down > 0 ? down : 0, len) / truerange)
	[plus, minus]

adx(dilen, adxlen) =>
	[plus, minus] = dirmov(dilen)
	sum = plus + minus
	adx = 100 * rma(abs(plus - minus) / (sum == 0 ? 1 : sum), adxlen)

adxHigh(dilen, adxlen) =>
	[plus, minus] = dirmov(dilen)
	plus

adxLow(dilen, adxlen) =>
	[plus, minus] = dirmov(dilen)
	minus

calc_adx_index(res) =>
    sig         = adx(dilen, adxlen) //ADX
    sigHigh     = adxHigh(dilen, adxlen) // DI+
    sigLow      = adxLow(dilen, adxlen) // DI-
    res_sig     = request.security(syminfo.tickerid, res, sig)
    res_sigHigh = request.security(syminfo.tickerid, res, sigHigh)
    res_sigLow  = request.security(syminfo.tickerid, res, sigLow)
    spread      = (res_sigHigh/res_sigLow  -1)*100
    adx_index   = 0
    if res_sig >= 20 and spread > 0
        adx_index := 1
    if res_sig >= 20 and spread < 0
        adx_index := -1
    adx_index

//Bull Bear Power Index - bear power is below 0 and is weakening -> BUY
//Bull Bear Power Index - bull power is above 0 and is weakening -> SELL
calc_bbp_index(len, src, res ) =>
    ema   = ema(src, len)
    bulls = high - ema
    bears = low  - ema
    bulls_res = request.security(syminfo.tickerid, res, bulls)
    bears_res = request.security(syminfo.tickerid, res, bears)
    sum = bulls_res + bears_res
    bbp_index = 0
    if bears_res < 0 and bears_res > bears_res[1]
        bbp_index := 1
    if bulls_res > 0 and bulls_res < bulls_res[1]
        bbp_index := -1
    bbp_index

// --------------------------------MOVING AVERAGES CALCULATION------------------------------------- //
sma10_index  = calc_sma_index(sma10,  src, res)
sma20_index  = calc_sma_index(sma20,  src, res)
sma30_index  = calc_sma_index(sma30,  src, res)
sma50_index  = calc_sma_index(sma50,  src, res)
sma100_index = calc_sma_index(sma100, src, res)
sma200_index = calc_sma_index(sma200, src, res)
ema10_index  = calc_ema_index(ema10,  src, res)
ema20_index  = calc_ema_index(ema20,  src, res)
ema30_index  = calc_ema_index(ema30,  src, res)
ema50_index  = calc_ema_index(ema50,  src, res)
ema100_index = calc_ema_index(ema100, src, res)
ema200_index = calc_ema_index(ema200, src, res)
hull9_index  = calc_ema_index(hma9,   src, res)
vwma20_index = calc_ema_index(vwma20, src, res)

ichimoku_index = 0.0 //Ichimoku - is not active in the calculation brought to you by TV TEAM for the lolz
moving_averages_index = ( ema10_index + ema20_index + ema30_index + ema50_index + ema100_index + ema200_index +
						  sma10_index + sma20_index + sma30_index + sma50_index + sma100_index + sma200_index +
                          ichimoku_index + vwma20_index + hull9_index ) / 15

// -----------------------------------OSCILLATORS CALCULATION----------------------------------------- //
rsi_index       = calc_rsi_index(rsi_len, src, res)
stoch_index     = calc_stoch_index(stoch_k, stoch_d, stoch_smooth, res)
cci_index       = calc_cci_index(cci_len, src, res)
ao_index        = calc_awesome_index(src, res)
mom_index       = calc_momentum_index(momentum_len, src, res)
macd_index      = calc_macd_index(macd_fast, macd_slow, src, res)
stochrsi_index  = calc_stochrsi_index(rsi_len, stoch_k, stoch_d, stoch_smooth, src, res)
wpr_index       = calc_wpr_index(wpr_length, src, res)
uo_index        = calc_uo_index(uo_length7, uo_length14, uo_length28, res)
adx_index       = calc_adx_index(res)
bbp_index       = calc_bbp_index(bbp_len , src, res)

oscillators_index = ( rsi_index + stoch_index + adx_index + cci_index + stochrsi_index + ao_index + mom_index + macd_index + wpr_index + uo_index + bbp_index )	/ 11

rating_index = ( moving_averages_index + oscillators_index ) / 2

plot(moving_averages_index, color=green, linewidth = 1, title="Moving Averages Rating",transp = 70)
plot(oscillators_index    , color=blue,  linewidth = 1, title="Oscillators Rating",transp = 70)
plot(rating_index         , color=orange,   linewidth = 2, title="Rating")

strongbuy       = hline(1,   "Strong Buy" , color=silver )
buy             = hline(0.5, "Strong Buy" , color=green  )
normal          = hline(0,   "Buy/Sell"   , color=silver )
sell            = hline(-0.5,"Strong Sell", color=red    )
strongsell      = hline(-1,  "Strong Sell", color=silver )

fill(strongbuy,buy,   color=green,   transp=90)
fill(buy,normal,      color=#b2ffb2, transp=90)
fill(sell,normal,     color=#F08080, transp=90)
fill(strongsell,sell, color=red,     transp=90)

longCondition = rating_index > 0
if (longCondition)
    strategy.entry("My Long Entry Id", strategy.long)

shortCondition = rating_index < 0
if (shortCondition)
    strategy.entry("My Short Entry Id", strategy.short)
Detail
https://www.fmz.com/strategy/430022
Last Modified
2023-10-24 12:27:20