
7.8 KiB
Name
均线穿越波动带策略Mean-Reversion-Bollinger-Bands-Strategy
Author
ChaoZhang
Strategy Description
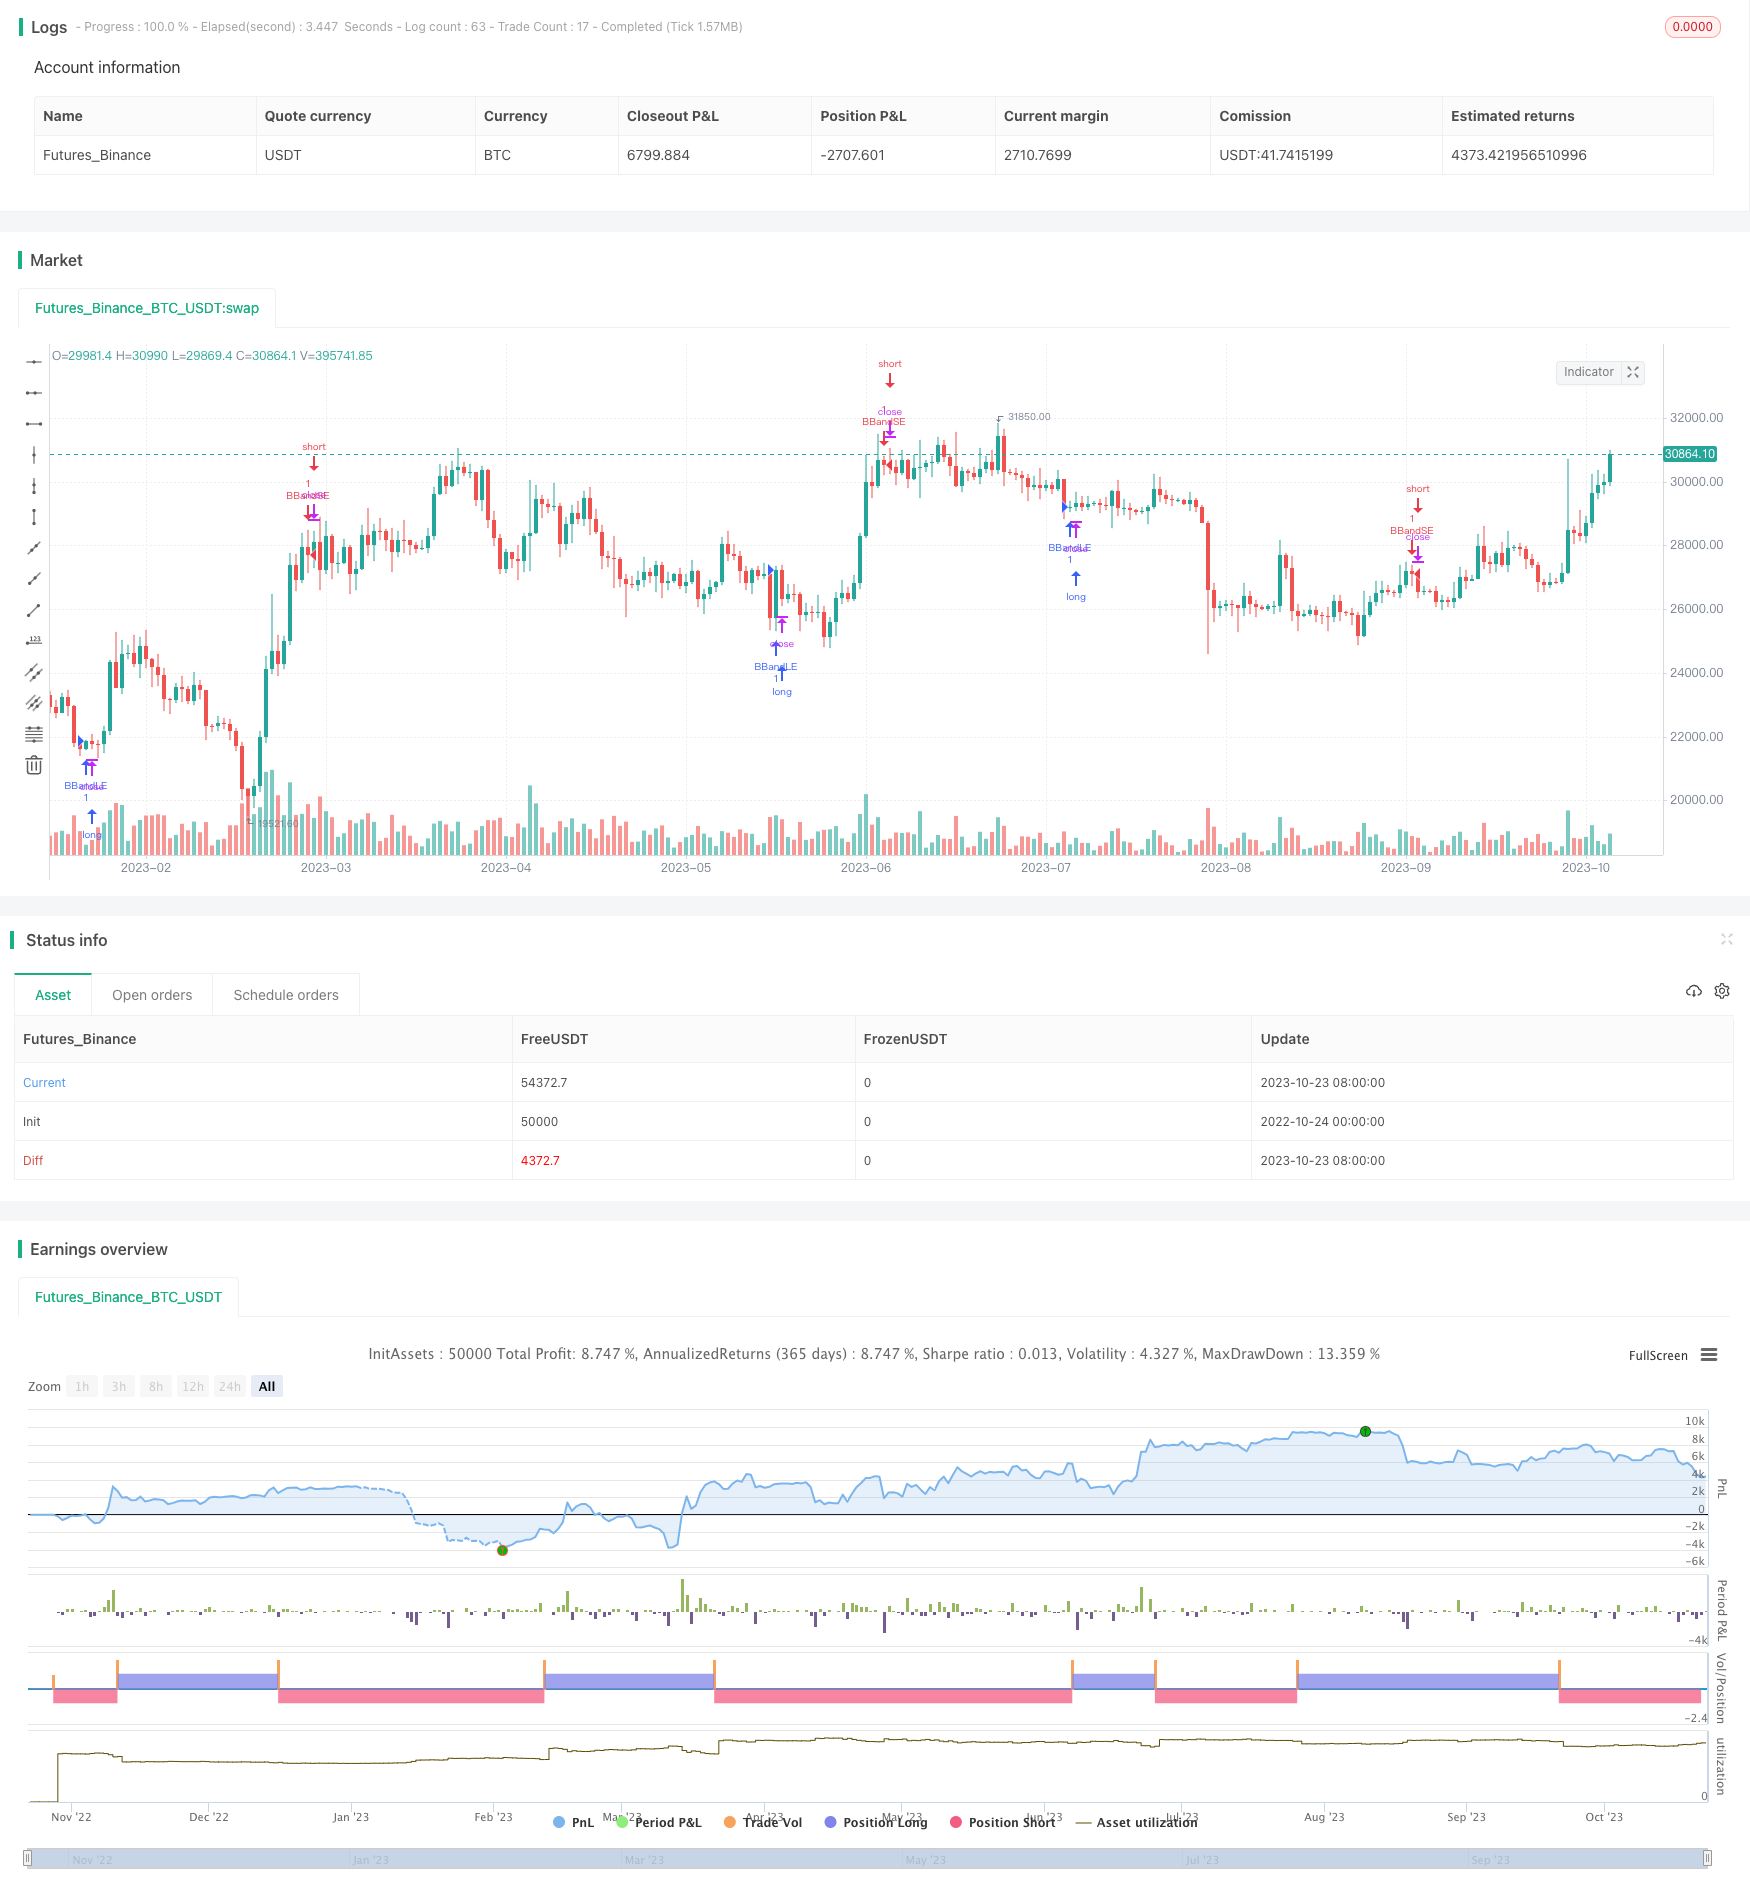
[trans]
概述
均线穿越波动带策略利用布林带指标判断市场波动性,配合均线判断市场趋势,在波动率低的情况下判断趋势方向,达到在低波动时获取趋势利润的目的。
策略原理
该策略通过计算均线及其上下波动带来判断市场的波动率。具体来说,先计算n日简单移动均线,然后在均线上下各扩张k倍的标准差范围,形成上轨和下轨,即布林带。当价格接近上下轨时,表示市场波动加大;当价格位于上下轨之间时,表示市场波动减小。
该策略在波动减小时,利用均线的方向来判断趋势方向,在均线上行时做多,在均线下行时做空。具体来说,当价格从下轨向上突破时,做多;当价格从上轨向下突破时,做空。每个仓位的止损点设为对应轨道,以控制风险。
该策略的优点是在波动率较低时参与趋势,避开了部分市场的随机波动,从而提高获利概率。
优势分析
- 利用波动率低时判断趋势,减少随机性,提高稳定性
该策略只在布林带收缩,市场波动减弱的时候参与趋势,避开了高波动时期的不确定性,从而减少了随机性,提高了稳定性。
- 均线辅助判断,提高判断准确性
该策略除了布林带识别波动率外,还引入均线判断趋势方向,两者互为验证,可以提高判断的准确性。
- 有止损点,控制风险
该策略的每笔交易都设定了止损点,即布林带的上轨或下轨,可以快速止损,控制风险。
风险分析
- 趋势判断失误风险
在布林带收缩的过程中,均线方向可能发生改变,导致趋势判断发生错误,从而造成损失。
可以通过调整均线参数,或增加其他指标进行验证,来减少这种风险。
- 布林带波动过大风险
如果布林带参数设定过大,波动过大,可能会导致无效交易次数过多。
可以通过调整布林带标准差倍数参数来优化,也可以设定布林带宽度的阈值作为过滤条件。
- 突破失败风险
价格突破上轨或下轨后可能失败,无法形成趋势,造成损失。
可以通过仅在收盘价或K线实体突破时才入场,或增加量能等辅助条件来验证突破信号,来减少突破失败概率。
优化方向
- 结合更多指标验证
可以引入像MACD,KDJ等其他指标,对均线判断进行验证,提高判断准确率。
- 优化参数
可以通过回测优化均线参数,布林带标准差倍数参数,来获得最佳参数组合。
- 优化入场时机选择
可以调整为只在收盘价或K线实体突破布林带时入场,或增加量能条件来验证突破。
- 优化止损策略
可以通过trailing stop或移动止损等方式来锁定利润,避免给利润回吐。
总结
均线穿越波动带策略是一种典型的趋势跟踪策略。它巧妙地利用布林带判断低波动时间段,配合均线判断趋势方向,在波动率较低时参与趋势。这可以有效滤除一部分市场随机性,提高稳定性。该策略有一定的优势,但也存在一定的风险,需要注意防范。通过引入更多指标,优化参数和入场时机等,可以不断提升该策略的稳定性和profit因子。
||
Overview
The Mean Reversion Bollinger Bands strategy uses the Bollinger Bands indicator to gauge market volatility and moving averages to determine the trend, taking trend trades during periods of low volatility to profit from the trend while avoiding excessive randomness.
Strategy Logic
The strategy calculates the moving average and upper/lower bands representing a certain multiplier of standard deviation above and below the moving average, forming the Bollinger Bands. When price approaches the bands, it indicates increased volatility. When price is within the bands, it signals decreased volatility.
The strategy goes long when price breaks above the lower band on an uptrending moving average, and goes short when price breaks below the upper band on a downtrending moving average. The corresponding band is used as the stop loss to control risk.
The advantage of this approach is participating in the trend during periods of low volatility, avoiding excessive random price fluctuations and increasing the probability of profit.
Advantage Analysis
- Trading the trend on low volatility reduces randomness and increases stability
By only trading the trend when the Bollinger Bands contract and volatility decreases, the strategy avoids uncertain periods of high volatility, reducing randomness and increasing stability.
- Moving average assists trend judgment, improving accuracy
The moving average, in addition to the Bollinger Bands gauging volatility, helps determine the trend direction, with the two validating each other and improving accuracy.
- Built-in stop loss controls risk
The strategy sets stop loss levels at the bands for each trade, allowing quick stops and risk control.
Risk Analysis
- Trend misjudgment risk
The moving average direction may change during band contraction, leading to incorrect trend judgment and losses.
Adding other indicators to confirm the trend can help minimize this risk.
- Excessive band volatility risk
If bands are too wide due to excessive standard deviation multiplier, ineffective trades will be too frequent.
Optimizing the parameter or adding band width threshold filters can improve this.
- Breakout failure risk
Price may fail to trend after breaking the bands, causing losses.
Using only closing breaks or adding volume confirmation can reduce failed breakouts.
Optimization Directions
- Add more indicator confirmations
Adding indicators like MACD and KDJ to confirm moving average signals improves accuracy.
- Optimize parameters
Backtesting to find optimal moving average and standard deviation multiplier parameters improves performance.
- Optimize entry timing
Using only closing breaks or adding volume filters improves timing.
- Optimize stop loss strategy
Trailing stops and moving stops can help lock in profits and prevent giving back gains.
Conclusion
The Mean Reversion Bollinger Bands Strategy cleverly uses the bands to identify low volatility periods and the moving average to determine trend direction, participating in trends when volatility decreases. This filters out excessive randomness and increases stability. The strategy has advantages but also risks to watch out for. Further improvements in stability and profitability can come from additional indicator confirmations, parameter optimization, improved entry timing, and advanced stop loss strategies.
[/trans]
Strategy Arguments
| Argument | Default | Description |
|---|---|---|
| v_input_1 | 20 | length |
| v_input_2 | 2 | mult |
Source (PineScript)
/*backtest
start: 2022-10-24 00:00:00
end: 2023-10-24 00:00:00
period: 1d
basePeriod: 1h
exchanges: [{"eid":"Futures_Binance","currency":"BTC_USDT"}]
*/

//@version=4
strategy("Trading Public School", overlay=true)
source = close
length = input(20, minval=1)
mult = input(2.0, minval=0.001, maxval=50)

basis = sma(source, length)
dev = mult * stdev(source, length)

upper = basis + dev
lower = basis - dev

buyEntry = crossover(source, lower)
sellEntry = crossunder(source, upper)

if (crossover(source, lower))
    strategy.entry("BBandLE", strategy.long, stop=lower, oca_name="BollingerBands",  comment="BBandLE")
else
    strategy.cancel(id="BBandLE")

if (crossunder(source, upper))
    strategy.entry("BBandSE", strategy.short, stop=upper, oca_name="BollingerBands",  comment="BBandSE")
else
    strategy.cancel(id="BBandSE")

//plot(strategy.equity, title="equity", color=color.red, linewidth=2, style=plot.style_areabr)
Detail
https://www.fmz.com/strategy/430115
Last Modified
2023-10-25 11:04:13