
10 KiB
Name
均线带趋势策略Moving-Average-Ribbon-Trend-Strategy
Author
ChaoZhang
Strategy Description
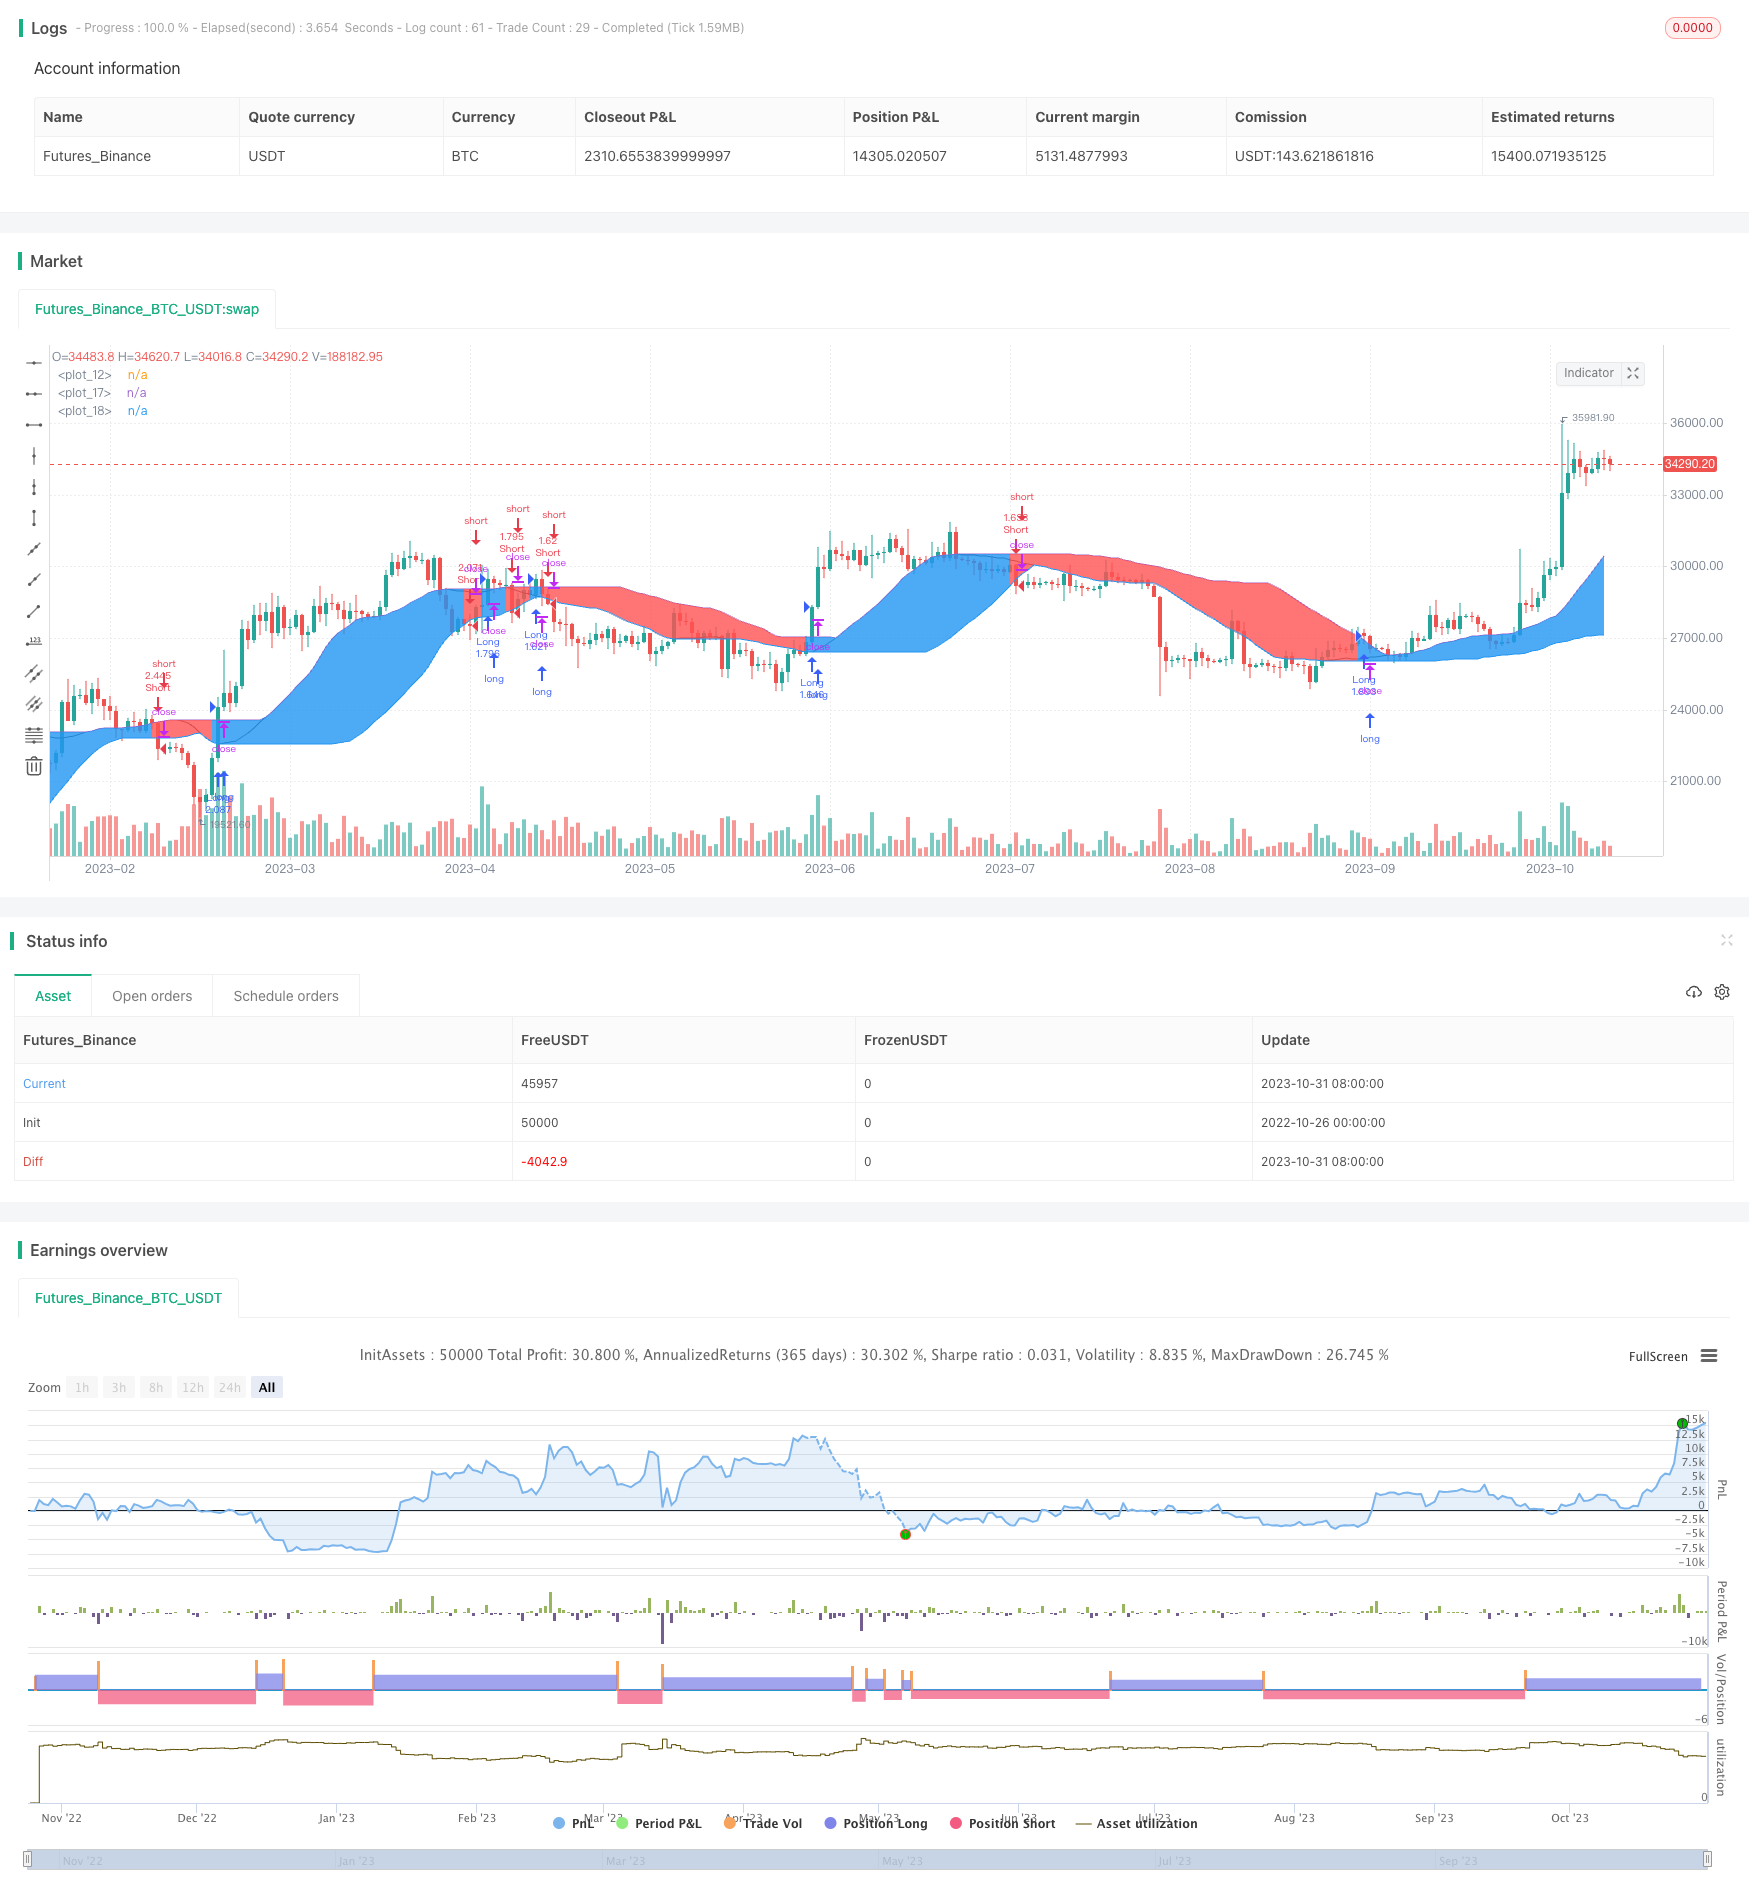
[trans]
概述
均线带趋势策略(Moving Average Ribbon Trend Strategy)是一个基于移动平均线的趋势跟踪策略。它使用单一均线构建价格通道,根据价格相对通道的位置来判断趋势方向并进行交易。该策略适用于趋势较明显的市场,可捕捉较长周期的价格趋势。
策略原理
该策略通过计算指定周期长度(默认20周期)的简单移动平均线,并以其值构建价格通道。通道的上轨和下轨分别为均线的最高值和最低值。如果收盘价高于上轨,则判定为上涨趋势;如果收盘价低于下轨,则判定为下跌趋势。
当判断到趋势变化时,该策略会进行交易操作。如果从下跌转为上涨,则进行多头开仓;如果从上涨转为空头,则进行空头开仓。原有多头仓位在转为空头时平仓;原有空头仓位在转为多头时平仓。
具体来说,策略的交易逻辑为:
- 如果收盘价大于上一周期的上轨,则开多头仓位
- 如果收盘价小于上一周期的下轨,则开空头仓位
- 原有多头仓位在收盘价低于下轨时平仓
- 原有空头仓位在收盘价高于上轨时平仓
该策略使用单一均线构建价格通道,通过判断价格突破通道判断趋势方向。它简单直观,容易实现,适合作为趋势跟踪策略。
优势分析
均线带趋势策略具有以下优势:
- 策略逻辑简单,容易理解实现,降低实施难度
- 使用单一均线,参数调节简单,避免过度优化
- 利用价格通道判断趋势转换,可清晰识别趋势转折点
- 可配置通道宽度,调整策略的灵敏度
- 采用突破均线的方式建仓,可过滤掉部分假突破
- 仓位沿趋势方向持续累积,可充分捕捉趋势行情
- 仓位根据均线调整,可主动控制风险
综合来说,均线带趋势策略以简单的逻辑为基础,利用价格通道捕捉趋势转换,可有效跟踪较长线的价格趋势,适合作为趋势跟踪策略使用。
风险分析
均线带趋势策略也存在一定的风险,主要包括:
- 均线生成滞后,可能错过趋势转换的最佳时间点
- 震荡行情中发生多次假突破,造成不必要的亏损
- 长期趋势交易,回撤可能较大,需要有足够的资金支持
- 单一参数设置易过优化,实盘效果可能弱于回测
- 无法区分市场中的不同波段,可能对较短周期的变化反应不敏感
对此,可以通过以下方法进行优化:
- 调整均线周期,降低滞后程度
- 增加过滤条件,避免在震荡市场中被套
- 优化仓位管理,控制单笔损失
- 实盘调参确认参数设置
- 增加多均线判断,识别不同级别的趋势
优化方向
均线带趋势策略还可从以下方面进行优化:
-
优化均线指标:可以尝试不同类型的均线,如加权移动平均线等,看是否能提高表现。
-
增加过滤条件:可在建仓前增加其他过滤条件,如交易量、波动率等,避免在震荡期被套。
-
多时间框架:使用不同周期均线,识别更多时间尺度下的趋势变化。
-
动态调整参数:让均线周期和通道宽度可以根据市场状态动态调整,提高策略的适应性。
-
仓位优化:根据市场状态调整仓位大小,避免亏损过大。可以设置盈利目标来主动减小仓位。
-
机器学习优化:使用机器学习算法自动优化策略的参数,寻找更好的组合。
-
集成其他策略:与类似的趋势跟踪策略集成,实现策略组合,提高稳定性。
综上,均线带趋势策略可从均线指标、过滤条件、时间框架、动态调参、仓位管理等方面进行全面的优化,使策略更稳健、灵活,适应更多市场环境。
总结
均线带趋势策略是一个较简单的趋势跟踪策略。它使用单一均线构建价格通道,通过价格突破通道判断趋势方向,以捕捉中长线趋势。该策略具有逻辑简单、参数少、易于实现等优点,可作为趋势跟踪入门策略。但该策略也存在滞后识别趋势、容易被套等风险。通过进一步优化均线指标、增加过滤机制、动态调参等,可以获得更好的实盘效果。总体来说,均线带趋势策略为我们提供了一个基于价格通道判断趋势的思路,是较为直观的趋势跟踪策略之一。 ||
Overview
The Moving Average Ribbon Trend Strategy is a trend-following strategy based on moving averages. It uses a single moving average to construct a price channel and determines the trend direction based on the price relative to the channel, then places trades accordingly. This strategy works well in trending markets and is able to capture longer-term price trends.
Strategy Logic
The strategy calculates a simple moving average with a specified period length (default 20 periods) and builds a price channel using the MA values. The upper and lower bands of the channel are the highest and lowest values of the MA respectively. If the closing price is above the upper band, an uptrend is determined. If the closing price is below the lower band, a downtrend is identified.
When a trend change is detected, the strategy will place trades. If the trend changes from down to up, a long position will be opened. If the trend changes from up to down, a short position will be opened. Existing long positions will be closed if the trend turns down, and existing short positions will be closed if the trend turns up.
Specifically, the trading logic is:
- Open long if closing price > previous upper band
- Open short if closing price < previous lower band
- Close long if closing price < lower band
- Close short if closing price > upper band
The strategy uses a single MA to construct the price channel and identify trend changes by price breakouts. It is simple, intuitive and easy to implement, suitable as a trend following strategy.
Advantage Analysis
The Moving Average Ribbon Trend Strategy has the following advantages:
- Simple logic, easy to understand and implement, lowers execution difficulty
- Uses single MA, fewer parameters, avoids overfitting
- Price channel clearly identifies trend turning points
- Customizable channel width to adjust sensitivity
- MA breakout filters some false breakouts
- Position size accumulates along the trend, captures trend moves
- Position adjusted by MA, actively controls risk
In summary, the strategy is based on simple logic, uses the price channel to identify trend changes, and can effectively follow longer-term price trends. It is suitable as a trend following strategy.
Risk Analysis
The strategy also has some risks:
- MA lag may miss best entry timing for trend change
- Whipsaws may cause unnecessary losses in ranging markets
- Long term trend trading can face larger drawdowns, requires adequate capital
- Single parameter may cause overfitting, underperform in live trading
- Unable to distinguish cycles, may be insensitive to shorter fluctuations
The risks can be addressed by:
- Adjust MA period to reduce lag
- Add filters to avoid whipsaws in ranging markets
- Optimize position sizing to limit losses
- Parameter tuning with live data
- Add multiple MAs to identify trends on different levels
Enhancement Opportunities
The strategy can be enhanced in the following aspects:
-
Optimize MA indicator: Test different MAs like WMA to improve performance.
-
Add filters: Add filters like volume, volatility before entry to avoid whipsaws.
-
Multiple timeframes: Use MAs on different timeframes to identify more trends.
-
Dynamic parameters: Allow dynamic adjustment of MA period and channel width based on market conditions.
-
Position sizing: Adjust position size based on market conditions to limit losses. Can set profit targets to reduce size.
-
Machine learning: Use ML to find optimal parameter combinations.
-
Ensemble methods: Combine with other trend following strategies for more robustness.
In summary, the strategy can be enhanced comprehensively in terms of indicator selection, filters, timeframes, dynamic parameters, position sizing etc. This will make the strategy more robust and flexible across different market environments.
Conclusion
The Moving Average Ribbon Trend Strategy is a simple trend following strategy. It uses a single MA to build a price channel and identifies trend direction by channel breakouts, aiming to capture medium- to long-term trends. The strategy has advantages like simple logic, few parameters, and ease of implementation. But it also has risks like lagging in trend identification and being whipsawed. Further enhancements can be made through optimizing MA, adding filters, dynamic parameters etc. to improve live performance. Overall, the strategy provides an intuitive approach to using price channels for trend identification and serves as a basic trend following strategy.
[/trans]
Strategy Arguments
| Argument | Default | Description |
|---|---|---|
| v_input_1 | 20 | MA Length |
| v_input_2_ohlc4 | 0 | MA Source: ohlc4 |
Source (PineScript)
/*backtest
start: 2022-10-26 00:00:00
end: 2023-11-01 00:00:00
period: 1d
basePeriod: 1h
exchanges: [{"eid":"Futures_Binance","currency":"BTC_USDT"}]
*/

// This source code is subject to the terms of the Mozilla Public License 2.0 at https://mozilla.org/MPL/2.0/
// © noro

//@version=4
strategy(title = "Noro's Trend Ribbon Strategy", shorttitle = "Trend Ribbon str", overlay = true, default_qty_type = strategy.percent_of_equity, default_qty_value = 100, pyramiding = 0, commission_value = 0.1)

len = input(20, minval = 5, title = "MA Length")
src = input(ohlc4, title = "MA Source")

//MA
ma = sma(src, len)
plot(ma, color = color.black)

//Channel
h = highest(ma, len)
l = lowest(ma, len)
ph = plot(h)
pl = plot(l)

//Trend
trend = 0
trend := close > h[1] ? 1 : close < l[1] ? -1 : trend[1]

//BG
col = trend == 1 ? color.blue : color.red
fill(ph, pl, color = col, transp = 50)

//Trading
if close > h[1]
    strategy.entry("Long", strategy.long)
if close < l[1]
    strategy.entry("Short", strategy.short)
Detail
https://www.fmz.com/strategy/430859
Last Modified
2023-11-02 15:22:17