
7.8 KiB
Name
均线多空平衡交易策略Corn-Moving-Average-Balance-Trading-Strategy
Author
ChaoZhang
Strategy Description
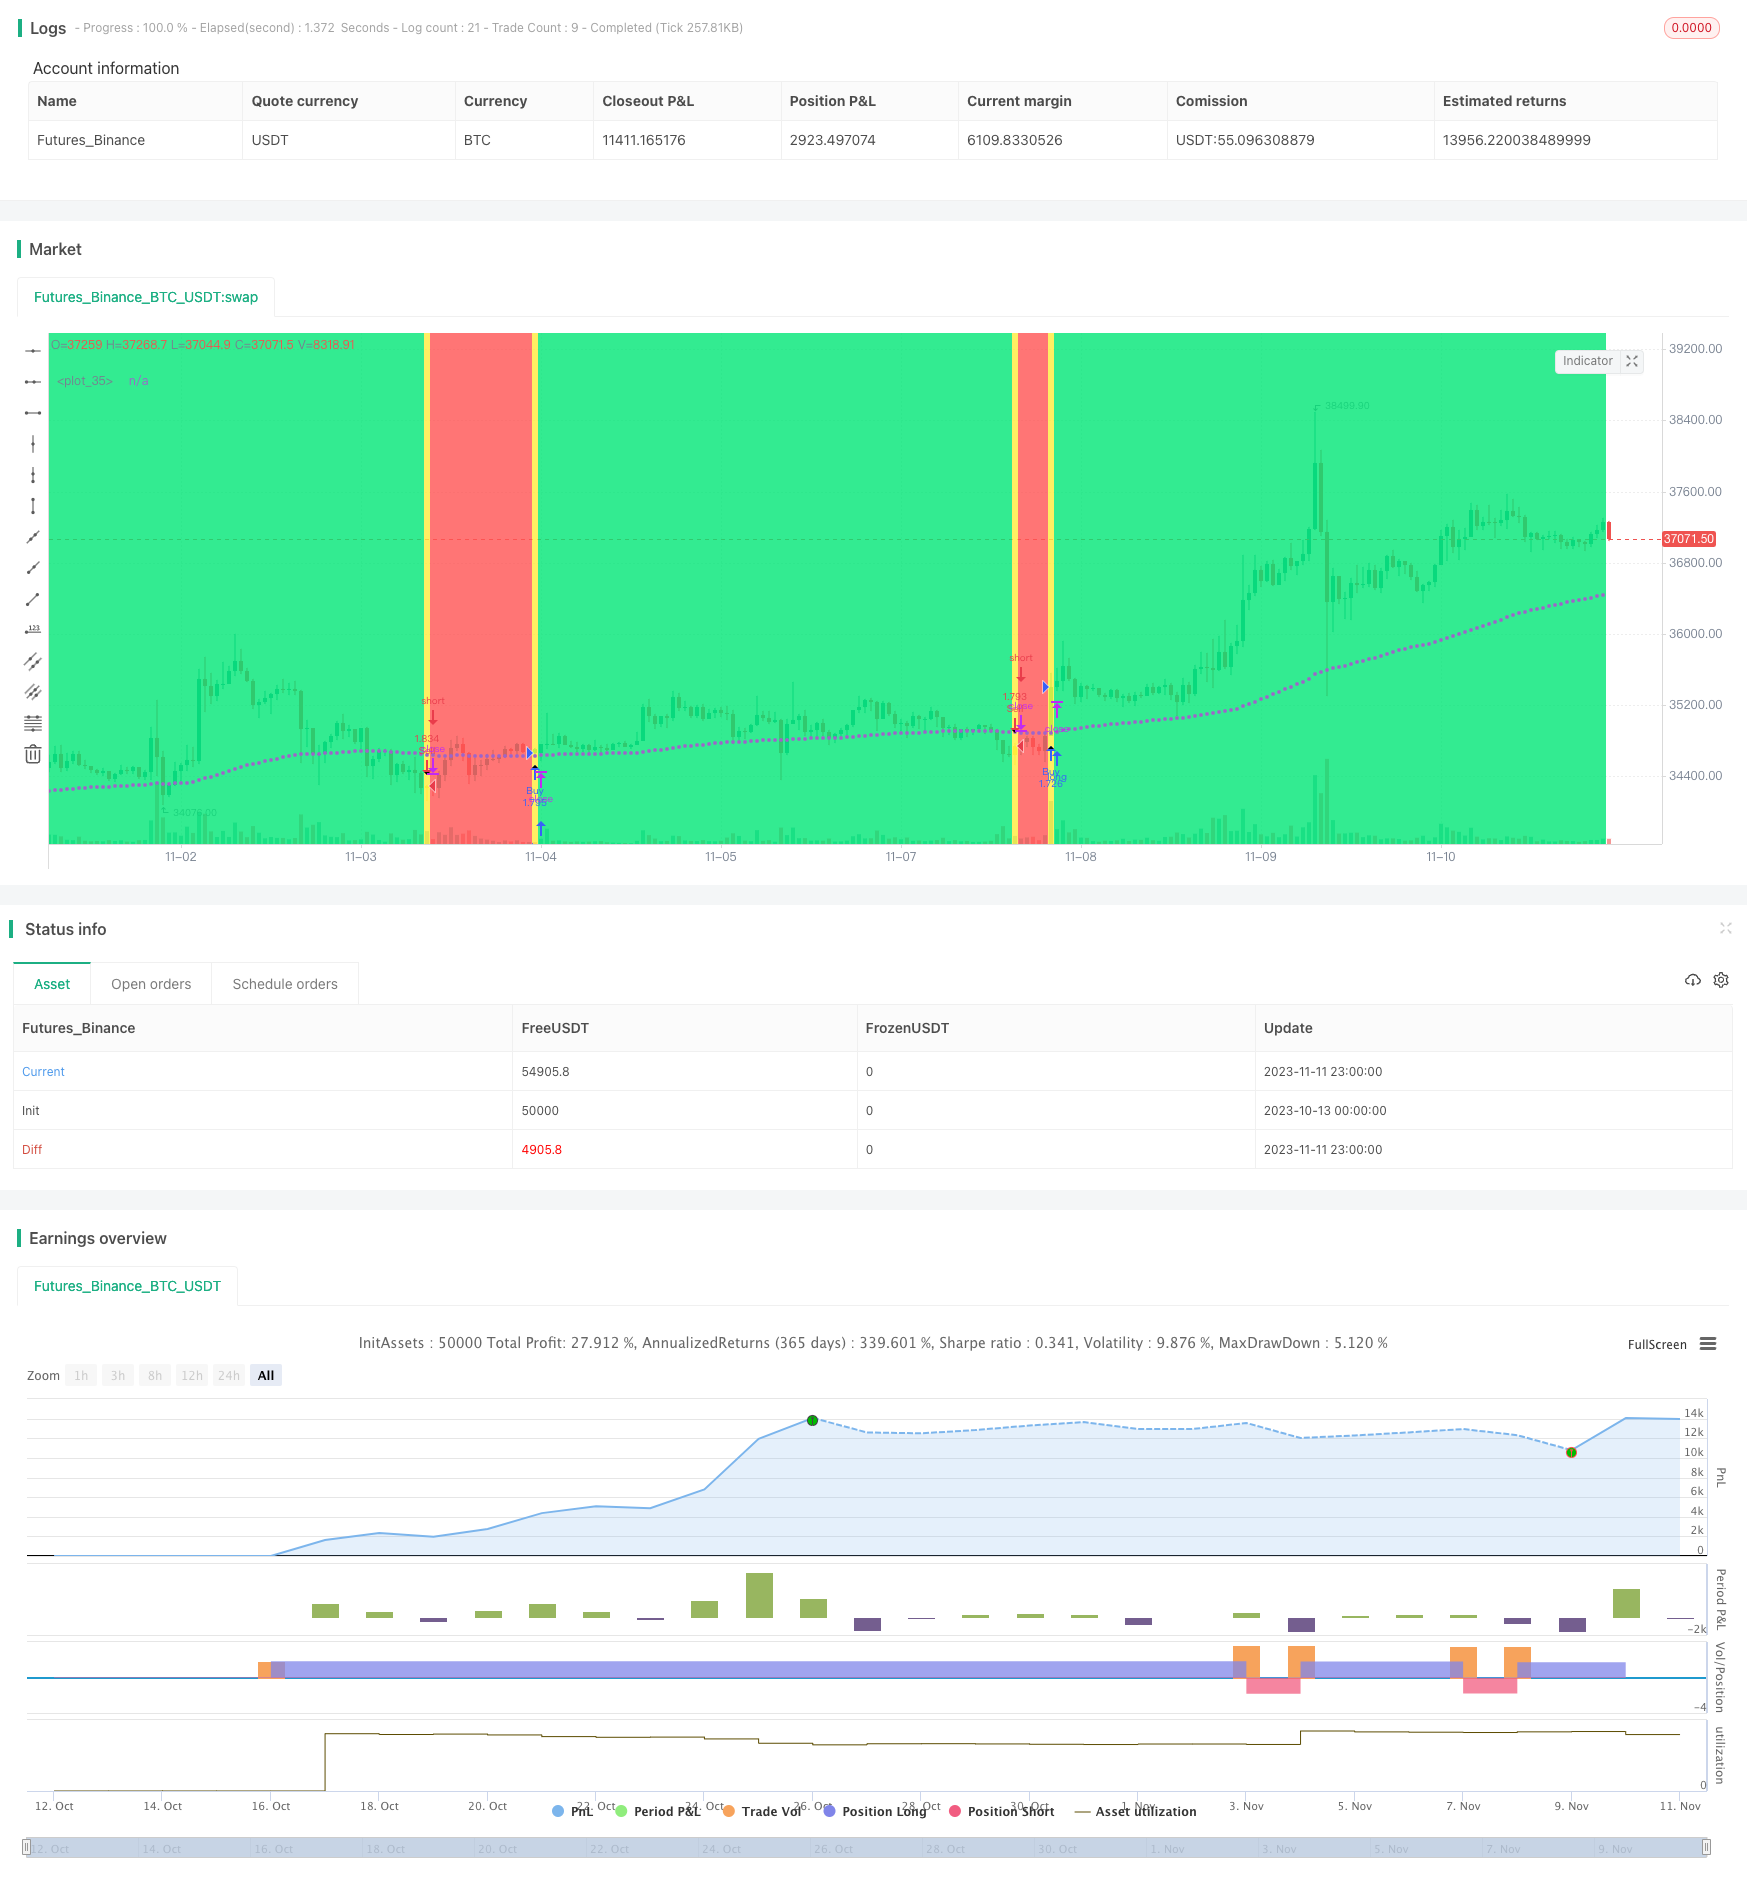 [trans]
概述
均线多空平衡交易策略是一种利用不同周期的移动平均线 golden和death交叉进行多空平衡交易的策略。该策略同时结合K线显示颜色、背景颜色、形状标记等多种视觉效果来辅助观察趋势变化。该策略适用于对移动均线理论较为熟悉的中高级交易者。
策略原理
该策略首先定义了两个用户可调整的参数:活跃均线周期len1和基准均线周期len2。活跃均线周期短,可捕捉短期趋势变化;基准均线周期长,可过滤掉短期市场噪音。用户可以自由选择5种不同类型的移动平均线:EMA指数移动平均线、SMA简单移动平均线、WMA加权移动平均线、DEMA双指数移动平均线和VWMA成交量加权移动平均线。代码通过if逻辑判断用户的选择,计算出不同类型的均线。
当短期均线上穿长期均线时生成金叉信号,开多单;短期均线下穿长期均线时生成死叉信号,开空单。多空平衡交易增加了获利机会。此外,K线的颜色也显示了目前的多空趋势情况。
形状标记直观显示了金叉和死叉的位置。背景颜色辅助判断趋势方向。该策略同时具有“多空平衡”和“仅多头”两种交易模式可选。
策略优势
- 同时结合均线多种指标,交易信号更可靠
- 多空平衡交易,增加获利机会
- 可自定义均线类型和周期长度,适应不同市场环境
- 结合多种视觉效果,直观判断趋势变化
- 代码结构清晰,容易理解和二次开发
风险及解决方案
-
均线产生误导信号的风险
- 采用不同周期均线组合,降低误导信号
- 增加其他 Exit 出场条件,如止损线
-
特定周期更适合该策略的风险
- 测试不同周期参数,找到最佳周期
- 优化代码,使周期参数可动态调整
-
多空交易增加亏损风险
- 适当调整仓位管理
- 仅选择多头交易模式
优化方向
- 增加止损线,以控制单笔亏损
- 添加重新进入市场的条件
- 优化仓位管理策略
- 探索新的交易信号,如波动率指标
- 动态优化周期参数
- 优化移动平均线类型的权重
总结
均线多空平衡交易策略整合了均线指标的优势,实现了多空平衡交易。该策略视觉效果丰富,便于掌握市场趋势;而参数可自定义,适应能力强。但需要注意误导信号和仓位管理问题。该策略为中高级交易者提供了一个可定制和优化的参考框架。
||
Overview
The Corn Moving Average Balance Trading Strategy utilizes the golden and dead crossovers of moving averages with different periods for long and short balance trading. It also incorporates various visual effects like candle colors, background colors and shape markers to assist in observing trend changes. This strategy is suitable for intermediate to advanced traders who are familiar with moving average theories.
Strategy Logic
The strategy first defines two user-adjustable parameters: the active moving average period len1 and the baseline moving average period len2. The active moving average has a shorter period to capture short-term trend changes, while the baseline moving average has a longer period to filter out market noises. Users can freely choose between 5 different types of moving averages: EMA, SMA, WMA, DEMA and VWMA. The code uses if logic to calculate different types of moving averages based on user's selection.
When the short-term moving average crosses over the long-term one, a golden cross is generated for opening long positions. When a dead cross happens, the strategy opens short positions. The long and short balance trading increases profit opportunities. In addition, the candle colors also display the current trend direction.
The shape markers visually show the positions of golden and dead crosses. The background color assists in determining the trend direction. This strategy has both the "long and short balance" and "long only" trading modes available.
Advantages
- More reliable trading signals with multiple indicators combined
- Increased profit potential with long and short balance trading
- Customizable moving average types and periods adaptable to different market environments
- Intuitive trend spotting with various visual effects
- Clear code structure easy to understand and customize
Risks and Solutions
-
Misleading signals from moving averages
- Use moving average combos of different periods to reduce misleading signals
- Add other exit conditions like stop loss
-
Certain periods may fit the strategy better
- Test different period parameters to find the optimal ones
- Make the period parameter dynamic and adjustable in the code
-
Increased loss risk with long and short trading
- Adjust position sizing properly
- Select long only trading mode
Optimization Directions
- Add stop loss to control single trade loss
- Build conditions for re-entering the market
- Optimize position sizing strategies
- Explore new trading signals like volatility indicators
- Dynamically optimize the period parameters
- Optimize the weights between different moving average types
Summary
The Corn Moving Average Balance Trading Strategy integrates the strengths of moving average indicators and enables long and short balance trading. It has rich visual effects for trend spotting and customizable parameters for adaptability. But misleading signals and position sizing need to be watched out for. This strategy provides intermediate to advanced traders a customizable framework for reference.
[/trans]
Strategy Arguments
| Argument | Default | Description |
|---|---|---|
| v_input_1 | 0 | Active MA: EMA |
| v_input_2 | 0 | Base MA: EMA |
| v_input_3 | 20 | Active Length |
| v_input_4 | 100 | Base Length |
| v_input_5_close | 0 | Source: close |
| v_input_6 | 0 | strat: Long+Short |
Source (PineScript)
/*backtest
start: 2023-10-13 00:00:00
end: 2023-11-12 00:00:00
period: 1h
basePeriod: 15m
exchanges: [{"eid":"Futures_Binance","currency":"BTC_USDT"}]
*/

//@version=3
strategy("MASelect Crossover Strat", overlay=true, default_qty_type=strategy.percent_of_equity, default_qty_value=100)
av1 = input(title="Active MA", defval="EMA", options=["EMA", "SMA", "WMA", "DEMA", "VWMA"])
av2 = input(title="Base MA", defval="EMA", options=["EMA", "SMA", "WMA", "DEMA", "VWMA"])
len1 = input(20, "Active Length")
len2 = input(100, "Base Length")
src = input(close, "Source")
strat = input(defval="Long+Short", options=["Long+Short", "Long Only"])

ema1 = ema(src, len1)
ema2 = ema(src, len2)
sma1 = sma(src, len1)
sma2 = sma(src, len2)
wma1 = wma(src, len1)
wma2 = wma(src, len2)
e1 = ema(src, len1)
e2 = ema(e1, len1)
dema1 = 2 * e1 - e2
e3 = ema(src, len2)
e4 = ema(e3, len2)
dema2 = 2 * e3 - e4
vwma1 = vwma(src, len1)
vwma2 = vwma(src, len2)

ma1 = av1 == "EMA"?ema1:av1=="SMA"?sma1:av1=="WMA"?wma1:av1=="DEMA"?dema1:av1=="VWMA"?vwma1:na
ma2 = av2 == "EMA"?ema2:av2=="SMA"?sma2:av2=="WMA"?wma2:av2=="DEMA"?dema2:av2=="VWMA"?vwma2:na

co = crossover(ma1, ma2)
cu = crossunder(ma1, ma2)
barcolor(co?lime:cu?yellow:na)
col = ma1 >= ma2?lime:red
bgcolor(co or cu?yellow:col)
plotshape(co, style=shape.triangleup, location=location.belowbar)
plotshape(cu, style=shape.triangledown)
plot(ma1, color=col, linewidth=3), plot(ma2, style=circles, linewidth=1)

strategy.entry("Buy", strategy.long, when=co)
if strat=="Long+Short"
    strategy.entry("Sell", strategy.short, when=cu)
else
    strategy.close("Buy", when=cu)
Detail
https://www.fmz.com/strategy/431973
Last Modified
2023-11-13 18:00:09