
12 KiB
Name
均线交易策略Trend-Trading-Strategy-Based-on-Moving-Average
Author
ChaoZhang
Strategy Description
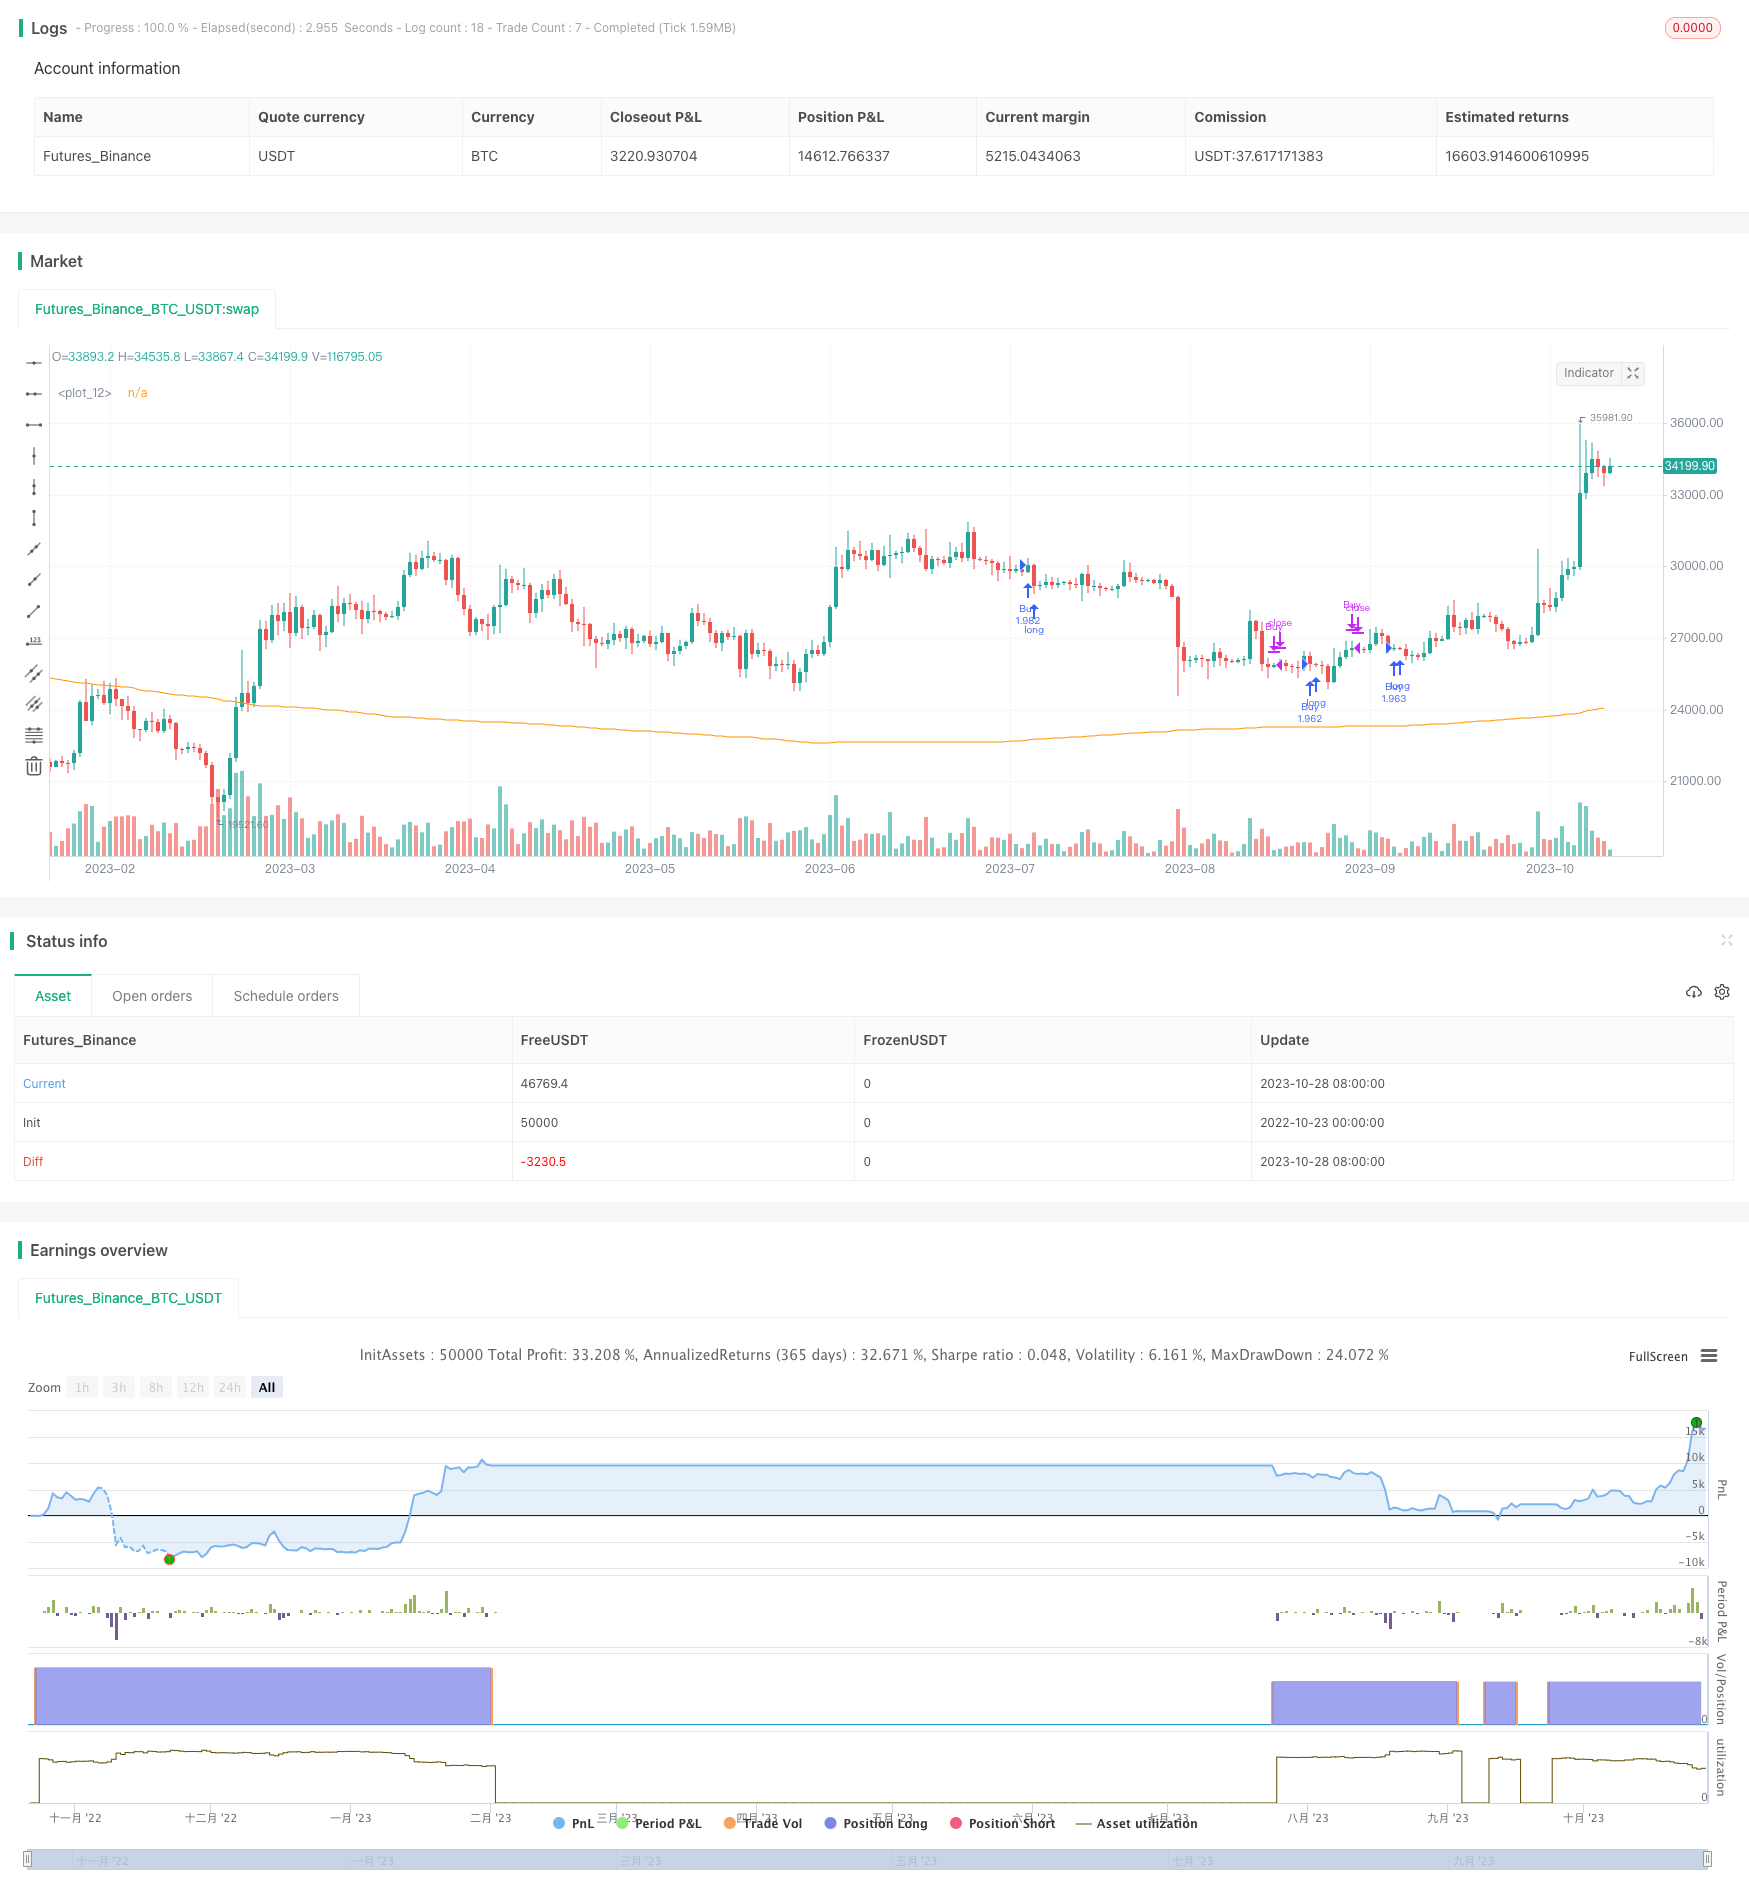 [trans]
概述
该策略运用均线系统判断当前趋势方向,根据趋势方向做多做空。当均线上升时判断为看涨置信度较高,做多;当均线下降时判断为看跌置信度较高,做空。该策略主要通过均线系统来判断市场走势方向,属于趋势跟随型策略。
策略原理
-
计算一定周期(默认400周期)的加权移动平均线vwma作为均线指标。
-
判断均线vwma是否上升,如果上升则设置看多信号uptrend;如果下降则设置看空信号downtrend。
-
当uptrend为真时,做多;当downtrend为真时,平仓做空。
-
计算每根K线的策略收益率bar_pnl和买持收益率bar_bh。
-
根据季度和年度断点,计算每个季度和年度的策略收益率quarter_pnl和年度收益率year_pnl以及相应的买持收益率quarter_bh和year_bh。
-
在表格中展示每年度每个季度的策略收益率和买持收益率。
策略优势分析
该策略主要依靠均线判断市场趋势方向,具有以下优势:
-
操作简单,通过均线指标判断市场走势,容易理解掌握。
-
回撤控制能力较强,跟随趋势操作,能够有效控制非趋势市的损失。
-
可配置参数较少,主要调整均线周期,容易测试优化。
-
采用表格直观展示收益情况,一目了然。
-
收益表格中添加买持收益进行对比,可以明确策略增量收益。
-
可灵活设置表格位置,方便组合其他策略使用。
策略风险分析
该策略也存在一些风险:
-
Bulk market风险,在长期持续的牛市中,相比买持策略可能收益略低。可以适当调整均线周期来优化。
-
震荡行情下 whipsaw风险较大。可考虑增加过滤条件,如突破前高点等,来减少反复 transactions。
-
均线系统对曲线拟合性不佳,可能错过趋势转折点。可以试验不同类型均线指标。
-
未考虑止损退出机制,存在大幅回撤风险。可以设置动态止损或考虑降低仓位。
-
表格优化方面,可考虑添加 sharpe ratio,最大回撤等风险指标。
策略优化方向
该策略可以从以下几个方面进行优化:
-
优化均线参数,调整均线周期适应不同市场环境。
-
增加过滤条件,如突破前高点等,以减少 whipsaw。
-
尝试不同类型均线,如加权移动均线,双指数移动均线等。
-
加入止损机制,可以设置动态止损或考虑降低仓位。
-
丰富表格内容,添加 sharpe ratio,最大回撤等指标。
-
结合其他指标,如MACD,Bollinger Bands等判断趋势。
-
优化仓位管理,根据市场情况动态调整仓位。
-
测试不同标的运行效果,寻找最佳适用范围。
总结
该均线交易策略整体较为简单直接,通过均线判断趋势操作,回撤控制能力较强,适合跟随趋势型交易者。优化空间还很大,可从均线系统、止损机制、仓位管理等方面进行优化,使策略更适应复杂市场环境。表格设计展示了策略与买持收益比较,直观展示策略增量价值。该策略有效框架和表格展示思路,对于量化交易者具有一定的借鉴作用。
||
Overview
This strategy uses a moving average system to determine the current trend direction and makes long or short positions according to the trend. When the moving average goes up, the confidence in long is higher, so go long. When the moving average goes down, the confidence in short is higher, so go short. This strategy mainly uses the moving average system to determine the market trend direction, belonging to the trend following strategy.
Strategy Logic
-
Calculate the weighted moving average vwma as the moving average indicator for a certain period (default 400 periods).
-
Determine if the moving average vwma is rising, if rising set the long signal uptrend; if falling set the short signal downtrend.
-
When uptrend is true, go long; when downtrend is true, close long and go short.
-
Calculate the strategy return bar_pnl and buy & hold return bar_bh for each bar.
-
According to the quarterly and yearly timestamps, calculate the quarterly strategy return quarter_pnl, yearly return year_pnl and the corresponding buy & hold returns quarter_bh, year_bh.
-
Show the quarterly strategy return vs buy & hold return in a table.
Advantage Analysis
The main advantages of this strategy are:
-
Simple to operate. Determine the market trend by moving average, easy to understand.
-
Good at controlling drawdown. Following the trend reduces losses in non-trending markets.
-
Few tunable parameters. Mainly adjust the moving average period, easy to test and optimize.
-
Intuitive return table to show the results clearly.
-
Add buy & hold return in the table for comparison, shows the excess return.
-
Flexible table position, easy to integrate with other strategies.
Risk Analysis
There are also some risks:
-
Underperformance in long-lasting bull market compared to buy & hold. Can optimize the moving average period.
-
High whipsaw risk in range-bound market. Can add filter conditions like breaking previous high to reduce transactions.
-
Moving average has poor curve fitting ability, may miss trend turning points. Can test different types of moving averages.
-
No stop loss mechanism, risks of huge drawdown. Can set dynamic stop loss or position sizing.
-
For the table, can add risk metrics like sharpe ratio, max drawdown.
Optimization Directions
The strategy can be optimized in the following aspects:
-
Optimize the moving average parameters, adjust period based on market regimes.
-
Add filters like breaking previous high to reduce whipsaws.
-
Try different types of moving averages, like WMA, DEMA etc.
-
Add stop loss mechanisms, like dynamic stops or position sizing.
-
Enrich table contents, add metrics like sharpe ratio, max drawdown.
-
Combine with other indicators like MACD, Bollinger Bands to determine trends.
-
Optimize position sizing, adjust positions dynamically based on market conditions.
-
Test on different products, find the best application scope.
Conclusion
The moving average trading strategy is relatively simple and straightforward. It follows the trend by determining trend using moving average, with good drawdown control, suitable for trend following traders. There is still large room for optimization, like the moving average system, stop loss mechanism, position sizing etc. to make it adaptable to complex market environments. The table design compares the strategy return to buy & hold, showing the excess returns intuitively. The framework and table design of this strategy can provide some good reference for quantitative traders.
[/trans]
Strategy Arguments
| Argument | Default | Description |
|---|---|---|
| v_input_1 | 400 | maLength |
| v_input_2 | false | Enable Quarterly Return table |
| v_input_3 | false | Compare with Market Benchmark |
| v_input_4 | 0 | Table Position: bottom_right |
Source (PineScript)
/*backtest
start: 2022-10-23 00:00:00
end: 2023-10-29 00:00:00
period: 1d
basePeriod: 1h
exchanges: [{"eid":"Futures_Binance","currency":"BTC_USDT"}]
*/

// This source code is subject to the terms of the Mozilla Public License 2.0 at https://mozilla.org/MPL/2.0/
// © Dannnnnnny

//@version=4
strategy(title="Quarterly Returns in Strategies vs Buy & Hold", initial_capital= 1000, overlay=true,default_qty_type = strategy.percent_of_equity, default_qty_value = 100, commission_type = strategy.commission.percent, commission_value = 0.1)
maLength= input(400)

wma= vwma(hl2,maLength)
uptrend= rising(wma, 5)
downtrend= falling(wma,5)

plot(wma)

if uptrend
    strategy.entry("Buy", strategy.long)
else
    strategy.close("Buy")//

///////////////////
// QUARTERLY TABLE //
enableQuarterlyTable = input(title="Enable Quarterly Return table", type=input.bool, defval=false)
enableCompareWithMarket = input(title="Compare with Market Benchmark", type=input.bool, defval=false)
table_position = input(title="Table Position", type=input.string, defval='bottom_right', options=['bottom_right','bottom_left','top_right', 'top_left'])
precision = 2
new_quarter = ceil(month(time)/3)  != ceil(month(time[1])/3)
new_year  = year(time)  != year(time[1])

eq = strategy.equity

bar_pnl = eq / eq[1] - 1
bar_bh = (close-close[1])/close[1]

cur_quarter_pnl = 0.0
cur_year_pnl  = 0.0
cur_quarter_bh = 0.0
cur_year_bh  = 0.0

// Current Quarterly P&L
cur_quarter_pnl := new_quarter ? 0.0 :
                 (1 + cur_quarter_pnl[1]) * (1 + bar_pnl) - 1
cur_quarter_bh := new_quarter ? 0.0 :
                 (1 + cur_quarter_bh[1]) * (1 + bar_bh) - 1

// Current Yearly P&L
cur_year_pnl := new_year ? 0.0 :
                 (1 + cur_year_pnl[1]) * (1 + bar_pnl) - 1
cur_year_bh := new_year ? 0.0 :
                 (1 + cur_year_bh[1]) * (1 + bar_bh) - 1

// Arrays to store Yearly and Quarterly P&Ls
var quarter_pnl  = array.new_float(0)
var quarter_time = array.new_int(0)
var quarter_bh  = array.new_float(0)

var year_pnl  = array.new_float(0)
var year_time = array.new_int(0)
var year_bh  = array.new_float(0)

end_time = false

end_time:= time_close + (time_close - time_close[1]) > timenow or barstate.islastconfirmedhistory

if (not na(cur_quarter_pnl[1]) and (new_quarter or end_time))
    if (end_time[1])
        array.pop(quarter_pnl)
        array.pop(quarter_time)

    array.push(quarter_pnl , cur_quarter_pnl[1])
    array.push(quarter_time, time[1])
    array.push(quarter_bh , cur_quarter_bh[1])

if (not na(cur_year_pnl[1]) and (new_year or end_time))
    if (end_time[1])
        array.pop(year_pnl)
        array.pop(year_time)

    array.push(year_pnl , cur_year_pnl[1])
    array.push(year_time, time[1])
    array.push(year_bh , cur_year_bh[1])

// Quarterly P&L Table
var quarterly_table = table(na)

getCellColor(pnl, bh)  =>
    if pnl > 0
        if bh < 0 or pnl > 2 * bh
            color.new(color.green, transp = 20)
        else if pnl > bh
            color.new(color.green, transp = 50)
        else
            color.new(color.green, transp = 80)
    else
        if bh > 0 or pnl < 2 * bh
            color.new(color.red, transp = 20)
        else if pnl < bh
            color.new(color.red, transp = 50)
        else
            color.new(color.red, transp = 80)

if (end_time and enableQuarterlyTable)
    quarterly_table := table.new(table_position, columns = 14, rows = array.size(year_pnl) + 1, border_width = 1)

    table.cell(quarterly_table, 0,  0, "",     bgcolor = #cccccc)
    table.cell(quarterly_table, 1,  0, "Q1",  bgcolor = #cccccc)
    table.cell(quarterly_table, 2,  0, "Q2",  bgcolor = #cccccc)
    table.cell(quarterly_table, 3,  0, "Q3",  bgcolor = #cccccc)
    table.cell(quarterly_table, 4,  0, "Q4",  bgcolor = #cccccc)
    table.cell(quarterly_table, 5,  0, "Year", bgcolor = #999999)


    for yi = 0 to array.size(year_pnl) - 1
        table.cell(quarterly_table, 0,  yi + 1, tostring(year(array.get(year_time, yi))), bgcolor = #cccccc)

        y_color = getCellColor(array.get(year_pnl, yi), array.get(year_bh, yi))
        table.cell(quarterly_table, 5, yi + 1, enableCompareWithMarket ? tostring(round(array.get(year_pnl, yi) * 100, precision)) + " (" + tostring(round(array.get(year_bh, yi) * 100, precision)) + ")" : tostring(round(array.get(year_pnl, yi) * 100, precision)), bgcolor = y_color, text_color=#bfbfbf)

    for mi = 0 to array.size(quarter_time) - 1
        m_row   = year(array.get(quarter_time, mi))  - year(array.get(year_time, 0)) + 1
        m_col   = ceil(month(array.get(quarter_time, mi)) / 3)
        m_color = getCellColor(array.get(quarter_pnl, mi), array.get(quarter_bh, mi))

        table.cell(quarterly_table, m_col, m_row, enableCompareWithMarket ?  tostring(round(array.get(quarter_pnl, mi) * 100, precision)) + " (" + tostring(round(array.get(quarter_bh, mi) * 100,precision)) +")" : tostring(round(array.get(quarter_pnl, mi) * 100, precision)), bgcolor = m_color, text_color=#bfbfbf)
Detail
https://www.fmz.com/strategy/430588
Last Modified
2023-10-30 15:53:25