
8.4 KiB
Name
唐奇安波道自适应行情策略Donchian-Channel-Adaptive-Trend-Strategy
Author
ChaoZhang
Strategy Description
[trans]
概述
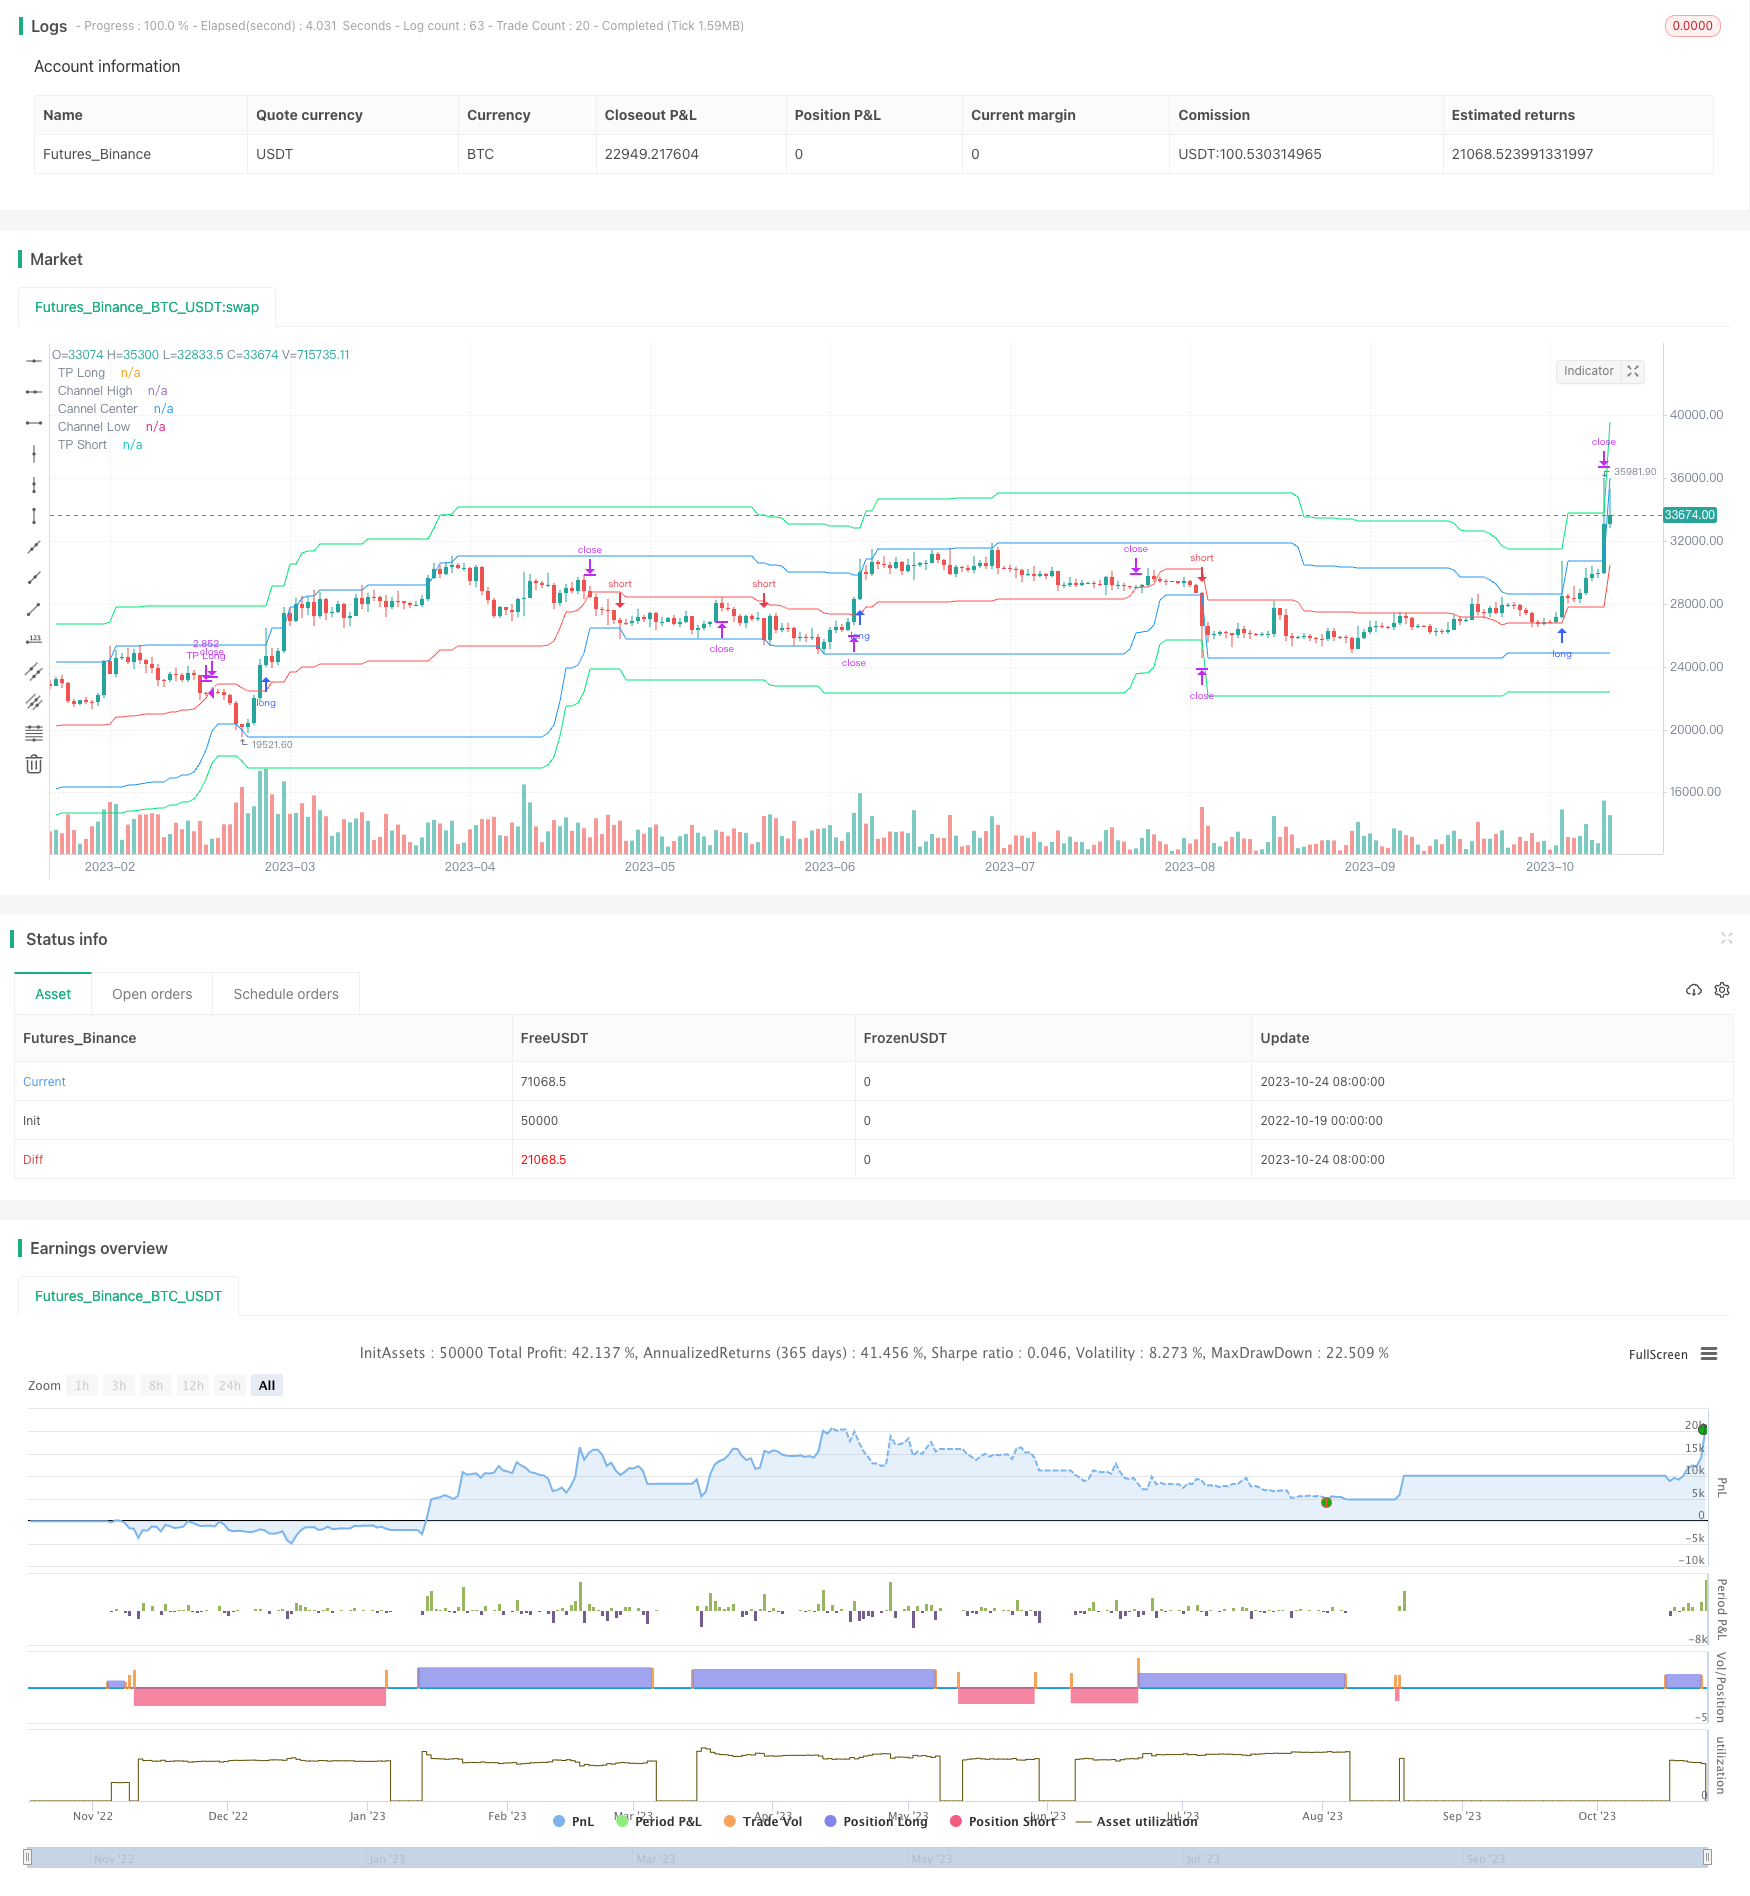
该策略基于唐奇安(Donchian)通道指标实现自适应跟踪市场行情,进行趋势交易。当价格突破唐奇安通道时,进行趋势追踪;当价格回归通道内时,进行止损平仓。
策略原理
-
计算一定周期内的最高价和最低价,形成唐奇安通道。通道中线为期间最高价和最低价的平均值。
-
当价格突破通道上沿时,进行多头开仓;当价格突破通道下沿时,进行空头开仓。
-
开仓后,止损线追踪通道中线;止盈线追踪突破通道一定比例的价格。
-
当价格重新回到通道内时,进行止损平仓。
优势分析
-
该策略利用唐奇安通道判断趋势方向,能快速捕捉市场突破。
-
采用通道中线追踪止损,可以实现盈利的保护。
-
根据用户设置止盈幅度,适当放大盈利空间。
-
能够自适应不同行情环境,如盘整、突破、回调等,灵活调整仓位。
-
策略交易逻辑简单清晰,容易理解掌握。
风险分析
-
策略仅基于突破通道交易,对盘整市场无法有效应对。
-
存在突破假信号的风险,需要结合其他指标验证。
-
停止盈亏设置不当,可能导致过早止损或盈利不足。
-
通道周期设置不当,会影响交易信号的准确性。
-
仓位设置过大,会 amplify 市场波动对账户的影响。
-
机器人交易存在意外中断的风险,需要确保系统稳定可靠。
策略优化
-
结合交易量指标,避免追随虚假突破。
-
增加趋势指标判断,提高开仓信号的准确性。
-
优化止盈止损算法,实现动态调整。
-
根据市场环境实时调整仓位管理策略。
-
研究夜盘、盘前的数据,寻找更优入场时机。
-
测试不同周期Parameter,寻找最佳参数组合。
-
增加模型校验模块,避免过拟合。
总结
该策略整体来说是一个较为简单实用的自适应趋势策略。具有快速捕捉趋势突破,实现盈利保护等特点。同时也存在一些针对盘整行情无效,假突破带来亏损等缺点。未来的优化方向在于结合更多指标过滤信号,动态调整止盈止损策略,从而适应更多市场环境。
||
Overview
This strategy uses Donchian Channel indicator to adaptively track market trends for trend trading. It follows trends when price breaks through the Donchian Channel and cuts losses when price falls back into the channel.
Strategy Logic
-
Calculate highest high and lowest low over a certain period to form the Donchian Channel. The middle line of the channel is the average of highest high and lowest low.
-
Open long position when price breaks above the upper band of the channel. Open short position when price breaks below the lower band.
-
After opening positions, the stop loss tracks the middle line of the channel. Take profit tracks the price breaking out of the channel by a certain percentage.
-
Cut losses and close positions when price falls back into the channel.
Advantage Analysis
-
The strategy utilizes Donchian Channel to determine trend direction and quickly capture breakouts.
-
Using channel middle line for trailing stop loss protects profits.
-
Profit target is amplified according to user defined take profit percentage.
-
It adapts to different market conditions like consolidation, breakout, pullback, etc, and flexibly adjusts position sizing.
-
Simple and clear trading logic, easy to understand and master.
Risk Analysis
-
The strategy only trades breakouts and cannot effectively handle consolidation.
-
Risk of false breakout signals exists, other indicators required for verification.
-
Improper stop loss and take profit settings may lead to premature exiting or insufficient profit.
-
Wrong channel period setting affects accuracy of trading signals.
-
Excessive position sizing amplifies market fluctuation risks.
-
Unexpected robot interruption risks exist, ensure system reliability.
Enhancement Directions
-
Add volume indicators to avoid chasing false breakouts.
-
Increase trend indicator filters to improve entry signal accuracy.
-
Optimize dynamic stop loss and take profit algorithms.
-
Adjust position sizing strategy based on real-time market conditions.
-
Research overnight and pre-market data for better entry timing.
-
Test different parameter periods to find optimal combinations.
-
Add model validation to prevent overfitting.
Conclusion
Overall this is a simple and practical adaptive trend following strategy. It has advantages like quickly capturing trend breakouts and protecting profits. It also has disadvantages like ineffectiveness during consolidation and losses from false breakouts. Future improvements lie in incorporating more signal filtering, dynamic stop loss/take profit, to adapt to more market conditions.
[/trans]
Strategy Arguments
| Argument | Default | Description |
|---|---|---|
| v_input_1 | true | Long |
| v_input_2 | true | Short |
| v_input_3 | 10 | Take profit |
| v_input_4 | 100 | Lot, % |
| v_input_5 | 50 | Price Channel Length |
| v_input_6 | true | Show lines |
| v_input_7 | false | Show Background |
| v_input_8 | true | Show Offset |
| v_input_9 | 1900 | From Year |
| v_input_10 | 2100 | To Year |
| v_input_11 | true | From Month |
| v_input_12 | 12 | To Month |
| v_input_13 | true | From day |
| v_input_14 | 31 | To day |
Source (PineScript)
/*backtest
start: 2022-10-19 00:00:00
end: 2023-10-25 00:00:00
period: 1d
basePeriod: 1h
exchanges: [{"eid":"Futures_Binance","currency":"BTC_USDT"}]
*/

//Noro
//2020

//@version=4
strategy(title = "Noro's Donchian Strategy", shorttitle = "Donchian str", overlay = true, default_qty_type = strategy.percent_of_equity, initial_capital = 100, default_qty_value = 100, commission_value = 0.1)

//Settings
needlong = input(true, defval = true, title = "Long")
needshort = input(true, defval = true, title = "Short")
tp = input(defval = 10, minval = 1, title = "Take profit")
lotsize = input(100, defval = 100, minval = 1, maxval = 10000, title = "Lot, %")
pclen = input(50, minval = 1, title = "Price Channel Length")
showll = input(true, defval = true, title = "Show lines")
showbg = input(false, defval = false, title = "Show Background")
showof = input(true, defval = true, title = "Show Offset")
fromyear = input(1900, defval = 1900, minval = 1900, maxval = 2100, title = "From Year")
toyear = input(2100, defval = 2100, minval = 1900, maxval = 2100, title = "To Year")
frommonth = input(01, defval = 01, minval = 01, maxval = 12, title = "From Month")
tomonth = input(12, defval = 12, minval = 01, maxval = 12, title = "To Month")
fromday = input(01, defval = 01, minval = 01, maxval = 31, title = "From day")
today = input(31, defval = 31, minval = 01, maxval = 31, title = "To day")

//Price Channel
h = highest(high, pclen)
l = lowest(low, pclen)
center = (h + l) / 2
tpl = h * (100 + tp) / 100
tps = l * (100 - tp) / 100

//Lines
tpcol = showll ? color.lime : na
pccol = showll ? color.blue : na
slcol = showll ? color.red : na
offset = showof ? 1 : 0
plot(tpl, offset = offset, color = tpcol, title = "TP Long")
plot(h, offset = offset, color = pccol, title = "Channel High")
plot(center, offset = offset, color = slcol, title = "Cannel Center")
plot(l, offset = offset, color = pccol, title = "Channel Low")
plot(tps, offset = offset, color = tpcol, title = "TP Short")

//Background
size = strategy.position_size
bgcol = showbg == false ? na : size > 0 ? color.lime : size < 0 ? color.red : na
bgcolor(bgcol, transp = 70)

//Trading
truetime = time > timestamp(fromyear, frommonth, fromday, 00, 00) and time < timestamp(toyear, tomonth, today, 23, 59)
lot = 0.0
lot := size != size[1] ? strategy.equity / close * lotsize / 100 : lot[1]
mo = 0
mo := strategy.position_size != 0 ? 0 : high >= center and low <= center ? 1 : mo[1]
if h > 0
    strategy.entry("Long", strategy.long, lot, stop = h, when = strategy.position_size <= 0 and needlong and truetime and mo)
    strategy.exit("TP Long", "Long", limit = tpl, stop = center)
    strategy.entry("Short", strategy.short, lot, stop = l, when = strategy.position_size >= 0 and needshort and truetime and mo)
    strategy.exit("TP Short", "Short", limit = tps, stop = center)
if time > timestamp(toyear, tomonth, today, 23, 59)
    strategy.close_all()
    strategy.cancel("Long")
    strategy.cancel("Short")
Detail
https://www.fmz.com/strategy/430256
Last Modified
2023-10-26 15:58:52