
11 KiB
Name
反转捕捉策略Reversal-Catcher-Strategy
Author
ChaoZhang
Strategy Description
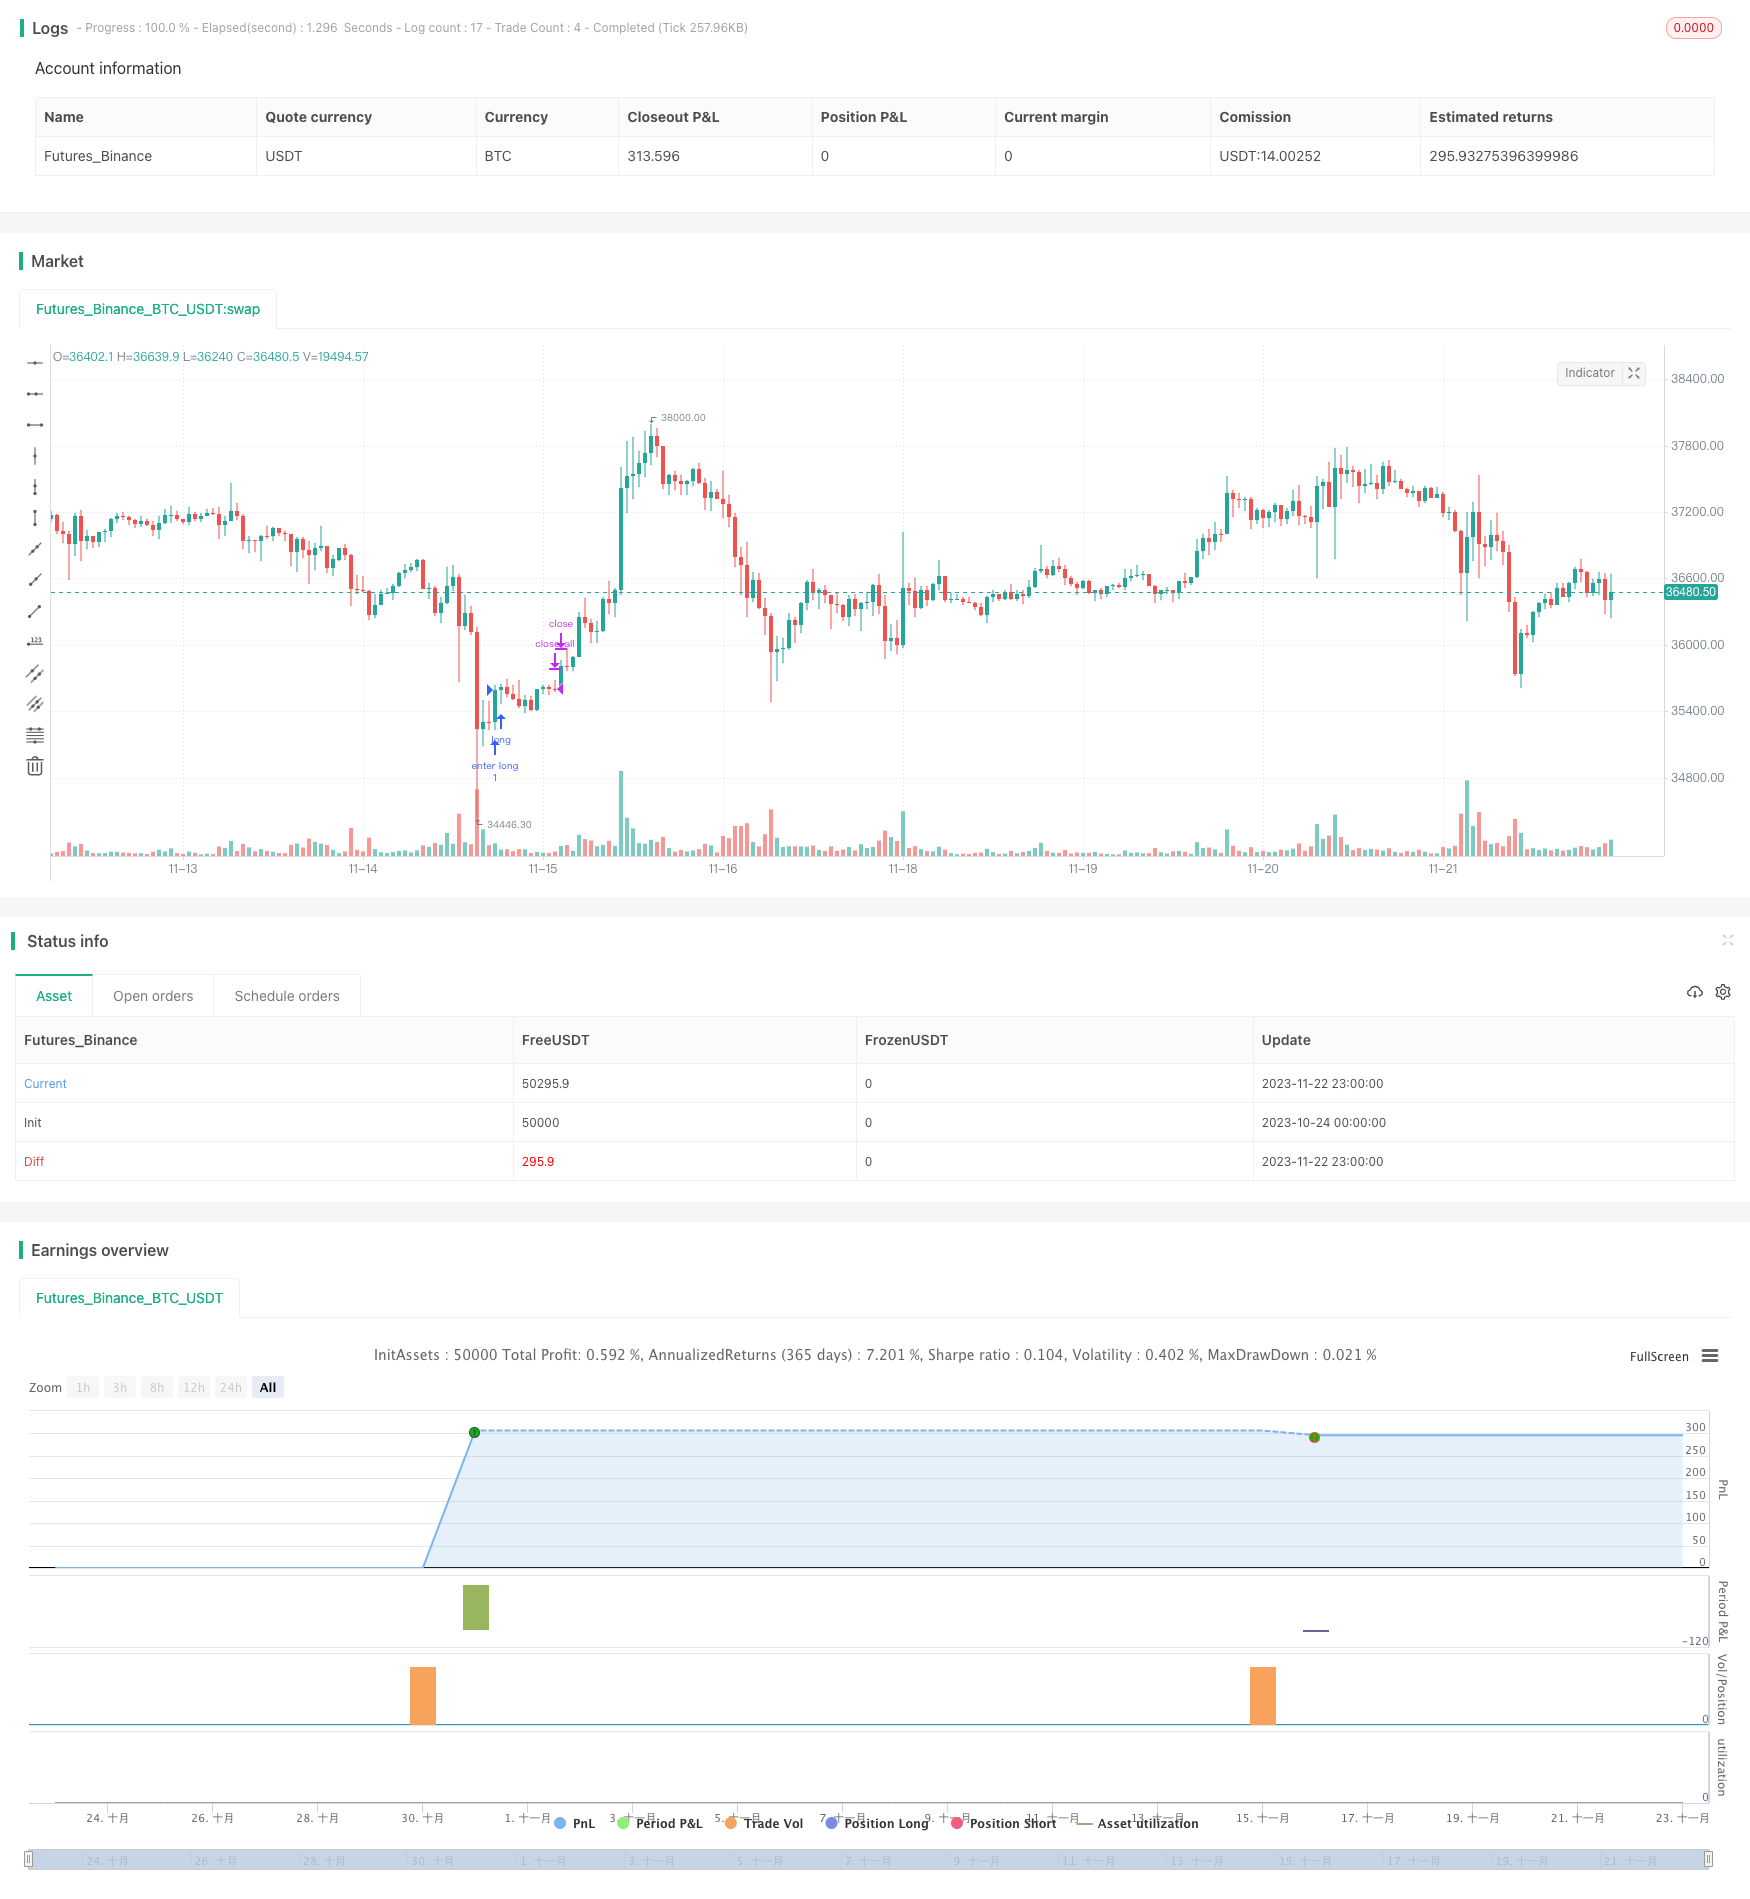 [trans]
概述
反转捕捉策略是一个利用波动率指标布林线与动量指标RSI结合的反转交易策略。它设定了布林线通道和RSI的超买超卖线作为信号,在趋势方向转变的时候寻找反转机会进行交易。
策略原理
该策略使用布林线作为主要技术指标,辅以RSI等动量指标来验证交易信号。具体逻辑是:
- 判断大周期趋势方向,确定是看涨还是看跌。使用50日EMA与21日EMA的金叉死叉来判断。
- 在下跌趋势中,当价格上涨突破布林下轨,同时RSI指标刚刚从超卖区域反弹,出现金叉形态,说明超卖区域已经筑底,判断为买入信号。
- 在上涨趋势中,当价格下跌突破布林上轨,同时RSI指标刚刚从超买区域回落,出现死叉形态,说明超买区域已经开始回调,判断为卖出信号。
- 以上买入和卖出信号必须同时满足,避免假信号。
优势分析
该策略具有以下优势:
- 结合波动率指标和动量指标,信号较为可靠。
- 反转交易风险较小,适合短线操作。
- 程序化规则清晰,容易实现自动交易。
- 结合趋势交易,避免在震荡市场无序开仓。
风险分析
该策略也存在以下风险:
- 布林线通道突破假信号风险,需要RSI指标进行过滤。
- 反转失败的风险,需要及时止损。
- 反转时间点把握不准风险,可能出现提前入场或错过最佳点位。
针对以上风险,可以设置止损位置来控制风险敞口,同时优化参数,调整布林线周期或RSI参数。
优化方向
该策略主要可以从以下几个方向进行优化:
- 优化布林带参数,调整周期长度和标准差大小,寻找最佳参数组合。
- 优化移动平均线周期,确定趋势判断的最佳周期长度。
- 调整RSI参数,寻找最佳超买超卖区域范围。
- 增加其他指标结合,如KDJ、MACD等,丰富系统入场理由。
- 增加机器学习算法,利用AI技术自动寻找最佳参数。
总结
反转捕捉策略整体来说是一个效果较好的短线交易策略。它结合趋势判断和反转信号,既可过滤震荡市场的假信号,有避免在趋势市场与趋势的对冲,风险可控。通过不断优化参数和模型,可以获得更好的策略效果。
||
Overview
The Reversal-Catcher strategy is a reversal trading strategy that utilizes volatility indicator Bollinger Bands and momentum indicator RSI. It sets the Bollinger Bands channel and RSI overbought/oversold lines as signals to find reversal opportunities when trend direction changes.
Strategy Logic
The strategy uses Bollinger Bands as the main technical indicator, combined with RSI and other momentum indicators to verify trading signals. The specific logic is:
- Judge the major trend direction to determine long or short stance. Use 50-day EMA and 21-day EMA golden cross/dead cross to determine trend.
- In a downtrend, when price breaks above the Bollinger Lower Band, and RSI just bounces back from oversold territory, forming a golden cross, it indicates the oversold area has already bottomed, giving a buy signal.
- In a uptrend, when price breaks below the Bollinger Upper Band, and RSI falls back from overbought area, forming a dead cross, it indicates the overbought area starts retracing, giving a sell signal.
- The above buy and sell signals must be triggered together to avoid false signals.
Advantage Analysis
The advantages of this strategy includes:
- Combining volatility and momentum indicators makes signals more reliable.
- Reversal trading has lower risk, suitable for short-term trading.
- Trading rules are programmable for automation trading.
- Combining with trend trading avoids disorder opening during market consolidation.
Risk Analysis
The risks of this strategy includes:
- Bollinger Bands breakout false signal risk, needs RSI filter.
- Failed reversal risk, needs timely stop loss.
- Reversal timing risk, may enter too early or miss best entry point.
To control the risks, we can set stop loss level to limit risk exposure, and optimize parameters like Bollinger Bands period or RSI figures to improve system performance.
Optimization Directions
The main optimization directions includes:
- Optimize Bollinger Bands parameters, adjust period length and standard deviation to find optimum setting.
- Optimize moving averages period to determine best period for trend judgment.
- Adjust RSI parameters to find out best overbought/oversold range.
- Add other indicators like KDJ, MACD to diversify entry signals.
- Introduce machine learning models to find optimized parameters.
Conclusion
The Reversal-Catcher strategy is an effective short-term trading strategy overall. By combining trend filtering and reversal signals, it can avoid false signals during market consolidation and avoid fighting against trend. Through continuous parameters and model optimization, better strategy performance can be achieved.
[/trans]
Strategy Arguments
| Argument | Default | Description |
|---|---|---|
| v_input_1_close | 0 | Source (close, high, low, open etc.: close |
| v_input_int_1 | 20 | Bollinger Period Length, default 20 |
| v_input_float_1 | 1.5 | Bollinger Bands Standard Deviation, default is 1.5 |
| v_input_bool_1 | true | Hide all plots and legends from the chart (default: true) |
| v_input_int_2 | 21 | (?Trends)Fast Exponential Moving Average, default 21 |
| v_input_int_3 | 50 | Slow Exponential Moving Average, default 50 |
| v_input_int_4 | 14 | (?Momentum)RSI Lenght, default 14 |
| v_input_int_5 | 70 | Overbought limit (RSI), default 70 |
| v_input_int_6 | 30 | Oversold limit (RSI), default 30 |
| v_input_string_1 | 0 | (?Trade settings)Trade Type: Both |
| v_input_int_7 | 1500 | Close all trades, default is 3:00 PM, 1500 hours (integer) |
| v_input_bool_2 | false | Markets that never closed (Crypto, Forex, Commodity) |
Source (PineScript)
/*backtest
start: 2023-10-24 00:00:00
end: 2023-11-23 00:00:00
period: 1h
basePeriod: 15m
exchanges: [{"eid":"Futures_Binance","currency":"BTC_USDT"}]
*/

// This is an Open source work. Please do acknowledge in case you want to reuse whole or part of this code.
// Please see the documentation to know the details about this.

//@version=5
strategy('Strategy:Reversal-Catcher', shorttitle="Reversal-Catcher", overlay=true , currency=currency.NONE, initial_capital=100000)

// Inputs
src = input(close, title="Source (close, high, low, open etc.")

BBlength = input.int(defval=20, minval=1,title="Bollinger Period Length, default 20")
BBmult = input.float(defval=1.5, minval=1.0, maxval=4, step=0.1, title="Bollinger Bands Standard Deviation, default is 1.5")

fastMovingAvg = input.int(defval=21, minval=5,title="Fast Exponential Moving Average, default 21", group = "Trends")
slowMovingAvg = input.int(defval=50, minval=8,title="Slow Exponential Moving Average, default 50", group = "Trends")

rsiLenght = input.int(defval=14, title="RSI Lenght, default 14", group = "Momentum")
overbought = input.int(defval=70, title="Overbought limit (RSI), default 70", group = "Momentum")
oversold = input.int(defval=30, title="Oversold limit (RSI), default 30", group = "Momentum")

hide = input.bool(defval=true, title="Hide all plots and legends from the chart (default: true)")


// Trade related
tradeType = input.string(defval='Both', group="Trade settings", title="Trade Type", options=['Both', 'TrendFollowing', 'Reversal'], tooltip="Consider all types of trades? Or only Trend Following or only Reversal? (default: Both).")
endOfDay = input.int(defval=1500, title="Close all trades, default is 3:00 PM, 1500 hours (integer)", group="Trade settings")
mktAlwaysOn = input.bool(defval=false, title="Markets that never closed (Crypto, Forex, Commodity)", tooltip="Some markers never closes. For those cases, make this checked. (Default: off)", group="Trade settings")


// Utils
annotatePlots(txt, val, hide) =>
    if (not hide)
        var l1 = label.new(bar_index, val, txt, style=label.style_label_left, size = size.tiny, textcolor = color.white, tooltip = txt)
        label.set_xy(l1, bar_index, val)

/////////////////////////////// Indicators /////////////////////
vwap = ta.vwap(src)
plot(hide ? na : vwap, color=color.purple, title="VWAP", style = plot.style_line)
annotatePlots('VWAP', vwap, hide)

// Bollinger Band of present time frame
[BBbasis, BBupper, BBlower] = ta.bb(src, BBlength, BBmult)
p1 = plot(hide ? na : BBupper, color=color.blue,title="Bollinger Bands Upper Line")
p2 = plot(hide ? na : BBlower, color=color.blue,title="Bollinger Bands Lower Line")
p3 = plot(hide ? na : BBbasis, color=color.maroon,title="Bollinger Bands Width", style=plot.style_circles, linewidth = 1)
annotatePlots('BB-Upper', BBupper, hide)
annotatePlots('BB-Lower', BBlower, hide)
annotatePlots('BB-Base(20-SMA)', BBbasis, hide)

// RSI
rsi = ta.rsi(src, rsiLenght)

// Trend following
ema50 = ta.ema(src, slowMovingAvg)
ema21 = ta.ema(src, fastMovingAvg)
annotatePlots('21-EMA', ema21, hide)
annotatePlots('50-EMA', ema50, hide)


// Trend conditions
upTrend = ema21 > ema50
downTrend = ema21 < ema50


// Condition to check Special Entry: HH_LL
// Long side:
hhLLong = barstate.isconfirmed and (low > low[1]) and (high > high[1]) and (close > high[1])
hhLLShort = barstate.isconfirmed and (low < low[1]) and (high < high[1]) and (close < low[1])

longCond =  barstate.isconfirmed and (high[1] < BBlower[1]) and (close > BBlower) and (close < BBupper) and hhLLong and ta.crossover(rsi, oversold) and downTrend
shortCond = barstate.isconfirmed and (low[1] > BBupper[1]) and (close < BBupper) and (close > BBlower) and hhLLShort and ta.crossunder(rsi, overbought) and upTrend

// Trade execute
h = hour(time('1'), syminfo.timezone)
m = minute(time('1'), syminfo.timezone)
hourVal = h * 100 + m
totalTrades = strategy.opentrades + strategy.closedtrades
if (mktAlwaysOn or (hourVal < endOfDay))
    // Entry
    var float sl = na
    var float target = na
    if (longCond)
        strategy.entry("enter long", strategy.long, 1, limit=na, stop=na, comment="Long[E]")
        sl := low[1]
        target := high >= BBbasis ? BBupper : BBbasis
        alert('Buy:' + syminfo.ticker + ' ,SL:' + str.tostring(math.floor(sl)) + ', Target:' + str.tostring(target), alert.freq_once_per_bar)
    if (shortCond)
        strategy.entry("enter short", strategy.short, 1, limit=na, stop=na, comment="Short[E]")
        sl := high[1]
        target := low <= BBbasis ? BBlower : BBbasis
        alert('Sell:' + syminfo.ticker + ' ,SL:' + str.tostring(math.floor(sl)) + ', Target:' + str.tostring(target), alert.freq_once_per_bar)

    // Exit: target or SL
    if ((close >= target) or (close <= sl))
        strategy.close("enter long", comment=close < sl ? "Long[SL]" : "Long[T]")
    if ((close <= target) or (close >= sl))
        strategy.close("enter short", comment=close > sl ? "Short[SL]" : "Short[T]")
else if (not mktAlwaysOn)
    // Close all open position at the end if Day
    strategy.close_all(comment = "EoD[Exit]", alert_message = "EoD Exit", immediately = true)
Detail
https://www.fmz.com/strategy/433132
Last Modified
2023-11-24 16:43:25