
14 KiB
Name
双EMA黄绿交易系统Trend-Trading-with-Double-EMA-Crossover-System
Author
ChaoZhang
Strategy Description
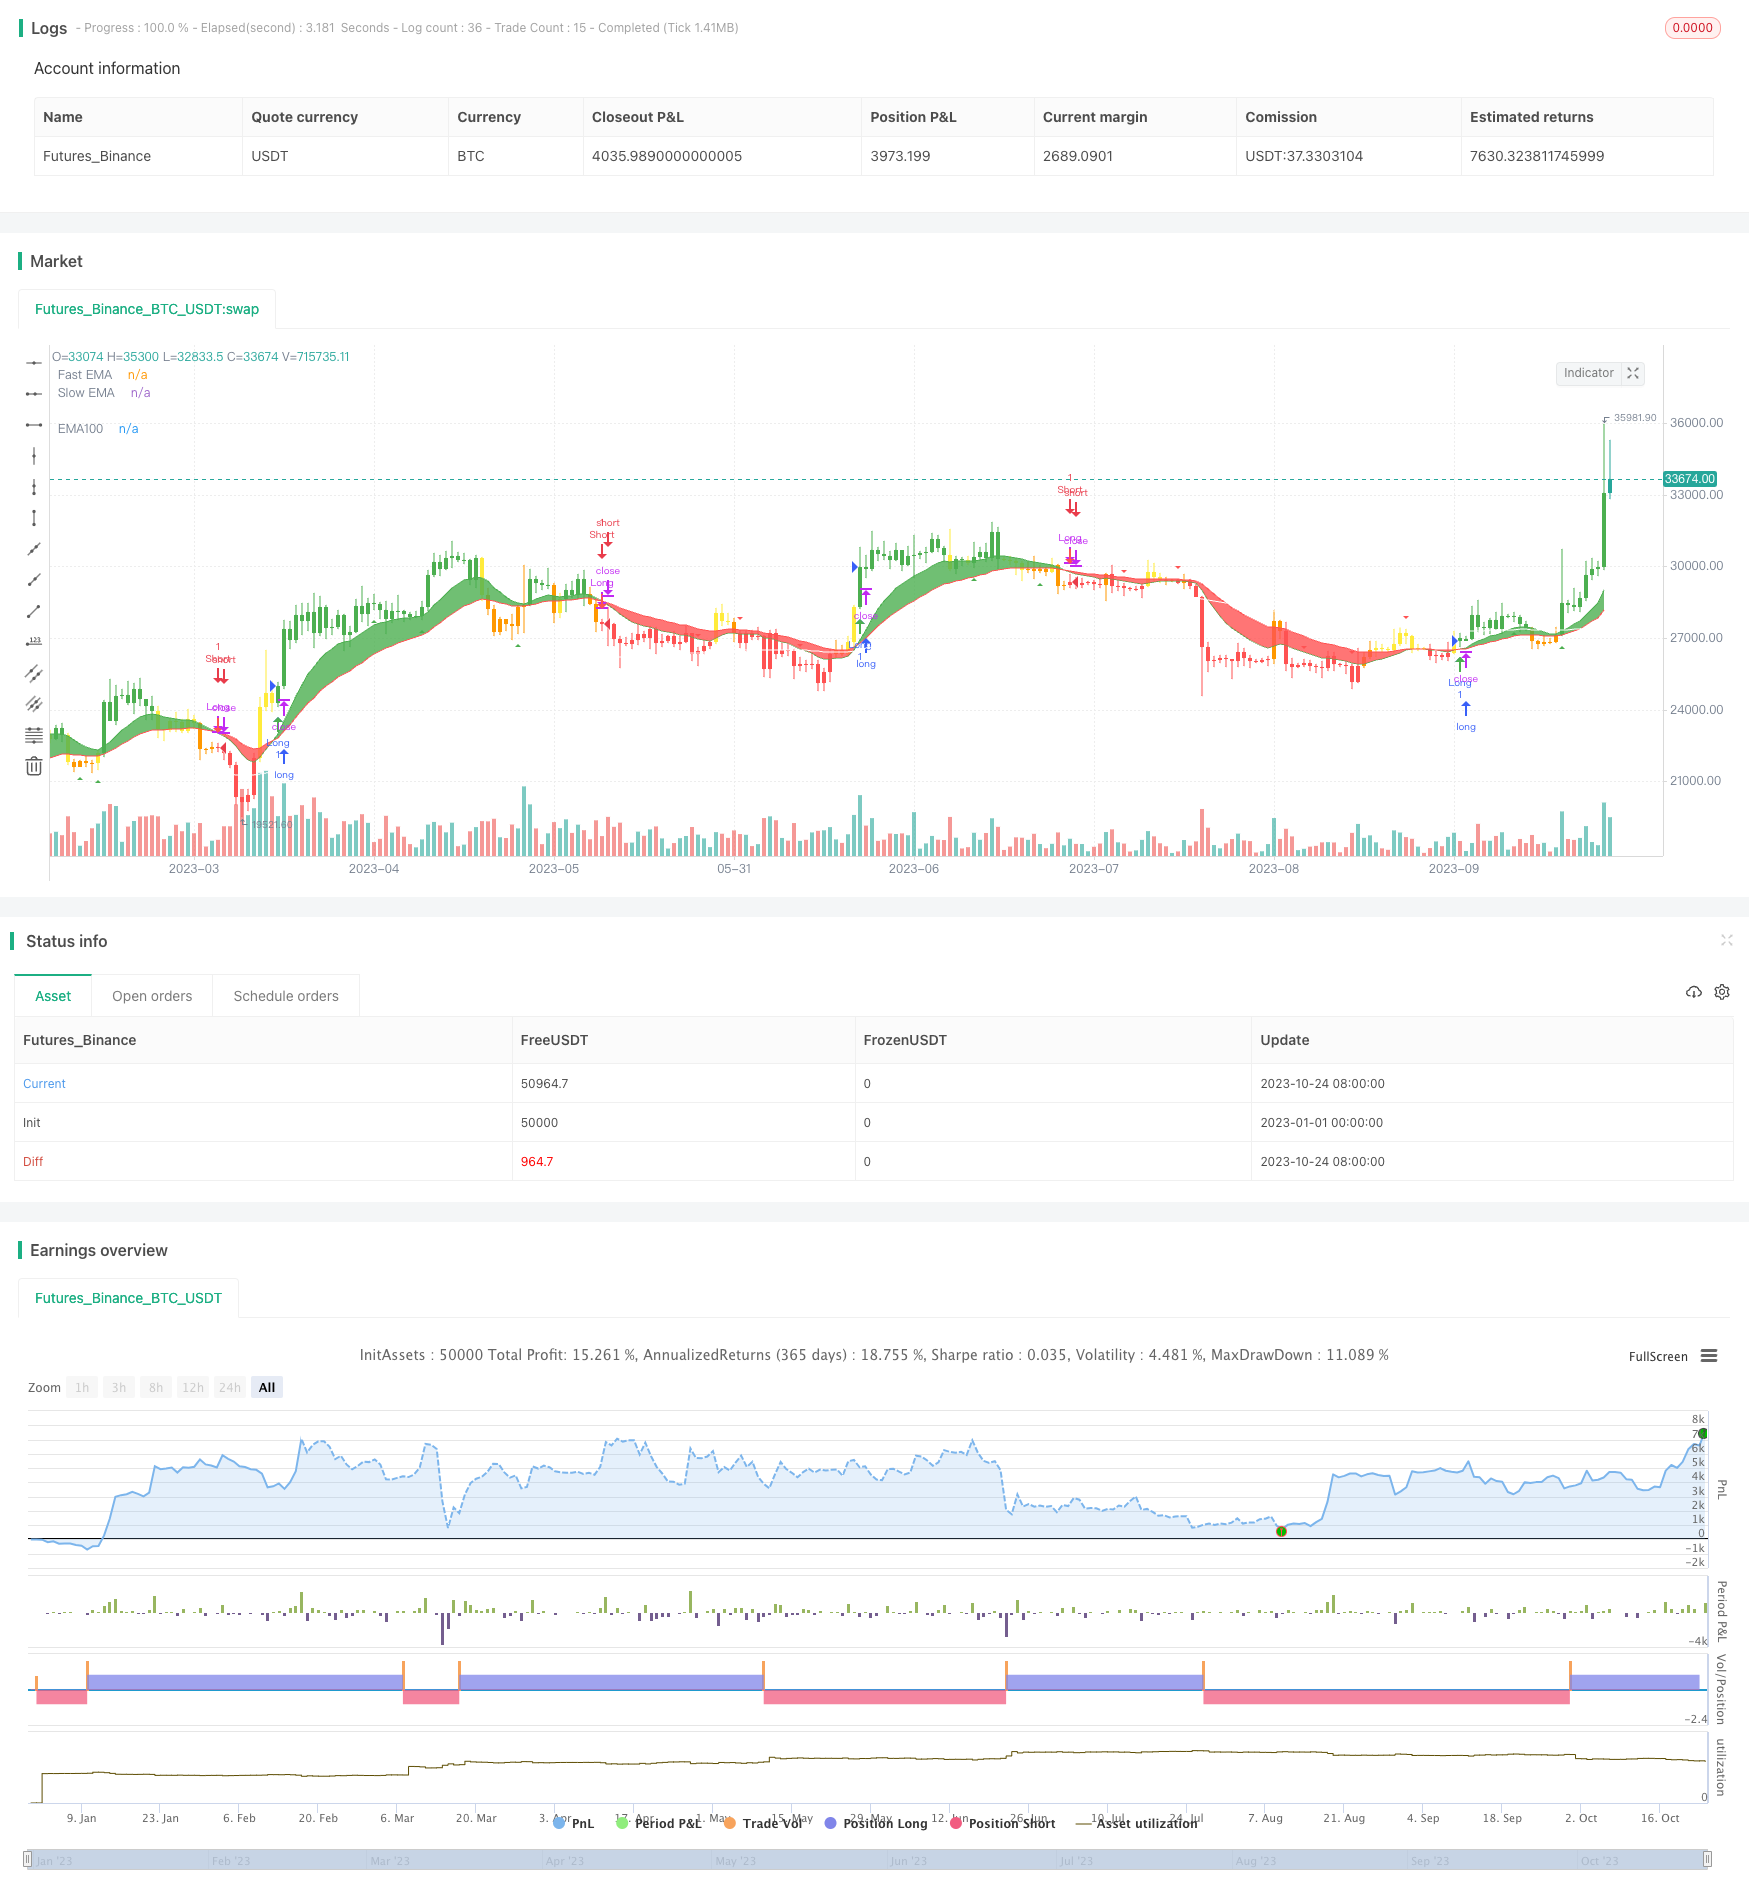
[trans]
概述
双EMA黄绿交易系统是一种基于双指数移动平均线的趋势跟踪交易系统。该系统使用两条不同周期的EMA均线,根据价格与EMA均线的关系来判断目前的趋势方向并作出交易决策。该系统逻辑简单,容易操作,能很好地捕捉市场趋势,适合中长线投资者使用。
策略原理
该策略主要依赖两条EMA均线,分别是一条较快周期的EMA均线和一条较慢周期的EMA均线。当快EMA在慢EMA之上时,视为bullish;当快EMA在慢EMA之下时,视为bearish。
根据价格与两条EMA均线的关系,可以将K线分为不同的交易区域:
-
当快EMA在慢EMA上方,而价格在快EMA之上时(G1),为强势买入区域,此时可以买入。
-
当快EMA在慢EMA下方,而价格在快EMA之下时(R1),为强势卖出区域,此时可以卖出。
-
当快慢EMA交叉时,根据价格与两EMA的关系,可划分黄色(预警)和橙色(观望)区域。这两个区域代表趋势转折的可能,需要结合其他区域和其他指标来决定交易。
根据价格在不同交易区域的变化,该策略会发出买入和卖出信号。在强势区域G1和R1,策略会直接产生信号;在预警和观望区域,则需要其他指标确认。
此外,该策略还引入了StochRSI来辅助判断买卖时机。StochRSI的超买超卖情况可作为额外的买入卖出信号。
策略优势
-
策略逻辑简单清晰,容易理解和实现;
-
基于趋势运行,能够有效捕捉中长线趋势;
-
区分强势区域和违背趋势的预警/观望区域,交易信号比较可靠;
-
结合StochRSI,可以更准确判定买卖时机。
策略风险
-
纯趋势系统,在没有明确趋势的市场中交易效果可能不佳;
-
EMA周期设置不当可能导致虚假信号;
-
预警和观望区域交易风险较大,需要审慎对待;
-
未考虑止损导致亏损扩大的风险。
可以采用以下方法来降低风险:
-
选择有明显趋势的品种,在趋势较弱时暂停交易;
-
优化EMA周期参数,降低虚假信号概率;
-
在预警和观望区域引入其他指标进行确认,减少交易风险;
-
设置止损点,以控制单笔亏损。
策略优化方向
该策略可以从以下几个方面进行优化:
-
引入更多指标进行确认,如MACD、KDJ等,提高信号质量;
-
在交易区域引入过滤条件,如交易量放大,提高trades的成功率;
-
根据市场情况动态调整EMA参数,优化参数设定;
-
增加止损策略,在亏损达到一定比例时止损;
-
优化资金管理,设定合理的仓位管理;
-
在不同的品种上测试优化,寻找最佳参数组合。
通过引入更多辅助判断指标、动态参数优化、止损策略等提高系统稳定性,从资金管理等角度降低风险,该策略可以得到更好的交易效果。
总结
双EMA黄绿交易系统是一个基于双EMA均线比较的趋势跟踪交易系统。它区分不同的交易区域,根据价格与EMA均线关系判断趋势方向并产生交易信号,是一个逻辑清晰、易于实现的趋势跟踪系统。该策略有效捕捉趋势、交易规则简单直观等优点,但也存在一定风险。通过引入辅助指标、動态优化参数、设置止损以及优化资金管理等方式,可以降低风险并进一步提高系统的稳定性和盈利能力。总体来说,双EMA黄绿交易系统是一个非常适合中长线投资者使用的趋势跟踪系统。
||
Overview
The Double EMA Crossover system is a trend following trading system based on two exponential moving averages (EMAs). It uses two EMAs with different periods to determine the current trend direction and generate trading signals accordingly. With its simple logic and easy implementation, this system can capture market trends effectively and is suitable for medium to long term traders.
How It Works
The core of this system relies on two EMAs, one faster EMA and one slower EMA. When the fast EMA is above the slow EMA, it is considered bullish. When the fast EMA is below the slow EMA, it is considered bearish.
Based on the price's relationship with the two EMAs, the bars can be categorized into different trading zones:
-
When fast EMA is above slow EMA and price is above fast EMA (G1), it is a strong buy zone, a long position can be taken here.
-
When fast EMA is below slow EMA and price is below fast EMA (R1), it is a strong sell zone, a short position can be taken here.
-
When the two EMAs cross, the warning (yellow) and transition (orange) zones are determined based on the price's relationship with the two EMAs. These zones indicate potential trend shifts and trades should be taken with caution using additional indicators.
Trading signals are generated when price moves across different zones. In the strong zones G1 and R1, signals can be directly taken. In warning and transition zones, additional indicator confirmation is required.
StochRSI is also implemented to assist with identifying potential entry and exit points. Oversold and overbought readings from StochRSI can provide additional buy and sell signals.
Advantages
-
Simple and clean logic that is easy to understand and implement
-
Effectively catches medium to long term trends
-
Distinguishes strong zones from warning/transition zones, producing reliable trade signals
-
StochRSI inclusion further improves entry and exit timing
Risks
-
As a pure trend following system, performance may suffer in non-trending markets
-
Inappropriate EMA period settings may cause false signals
-
Warning and transition zones carry higher trading risks and should be treated with caution
-
Lack of stop loss may lead to accentuated losses
The risks can be reduced by:
-
Selecting strongly trending instruments and pausing trading when trend is weak
-
Optimizing EMA periods to minimize false signals
-
Introducing additional indicators for confirmation in warning/transition zones
-
Implementing stop loss to control loss per trade
Enhancement Opportunities
The system can be further improved in the following areas:
-
Incorporate more indicators like MACD, KDJ for signal confirmation
-
Add filters such as volume expansion in trading zones to improve trade success rate
-
Dynamically adjust EMA periods based on market conditions for optimized parameters
-
Implement stop loss strategies to exit trades at certain loss percentages
-
Optimize position sizing and money management
-
Test and fine tune parameters across different instruments to find best configurations
By introducing more signal confirmation, dynamic parameter optimization, stop loss, and proper money management, the system's robustness can be improved and risks reduced for better results.
Conclusion
The Double EMA Crossover system is a trend following system based on comparing two EMAs. It identifies different trading zones based on price's relationship with the EMAs to determine trend direction and generate trading signals. As a system with clear logic and easy implementation, it can effectively capture trends. While risks exist, they can be reduced through auxiliary indicators, dynamic optimization, stop loss, and money management. Overall, the Double EMA Crossover system is a solid trend following system suitable for medium to long term traders.
[/trans]
Strategy Arguments
| Argument | Default | Description |
|---|---|---|
| v_input_1_close | 0 | Source: close |
| v_input_2 | true | Fixed Timeframe |
| v_input_3 | D | Timeframe in |
| v_input_4 | 12 | Fast EMA |
| v_input_5 | 26 | Slow EMA |
| v_input_6 | true | EMA 100 |
| v_input_7 | 2 | Smoothing period (1 = no smoothing) |
| v_input_8 | true | Fill Bar Color |
| v_input_9 | true | Show EMA |
| v_input_10 | true | Show Buy-Sell signal |
| v_input_11 | true | Show Buy-Sell Momentum |
| v_input_12 | false | RSI Smoothing |
| v_input_13 | 5 | StochRSI smooth K |
| v_input_14 | 4 | StochRSI smooth D |
| v_input_15 | 14 | RSI length |
| v_input_16 | 14 | Stochastic length |
| v_input_17_close | 0 | Source for StochasticRSI: close |
| v_input_18 | 20 | Oversold Threshold |
| v_input_19 | 80 | Oversold Threshold |
| v_input_20 | 2009 | From Year |
| v_input_21 | true | From Month |
| v_input_22 | true | From Day |
| v_input_23 | 9999 | To Year |
| v_input_24 | 12 | To Month |
| v_input_25 | 31 | To Day |
Source (PineScript)
/*backtest
start: 2023-01-01 00:00:00
end: 2023-10-25 00:00:00
period: 1d
basePeriod: 1h
exchanges: [{"eid":"Futures_Binance","currency":"BTC_USDT"}]
*/

// This source code is subject to the terms of the Mozilla Public License 2.0 at https://mozilla.org/MPL/2.0/
// © Vvaz_
//base-on CDC ActionZone By Piriya   a simple 2EMA and is most suitable for use with medium volatility market
//@version=4
strategy(title="Vin's Playzone" ,shorttitle="VPz", overlay=true, margin_long=4, margin_short=2)

//variable
srcf = input(title="Source",type=input.source,defval=close)
tffix = input(title="Fixed Timeframe",type=input.bool,defval=true)
tfn = input(title="Timeframe in",type=input.resolution,defval="D")
ema1 = input(title="Fast EMA",type=input.integer,defval=12)
ema2 = input(title="Slow EMA",type=input.integer,defval=26)
ema3 = input(title="EMA 100",type=input.bool,defval=true)
smooter =input(title="Smoothing period (1 = no smoothing)",type=input.integer,defval=2)
fillbar =input(title="Fill Bar Color",type=input.bool,defval=true)
emasw = input(title="Show EMA",type=input.bool,defval=true)
bssw = input(title="Show Buy-Sell signal",type=input.bool,defval=true)
plotmm = input(title="Show Buy-Sell Momentum",type=input.bool,defval=true)
plotmmsm = input(title="RSI Smoothing",type=input.integer,defval=0,minval=0,maxval=2)

//math
xcross =ema(srcf,smooter)
efast = tffix ?  ema(security(syminfo.tickerid,tfn,ema(srcf,ema1), gaps = barmerge.gaps_off,lookahead = barmerge.lookahead_on),smooter) :ema(xcross,ema1)
eslow = tffix ?  ema(security(syminfo.tickerid,tfn,ema(srcf,ema2), gaps = barmerge.gaps_off,lookahead = barmerge.lookahead_on),smooter) :ema(xcross,ema2)
ema3x = ema(xcross,100)


//Zone
Bull = efast > eslow
Bear = efast < eslow

G1 = Bull and xcross > efast //buy
G2 = Bear and xcross > efast and xcross > eslow //pre-buy1
G3 = Bear and xcross > efast and xcross < eslow //pre-buy2

R1 = Bear and xcross < efast //sell
R2 = Bull and xcross < efast and xcross < eslow //pre-sell1
R3 = Bull and xcross < efast and xcross > eslow //pre-sell2

//color
bcl =   G1 ? color.green :  G2 ? color.yellow : G3 ? color.orange :R1 ? color.red :R2 ? color.orange : R3 ? color.yellow : color.black
barcolor(color=fillbar ? bcl : na )

//plots
line1 = plot(ema3 ? ema3x : na ,"EMA100",color=color.white)
line2 = plot(emasw ? efast : na ,"Fast EMA",color=color.green)
line3 = plot(emasw ? eslow : na ,"Slow EMA",color=color.red)
fillcl = Bull ? color.green : Bear ? color.red : color.black
fill(line2,line3,fillcl)

//actions
buywhen = G1 and G1[1]==0
sellwhen = R1 and R1[1]==0

bullish = barssince(buywhen) < barssince(sellwhen)
bearish = barssince(sellwhen) < barssince(buywhen)

buy = bearish[1] and buywhen
sell = bullish[1] and sellwhen

bullbearcl = bullish ? color.green : bearish ? color.red : color.black

//plot trend
plotshape(bssw ? buy : na ,style=shape.arrowup,title="BUY",location=location.belowbar,color=color.green)
plotshape( bssw ? sell : na ,style=shape.arrowdown ,title="Sell",location=location.abovebar,color=color.red)

// Momentum Signal using StochRSI

smoothK = input(5,"StochRSI smooth K",type=input.integer,minval=1)
smoothD = input(4,"StochRSI smooth D",type=input.integer,minval=1)
RSIlen = input(14,"RSI length",type=input.integer,minval=1)
STOlen = input(14,"Stochastic length",type=input.integer,minval=1)
SRsrc = input(close,"Source for StochasticRSI",type=input.source)
OSlel = input(20,"Oversold Threshold",type=input.float,minval=0.00)
OBlel = input(80,"Oversold Threshold",type=input.float,minval=0.00)
rsil = rsi(SRsrc,RSIlen)
K = sma(stoch(rsil,rsil,rsil,STOlen),smoothK)
D = sma(K,smoothD)

buymore = iff( bullish ,iff(D < OSlel and crossover(K,D),	2,	 iff(D > OSlel and crossover(K,D),	 1,0)),0)
sellmore = iff( bearish,iff(D > OBlel and crossunder(K,D),	2,	 iff(D < OBlel and crossunder(K,D),	 1,0)),0)
//plot momentum
plotshape(plotmm ? buymore > plotmmsm ? buymore : na : na ,"Buy More!" ,style=shape.triangleup,location=location.belowbar,color=color.green)
plotshape(plotmm ? sellmore > plotmmsm ? sellmore : na : na ,"Sell More!" ,style=shape.triangledown,location=location.abovebar,color=color.red)


// === INPUT BACKTEST RANGE ===
FromYear  = input(defval = 2009, title = "From Year", minval = 2009)
FromMonth = input(defval = 1, title = "From Month", minval = 1, maxval = 12)
FromDay   = input(defval = 1, title = "From Day", minval = 1, maxval = 31)
ToYear    = input(defval = 9999, title = "To Year", minval = 2009)
ToMonth   = input(defval = 12, title = "To Month", minval = 1, maxval = 12)
ToDay     = input(defval = 31, title = "To Day", minval = 1, maxval = 31)

// === FUNCTION EXAMPLE ===
start     = timestamp(FromYear, FromMonth, FromDay, 00, 00)  // backtest start window
finish    = timestamp(ToYear, ToMonth, ToDay, 23, 59)        // backtest finish window
window()  => time >= start and time <= finish ? true : false // create function "within window of time"

//stratgy excuter
strategy.entry("Long",true,when=window() and buy or buymore)
strategy.close("Long",when=window() and sell or sellmore,comment="TP Long")
strategy.entry("Short",false,when=window() and sell or sellmore)
strategy.close("Short",when=window() and buy or buymore,comment="TP Short")
Detail
https://www.fmz.com/strategy/430276
Last Modified
2023-10-26 17:15:46