
15 KiB
Name
双EMA均线交叉策略Dual-EMA-Crossover-Strategy
Author
ChaoZhang
Strategy Description
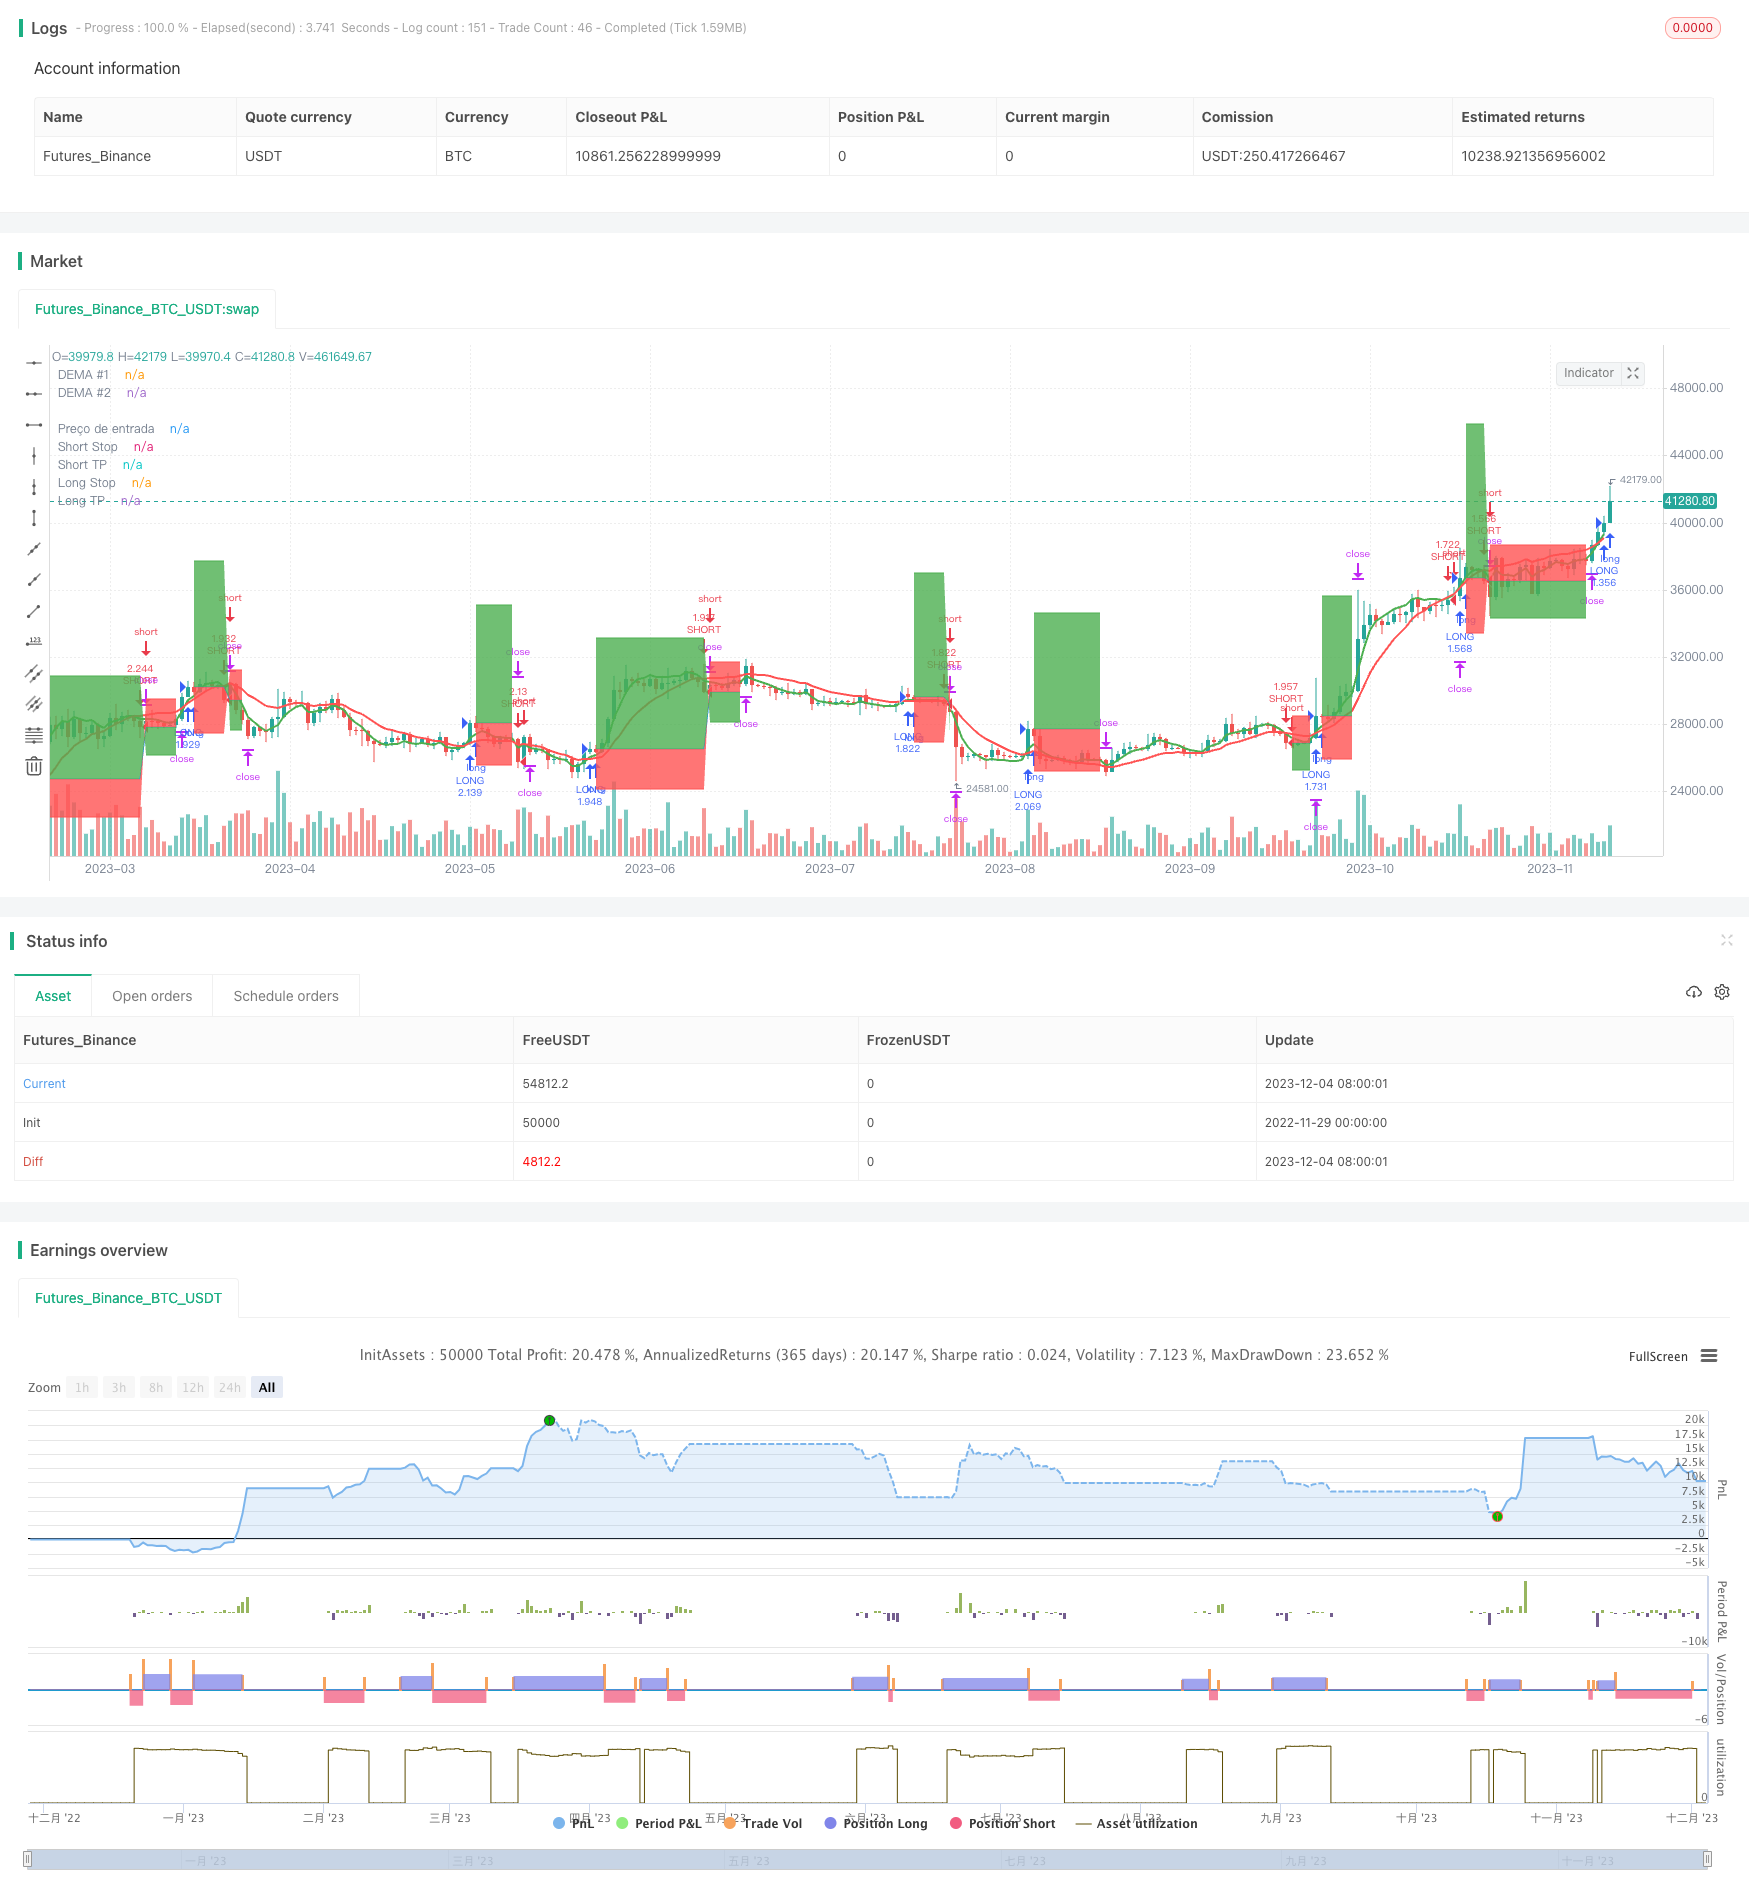 [trans]
概述
双EMA均线交叉策略是一种常用的趋势跟踪策略。该策略使用两个不同周期的EMA均线,当短周期EMA上穿长周期EMA时生成买入信号,当短周期EMA下穿长周期EMA时生成卖出信号,以捕捉价格趋势的变化。
策略原理
该策略的核心逻辑基于EMA均线的“金叉死叉”原理。EMA均线能够有效平滑价格数据,提示趋势方向。短周期EMA线能较快地响应价格变动,而长周期EMA线对噪声相对不敏感,能反映长期趋势。当短周期EMA上穿长周期EMA时,被视为价格上涨势头增强的信号;当短周期EMA下穿长周期EMA时,被视为价格下跌势头加剧的信号。策略根据这一原理发出买入和卖出信号。
具体来说,该策略使用 length1 和 length2 参数设置两个EMA均线的长度。demaVal1 是长度为 length1 的 EMA 均线,demaVal2 是长度为 length2 的 EMA 均线。二者计算方法为:
demaVal1 = EMA(close, length1)
demaVal2 = EMA(close, length2)
其中 EMA() 是计算EMA均线的函数。当 demaVal1 上穿 demaVal2 时生成买入信号 demaCrossover,下穿时生成卖出信号 demaCrossunder。策略根据这两个信号发出交易指令。
策略优势
该策略具有以下优势:
- 策略逻辑简单易懂,容易实现。
- 均线交叉理论成熟,应用广泛。
- 可配置参数长度灵活,适用于不同市场环境。
- 可通过优化参数提高策略效果。
风险及优化
该策略也存在一些风险:
- 当市场不趋势时,EMA交叉信号可能出现频繁的虚假信号。
- 默认参数可能不适用于所有品种,需要根据历史数据针对性优化。
根据以上风险,可从以下几个方面进行优化:
- 调整 EMA 周期参数,适配不同周期行情。
- 增加过滤条件,避免虚假信号。例如拟合优度指标、交易量指标等。
- 结合趋势、支持阻力位等技术指标,提高策略效果。
总结
双EMA均线交叉策略整体来说是一种简单实用的趋势跟踪策略。它承袭了均线交叉分析的成熟理论,在参数调整和过滤条件优化的前提下,可以适用于不同品种的趋势交易,具有良好的应用前景。
||
Overview
The Dual EMA Crossover strategy is a commonly used trend following strategy. It uses two EMA lines with different periods and generates buy signals when the shorter period EMA crosses over the longer period EMA and sell signals when the reverse happens, in order to capture trend changes.
Strategy Logic
The core logic of this strategy is based on the “golden cross” and “death cross” principles of EMA lines. EMA can smooth price data effectively and indicate trend direction. The shorter period EMA responds more quickly to price changes while the longer period EMA is less sensitive to noise and reflects long term trend. When the shorter period EMA crosses over the longer period EMA, it is viewed as a signal that the upside momentum is strengthening. When the reverse happens, it signals accelerating downside momentum. The strategy generates trading signals based on this rationale.
Specifically, this strategy uses the length1 and length2 parameters to set the periods of two EMA lines. demaVal1 is the length1 period EMA and demaVal2 is the length2 period EMA. They are calculated as:
demaVal1 = EMA(close, length1)
demaVal2 = EMA(close, length2)
Where EMA() is the function that calculates the EMA values. When demaVal1 crosses over demaVal2, the buy signal demaCrossover is generated. When the reverse happens, the sell signal demaCrossunder is generated. The strategy sends trading orders based on these two signals.
Advantages
The advantages of this strategy include:
- Simple logic and easy to implement.
- Mature theories of EMA crossovers with wide applications.
- Flexible parameter tuning adaptable to different market environments.
- Further optimization possible to improve strategy performance.
Risks and Enhancement
There are also some risks associated with this strategy:
- Frequent false signals may occur when the market is not trending.
- Default parameters may not fit all instruments and historical optimization is needed.
Based on the above risks, the following aspects could be optimized:
- Adjust EMA period parameters to adapt to market conditions with different cycles.
- Add filter conditions to avoid false signals, e.g. fitness score, volume indicators.
- Incorporate other techniques like trends, support/resistance levels to improve strategy performance.
Conclusion
In conclusion, the Dual EMA Crossover Strategy is a simple yet practical trend following system. By inheriting the mature theories of EMA analysis and with proper parameter tuning and filter condition enhancements, it can be applied to trend trading across different instruments with sound application prospects.
[/trans]
Strategy Arguments
| Argument | Default | Description |
|---|---|---|
| v_input_1_close | 0 | Source Data: close |
| v_input_2 | 8 | Length DEMA #1 |
| v_input_3 | 24 | Length DEMA #2 |
| v_input_4 | false | Length DEMA #3 |
| v_input_5 | false | Usar Trailing Stop? |
| v_input_6 | 9 | (?Stop Loss & Take Profit Settings)Stop Loss Long % |
| v_input_7 | 6 | Stop Loss Short % |
| v_input_8 | 25 | Take Profit Long % 1 |
| v_input_9 | 6 | Take Profit Short % 1 |
| v_input_10 | true | (?BackTest Period)Start Date |
| v_input_11 | true | Start Month |
| v_input_12 | 2018 | Start Year |
| v_input_13 | 31 | End Date |
| v_input_14 | 12 | End Month |
| v_input_15 | 2031 | End Year |
Source (PineScript)
/*backtest
start: 2022-11-29 00:00:00
end: 2023-12-05 00:00:00
period: 1d
basePeriod: 1h
exchanges: [{"eid":"Futures_Binance","currency":"BTC_USDT"}]
*/

// This source code is subject to the terms of the Mozilla Public License 2.0 at https://mozilla.org/MPL/2.0/
// © zeguela
//@version=4
strategy(title="ZEGUELA DEMABOT", commission_value=0.063, commission_type=strategy.commission.percent, initial_capital=100, default_qty_value=90, default_qty_type=strategy.percent_of_equity, overlay=true, process_orders_on_close=true)

// Step 1. Script settings

// Input options
srcData = input(title="Source Data", type=input.source, defval=close)

// Length settings
len1 = input(title="Length DEMA #1", type=input.integer, defval=8, minval=1)
len2 = input(title="Length DEMA #2", type=input.integer, defval=24, minval=0)
len3 = input(title="Length DEMA #3", type=input.integer, defval=0, minval=0)

// Step 2. Calculate indicator values
// Function that calculates the DEMA
DEMA(series, length) =>
    if (length > 0)
        emaValue = ema(series, length)
        2 * emaValue - ema(emaValue, length)
    else
        na

// Calculate the DEMA values
demaVal1 = DEMA(srcData, len1)
demaVal2 = DEMA(srcData, len2)
demaVal3 = DEMA(srcData, len3)

// Step 3. Determine indicator signals
// See if there's a DEMA crossover
demaCrossover = if (len2 > 0) and (len3 > 0)
    crossover(demaVal1, demaVal2) and (demaVal3 > demaVal3[1])
else
    if (len2 > 0) and (len3 == 0)
        crossover(demaVal1, demaVal2)
    else
        if (len3 > 0) and (len2 == 0)
            crossover(demaVal1, demaVal3)
        else
            crossover(close, demaVal1)

// Check if there's a DEMA crossunder
demaCrossunder = if (len2 > 0) and (len3 > 0)
    crossunder(demaVal1, demaVal2) and (demaVal3 < demaVal3[1])
else
    if (len2 > 0) and (len3 == 0)
        crossunder(demaVal1, demaVal2)
    else
        if (len3 > 0) and (len2 == 0)
            crossunder(demaVal1, demaVal3)
        else
            crossunder(close, demaVal1)

// Step 4. Output indicator data
// Plot DEMAs on the chart
plot(series=demaVal1, color=color.green, linewidth=2, title="DEMA #1")
plot(series=demaVal2, color=color.red, linewidth=2, title="DEMA #2")
plot(series=demaVal3, color=color.fuchsia, linewidth=2, title="DEMA #3")

//TRAILING STOP CODE
a = input(title="Usar Trailing Stop?", type=input.bool, defval=false)

stopPerlong = input(9.0, title='Stop Loss Long %', type=input.float, group="Stop Loss & Take Profit Settings") / 100
stopPershort = input(6.0, title='Stop Loss Short %', type=input.float, group="Stop Loss & Take Profit Settings") / 100
take1Perlong = input(25.0, title='Take Profit Long % 1', type=input.float, group="Stop Loss & Take Profit Settings") / 100
take1Pershort = input(6.0, title='Take Profit Short % 1', type=input.float, group="Stop Loss & Take Profit Settings") / 100

// Determine stop loss price
longStopPrice  = strategy.position_avg_price * (1 - stopPerlong)
shortStopPrice = strategy.position_avg_price * (1 + stopPershort)
longTake1Price = strategy.position_avg_price * (1 + take1Perlong)
shortTake1Price = strategy.position_avg_price * (1 - take1Pershort)

// Determine trail stop loss prices

longStopPriceTrail = 0.0

longStopPriceTrail := if (strategy.position_size > 0)
    stopValue = close * (1 - stopPerlong)
    max(stopValue, longStopPriceTrail[1])
else
    0

// Determine trailing short price
shortStopPriceTrail = 0.0

shortStopPriceTrail := if (strategy.position_size < 0)
    stopValue = close * (1 + stopPershort)
    min(stopValue, shortStopPriceTrail[1])
else
    999999

//calcular qual stop usar
longStop = a ? longStopPriceTrail : longStopPrice
shortStop = a ? shortStopPriceTrail : shortStopPrice


//calcula o valor do stop e TP pra lançar no alerta
longStopEntrada = close  * (1 - stopPerlong)
shortStopEntrada = close  * (1 + stopPershort)
longTPEntrada = close * (1 + take1Perlong)
shortTPEntrada = close * (1 - take1Pershort)

//armazena o preço de entrada e valor do SL e TP

price_entryL = 0.0
price_entryL := na(price_entryL) ? na : price_entryL[1]
price_entryS = 0.0
price_entryS := na(price_entryS) ? na : price_entryS[1]
stopL = 0.0
stopL := na(stopL) ? na : stopL[1]
stopS = 0.0
stopS := na(stopS) ? na : stopS[1]
takeL = 0.0
takeL := na(takeL) ? na : takeL[1]
takeS = 0.0
takeS := na(takeS) ? na : takeS[1]

if (demaCrossover)
    price_entryL := close
    stopL := close  * (1 - stopPerlong)
    takeL := close * (1 + take1Perlong)

if (demaCrossunder)
    price_entryS := close
    stopS := close  * (1 + stopPershort)
    takeS := close * (1 - take1Pershort)

resultadoL = ((close - price_entryL)/price_entryL) * 100
resultadoLexit = "(SL = 1% e TP = 0,5%)"
resultadoS = ((price_entryS - close)/price_entryS) * 100
resultadoSexit = "(SL = 1% e TP = 0,5)%"
// Make input options that configure backtest date range
_startDate = input(title="Start Date", type=input.integer,
     defval=1, minval=1, maxval=31, group="BackTest Period")
_startMonth = input(title="Start Month", type=input.integer,
     defval=1, minval=1, maxval=12, group="BackTest Period")
_startYear = input(title="Start Year", type=input.integer,
     defval=2018, minval=1800, maxval=2100, group="BackTest Period")

_endDate = input(title="End Date", type=input.integer,
     defval=31, minval=1, maxval=31, group="BackTest Period")
_endMonth = input(title="End Month", type=input.integer,
     defval=12, minval=1, maxval=12, group="BackTest Period")
_endYear = input(title="End Year", type=input.integer,
     defval=2031, minval=1800, maxval=2100, group="BackTest Period")

// Look if the close time of the current bar
// falls inside the date range
_inDateRange = (time >= timestamp(syminfo.timezone, _startYear,
         _startMonth, _startDate, 0, 0)) and
     (time < timestamp(syminfo.timezone, _endYear, _endMonth, _endDate, 0, 0))

//Alert configuration

_alertMessageOpenLong="OpenLong"
_alertMessageCloseLong="CloseLong"
_alertmessageExitLong="ExitLong - TP/SL"

_alertMessageOpenShort="OpenShort"
_alertMessageCloseShort="CloseShort"
_alertMessageExitShort="ExitShort - TP/SL"

if (_inDateRange)
    //ENTER SOME SETUP TRADES FOR TSL EXAMPLE
    if (demaCrossover)
        strategy.entry("LONG", strategy.long, comment = _alertMessageOpenLong)
    if (demaCrossunder)
        strategy.entry("SHORT", strategy.short, comment = _alertMessageOpenShort)
    //EXIT TRADE @ TSL
    if strategy.position_size > 0
        strategy.exit("TP/SL", "LONG", stop=longStop, limit=longTake1Price, comment=_alertmessageExitLong, alert_message=_alertmessageExitLong)
    if strategy.position_size < 0
        strategy.exit("TP/SL", "SHORT", stop=shortStop, limit=shortTake1Price, comment =_alertMessageExitShort, alert_message=_alertMessageExitShort)


//Look & Feel - Plot stop loss and take profit areas
p1=plot(strategy.position_avg_price, color=color.blue, style=plot.style_linebr, linewidth=1, title="Preço de entrada")
p2=plot(series=strategy.position_size > 0 ? longStop : na, color=color.red, style=plot.style_linebr, linewidth=1, title="Long Stop")
p3=plot(series=strategy.position_size > 0 ? longTake1Price : na, color=color.green, style=plot.style_linebr, linewidth=1, title="Long TP")
p4=plot(series=strategy.position_size < 0 ? shortStop : na, color=color.red, style=plot.style_linebr, linewidth=1, title="Short Stop")
p5=plot(series=strategy.position_size < 0 ? shortTake1Price : na, color=color.green, style=plot.style_linebr, linewidth=1, title="Short TP")
fill(p1, p2, color=color.red)
fill(p1, p3, color=color.green)
fill(p1, p4, color=color.red)
fill(p1, p5, color=color.green)

// Insert label with value
stopLossOnLong = "Stop Loss = " + tostring(longStop)
stopLossOnShort = "Stop Loss = " + tostring(shortStop)
takeprofitOnLong = "Take Profit = " + tostring(longTake1Price)
takeprofitOnShort = "Take Profit = " + tostring(shortTake1Price)
precoentrada = "Entrada = " + tostring(strategy.position_avg_price)

var label FinalLabelpriceL = na
var label FinalLabelpriceS = na
var label slFinalLabelL = na
var label slFinalLabelS = na
var label slFinalLabelTPL = na
var label slFinalLabelTPS = na


//Draw entry and stop loss lines and labels

if strategy.position_size > 0

    //write the price above the end of the stoploss line
    slFinalLabelL := label.new(bar_index, longStop, stopLossOnLong, style=label.style_none, size=size.normal, textcolor=color.red)
    slFinalLabelTPL := label.new(bar_index, longTake1Price, takeprofitOnLong, style=label.style_none, size=size.normal, textcolor=color.green)
    FinalLabelpriceL := label.new(bar_index, strategy.position_avg_price, precoentrada, style=label.style_none, size=size.normal, textcolor=color.blue)

    // Delete previous label when there is a consecutive new high, as there's no line plot in that case.
    if strategy.position_size > 0[1]
        label.delete(slFinalLabelL[1])
        label.delete(slFinalLabelTPL[1])
        label.delete(FinalLabelpriceL[1])

if strategy.position_size < 0

    //write the price above the end of the stoploss line
    slFinalLabelS := label.new(bar_index, shortStop, stopLossOnShort, style=label.style_none, size=size.normal, textcolor=color.red)
    slFinalLabelTPS := label.new(bar_index, shortTake1Price, takeprofitOnShort, style=label.style_none, size=size.normal, textcolor=color.green)
    FinalLabelpriceS := label.new(bar_index, strategy.position_avg_price, precoentrada, style=label.style_none, size=size.normal, textcolor=color.blue)

    // Delete previous label when there is a consecutive new high, as there's no line plot in that case.
    if strategy.position_size < 0[1]
        label.delete(slFinalLabelS[1])
        label.delete(slFinalLabelTPS[1])
        label.delete(FinalLabelpriceS[1])


// Exit open market position when date range ends
if (not _inDateRange)
    strategy.close_all()
Detail
https://www.fmz.com/strategy/434488
Last Modified
2023-12-06 18:22:16