
11 KiB
Name
双重随机策略Dual-Stochastics-Strategy
Author
ChaoZhang
Strategy Description
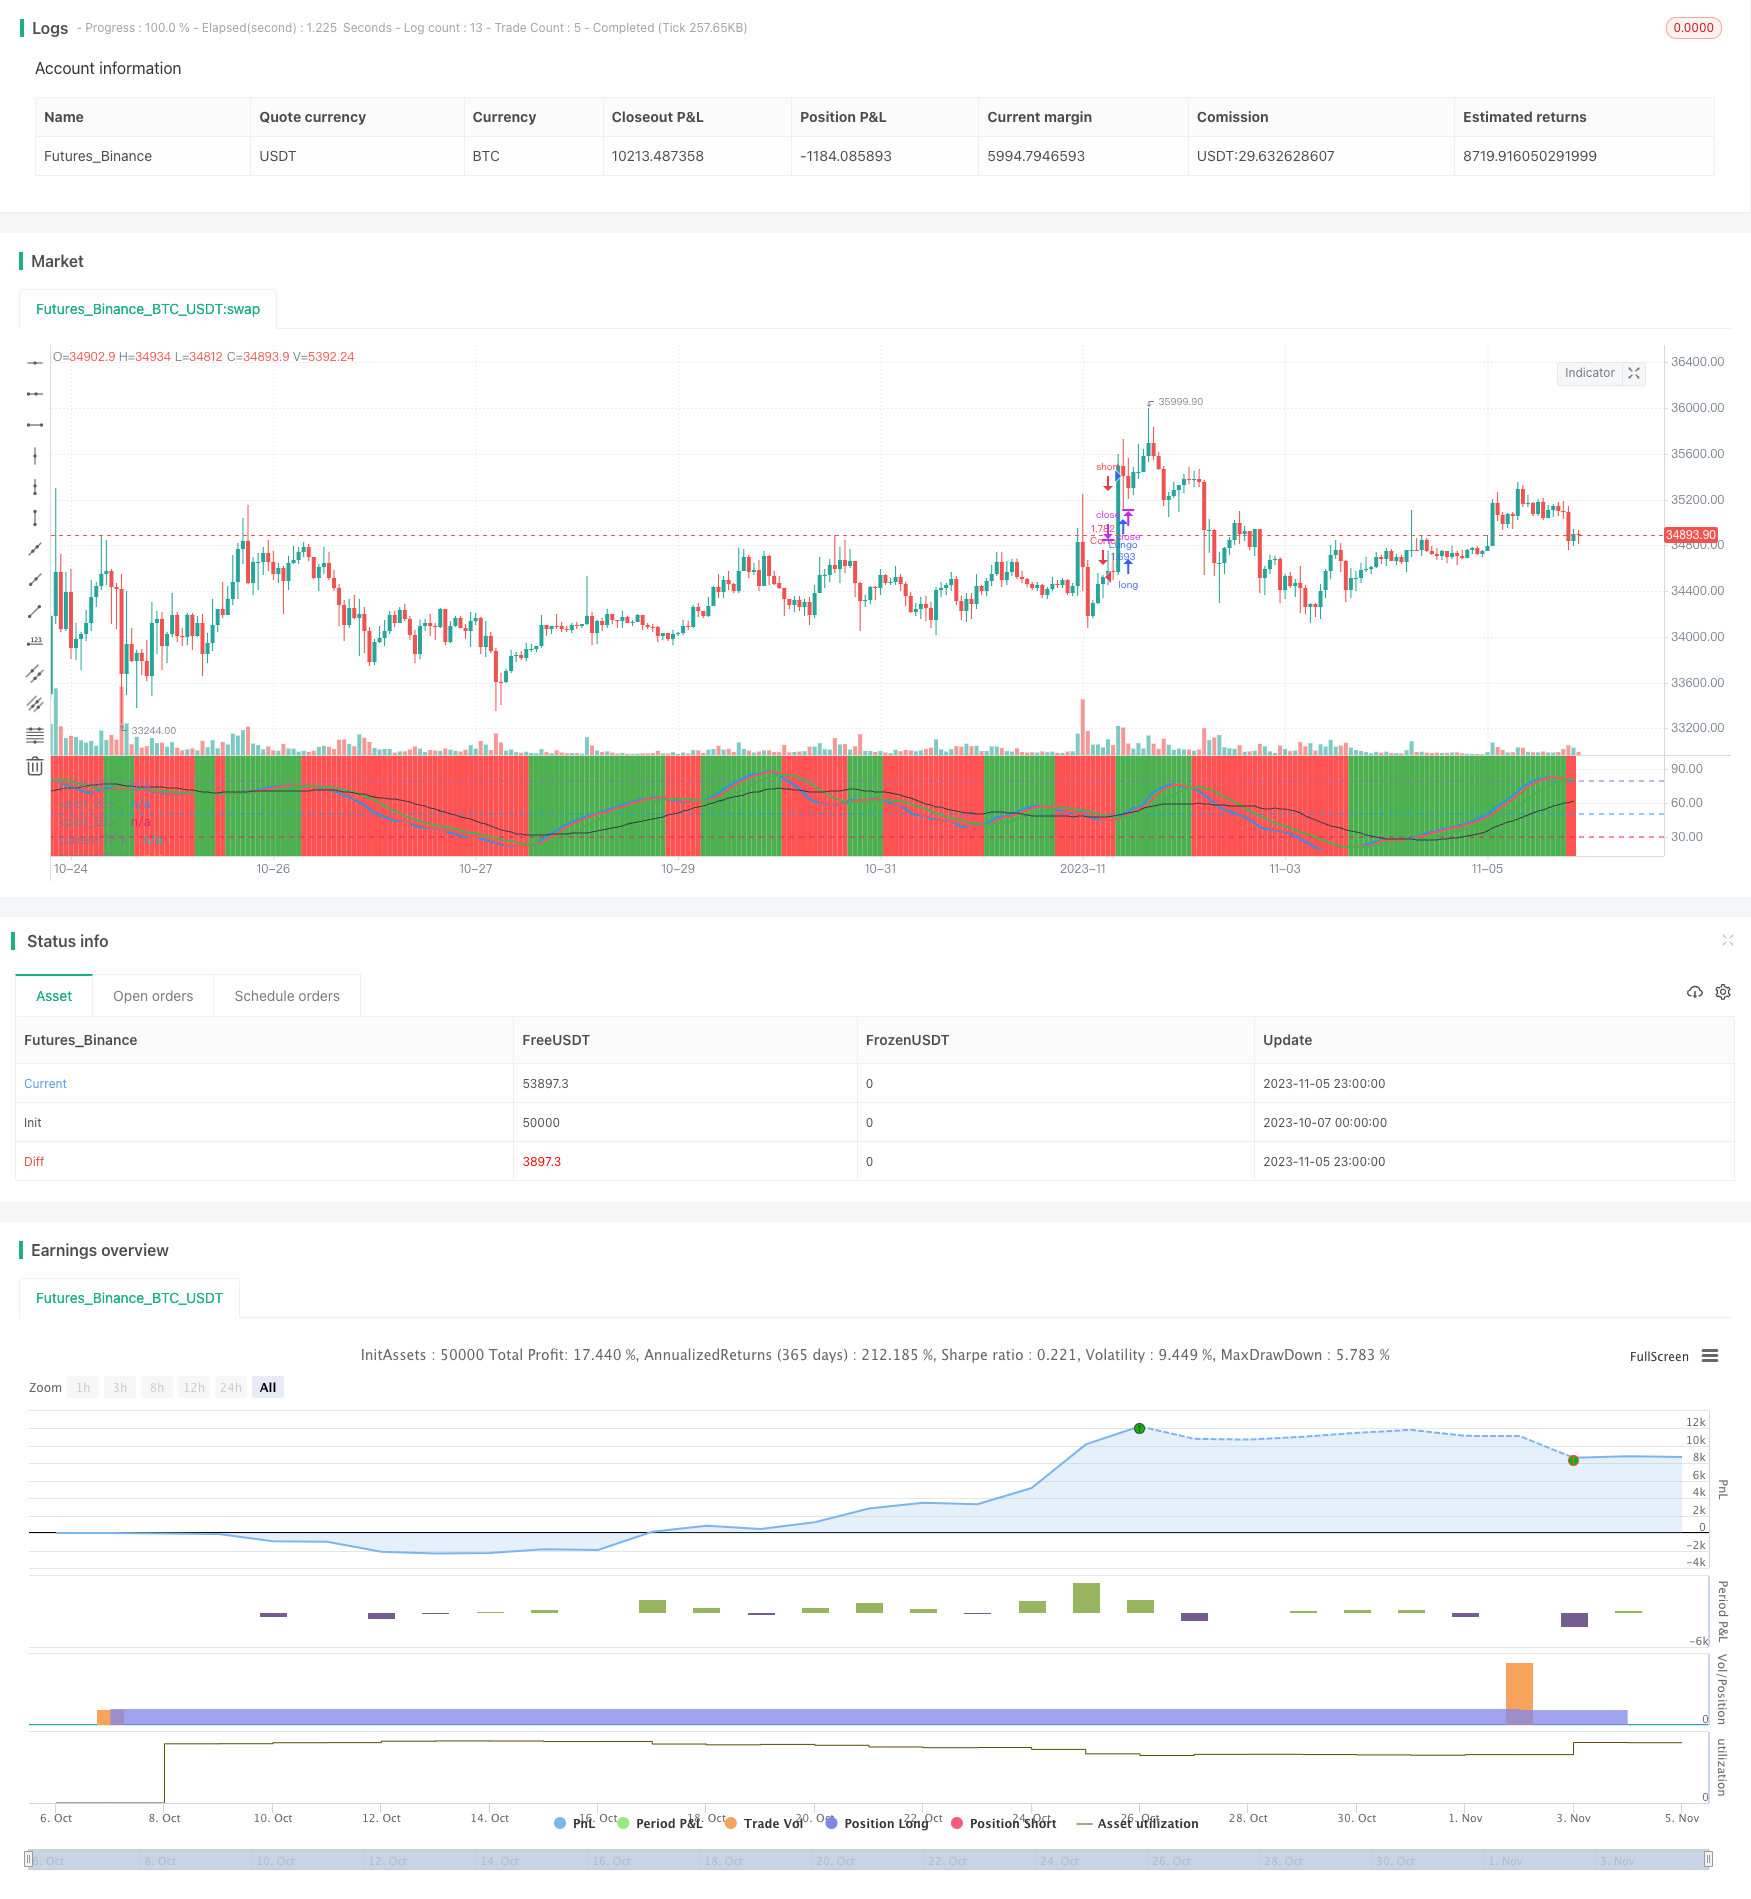 [trans]
概述
双重随机策略通过计算当前K线及多倍时间周期K线的随机指数,判断多空区域,实现低买高卖的目的。该策略同时计算当前周期及3倍周期的随机指标,利用不同周期随机指标的金叉死叉信号,实现趋势跟踪。
策略原理
该策略同时计算两组随机指标,第一组为当前K线周期的随机指标,即K值和D值,第二组为3倍当前周期的随机指标,即MTFK和MTFD。
当MTFK上穿50线且当前K值大于D值时产生买入信号,表示进入多头区域,做多;当MTFD下穿50线且当前K值小于D值时产生卖出信号,表示进入空头区域,做空。
因此,该策略利用双重随机指标判断多空区域,实现价格的趋势跟踪。进入多头区域做多,进入空头区域做空,达到低买高卖的效果。
具体来说,该策略的买入信号logical为:
longCondition = crossover(mtfK, 50) and k>50 and k>d and mtfK>mtfD
卖出信号logical为:
shortCondition = crossunder(mtfD, 50) and k<50 and k<d and mtfK<mtfD
其中,mtfK为3倍周期的K值,mtfD为3倍周期的D值。当mtfK上穿50线且k>d时产生买入信号;当mtfD下穿50线且k<d时产生卖出信号。
此外,策略还设置了止损逻辑。当多头仓位时,如果mtfD下穿上轨,产生平仓信号;当空头仓位时,如果mtfK上穿下轨,产生平仓信号。
优势分析
该策略具有以下优势:
-
使用双重随机指标,判断多空区域更准确。当前周期指标判断短期趋势,大周期指标判断长期趋势,结合双重指标可以更好地把握趋势。
-
采用不同周期指标的金叉死叉交易策略,可以有效跟踪价格趋势,实现低买高卖。
-
设置止损逻辑,可以一定程度上控制风险,防止亏损扩大。
-
策略逻辑简单清晰,容易理解实现,适合用于实盘。
风险分析
该策略也存在一定风险:
-
双重随机指标可能产生错误信号,导致不必要的交易。例如突发事件导致短期与长期趋势背离。
-
止损逻辑设置不恰当可能导致亏损扩大。应合理设置止损距离,防止被套。
-
交易费用频繁买卖会影响策略收益。应适当调整参数,减少不必要交易。
-
策略仅基于技术指标,没有结合基本面因素。应该适当关注重大 fundamentals 因素。
对应解决方法:
-
适当调整双随机指标参数,降低错误信号率。
-
优化止损逻辑,并设置合理的止损距离。
-
调整参数,降低交易频率。可以适当放宽金叉死叉判定标准。
-
关注重大基本面消息,避免主观交易。
优化方向
该策略可以从以下几个方面进行优化:
-
优化双随机指标参数,降低错误信号率。可以测试不同的K值、D值参数对效果的影响。
-
结合其他指标过滤信号。例如MACD、移动平均线等指标的辅助判断,避免错误信号。
-
优化止损策略,设置止损距离和比例。测试不同的止损点是否能够有效控制风险。
-
结合交易量指标。例如放量突破等策略,避免在价格震荡期无效交易。
-
测试不同持仓时间。持仓时间过短,交易费用影响收益;持仓时间过长,无法及时止损。
-
结合基本面因素,在重要事件前后关闭策略,避免被事件冲击。
总结
双重随机策略通过当前周期和多倍周期随机指标判断多空区域,实现低买高卖。该策略具有趋势跟踪能力较强、逻辑简单、易于实盘等优势。但也存在一定风险,需要对参数及止损策略进行优化,并辅以其他技术指标或基本面判断来改进。如果经过全面优化和严格的回测验证,该策略可以成为一个非常实用的趋势跟踪策略。
||
Overview
The Dual Stochastics strategy judges bullish and bearish zones by calculating stochastic indicators of the current period and multiple timeframes, aiming to buy low and sell high. It computes stochastic indices of both the current period and 3 times the period, and generates trading signals based on crossovers of the different timeframe indicators to track trends.
Strategy Logic
The strategy calculates two sets of stochastic indicators simultaneously. The first set is the stochastics of the current period, namely the K and D values. The second set is the stochastics of 3 times the current period, namely MTFK and MTFD.
When MTFK crosses above 50 and current K is greater than D, a buy signal is generated, indicating a bullish zone to go long. When MTFD crosses below 50 and current K is less than D, a sell signal is generated, indicating a bearish zone to go short.
Therefore, the strategy uses dual stochastic indicators to judge bullish and bearish zones and track price trends. It goes long in bullish zones and goes short in bearish zones, achieving the goal of buying low and selling high.
Specifically, the long entry logic is:
longCondition = crossover(mtfK, 50) and k>50 and k>d and mtfK>mtfD
The short entry logic is:
shortCondition = crossunder(mtfD, 50) and k<50 and k<d and mtfK<mtfD
Where mtfK is the K value of the 3x period, and mtfD is the D value of the 3x period. Long signals are generated when mtfK crosses above 50 and k>d. Short signals are generated when mtfD crosses below 50 and k<d.
The strategy also sets stop loss logic. When long, if mtfD crosses below the upper band, a close signal is generated. When short, if mtfK crosses above the lower band, a close signal is triggered.
Advantage Analysis
The advantages of this strategy are:
-
Using dual stochastics provides more accurate judgment of bullish and bearish zones. The current period indicator judges short-term trends while the larger period indicator judges long-term trends. Combining the two can better capture trends.
-
Trading based on crossovers of different timeframe indicators can effectively track trends and achieve buying low and selling high.
-
The stop loss logic helps control risks and limit losses to some extent.
-
The strategy logic is simple and clear, easy to understand and implement for live trading.
Risk Analysis
The strategy also has some risks:
-
Dual stochastics may generate false signals, causing unnecessary trades. For example, divergences between short-term and long-term trends caused by sudden events.
-
Improper stop loss settings may lead to enlarged losses. Reasonable stop loss distances should be set to avoid being trapped.
-
Frequent trading generated by the strategy may negatively impact profits due to commissions. Parameters should be adjusted to reduce unnecessary trades.
-
The strategy relies solely on technical indicators without considering fundamentals, which should be monitored to some degree.
Solutions:
-
Adjust parameters of the dual stochastics to reduce false signals.
-
Optimize the stop loss logic and set reasonable stop loss distances.
-
Adjust parameters to reduce trading frequency. Relax crossover criteria for example.
-
Pay attention to significant fundamental events to avoid subjective trading.
Optimization Directions
The strategy can be optimized in the following aspects:
-
Optimize the parameters of the dual stochastics to reduce false signals. Test the effects of different K and D values.
-
Incorporate other indicators to filter signals, such as MACD, moving averages etc, avoiding false signals.
-
Optimize the stop loss strategy by testing different stop loss points and ratios to effectively control risks.
-
Incorporate trading volume indicators, such as volume breakouts, to avoid ineffective trades during price consolidations.
-
Test different holding periods. Too short holding periods lead to commissions eating up profits, too long fails to stop loss in time.
-
Incorporate fundamental factors, closing positions around significant events to avoid being shocked.
Summary
The Dual Stochastics strategy judges bullish and bearish zones by current period and multiple period stochastic indicators, achieving the goal of buying low and selling high. It has advantages like strong trend tracking capability, simple logic, and easy live trading. But risks exist, requiring parameter tuning, stop loss optimization, and incorporation of other technicals or fundamentals to improve. If comprehensively optimized and strictly backtested, this strategy can become a very practical trend following system.
[/trans]
Strategy Arguments
| Argument | Default | Description |
|---|---|---|
| v_input_1 | 54 | Length for Main Stochastic |
| v_input_2 | 12 | SmoothK for Main Stochastic |
| v_input_3 | 3 | SmoothD for Main Stochastic |
| v_input_4 | 80 | Upper Line Value? |
| v_input_5 | 30 | Lower Line Value? |
| v_input_6 | 100 | Trialing step value |
| v_input_7 | true | Show Bullish/Bearish Zones |
Source (PineScript)
/*backtest
start: 2023-10-07 00:00:00
end: 2023-11-06 00:00:00
period: 1h
basePeriod: 15m
exchanges: [{"eid":"Futures_Binance","currency":"BTC_USDT"}]
*/

//@version=3
strategy("stoch startegy", overlay=false,default_qty_type=strategy.percent_of_equity,default_qty_value=100,currency=currency.USD)

len = input(54, minval=1, title="Length for Main Stochastic")
smoothK = input(12, minval=1, title="SmoothK for Main Stochastic")
smoothD = input(3, minval=1, title="SmoothD for Main Stochastic")
upLine = input(80, minval=50, maxval=90, title="Upper Line Value?")
lowLine = input(30, minval=10, maxval=50, title="Lower Line Value?")
trailStep=input(100,minval=10,title="Trialing step value")

// current stochastic calculation
k = sma(stoch(close, high, low, len), smoothK)
d = sma(k, smoothD)

//mtf stochastic calculation smoothed with period

mtfK= sma(stoch(close, high, low, len), smoothK*3)
mtfD= sma(k, smoothD*3)

plot(k,"current TF k",blue,style=line, linewidth=2)
plot(d,"current TF d",red,style=line, linewidth=2)
plot(mtfK,"MTF TF k",black,style=line)
plot(mtfD,"Multi TF d",green,style=line, linewidth=2)
hline(upLine)
hline(50)
hline(lowLine)

longCondition = crossover(mtfK, 50) and k>50 and  k>d and mtfK>mtfD
if (longCondition)
    strategy.entry("Lungo", strategy.long)

shortCondition = crossunder(mtfD, 50) and k<50 and  k<d and mtfK<mtfD
if (shortCondition)
    strategy.entry("Corto", strategy.short)

exitlong=crossunder(mtfD, upLine)
exitshort=crossover(mtfK, lowLine)

if (exitlong)
    strategy.exit("Esci lungo","Lungo",trail_points=trailStep)
if (exitshort)
    strategy.exit("Esci corto","Corto",trail_points=trailStep)

showZones   = input(true, title="Show Bullish/Bearish Zones")
// bullish signal rule:
bullishRule = k >= mtfD
// bearish signal rule:
bearishRule = k <= mtfD
// current trading State
ruleState = 0
ruleState := bullishRule ? 1 : bearishRule ? -1 : nz(ruleState[1])
bgcolor(showZones ? ( ruleState==1 ? green : ruleState==-1 ? red : gray ) : na , title="supertrend Bullish/Bearish Zones", transp=90)
Detail
https://www.fmz.com/strategy/431396
Last Modified
2023-11-07 15:25:19