
12 KiB
Name
双重转折追踪策略Double-Reversal-Tracking-Strategy
Author
ChaoZhang
Strategy Description
 [trans]
概述
双重转折追踪策略通过追踪价格的双重转折点来实现交易信号的产生。当价格形成新的高点时,该策略会进入空仓;当价格形成新的低点时,该策略会进入多仓。这种对价格转折点的实时追踪可以及时捕捉市场 momentum 的反转。
策略原理
双重转折追踪策略运用两种形态判断来产生交易信号,包括高买转折形态(HHS)和低卖转折形态(LLB)。其判断公式如下:
- HHS形态:close[0] < close[1] 且 high[0] > high[1]
- LLB形态:close[0] > close[1] 且 low[0] < low[1]
满足上述条件就会分别制定 HHS 和 LLB 的 bar 索引和价格。之后,该策略会实时监控价格是否突破记录的转折价格。当价格突破 HHS 转折高点时,表明价格模式已经反转为下跌趋势,该策略会开启空仓;反之,当价格突破 LLB 转折低点时,表明价格模式已经反转为上涨趋势,该策略会开启多仓。通过这种方式,双重转折追踪策略能够动态捕捉价格反转机会。
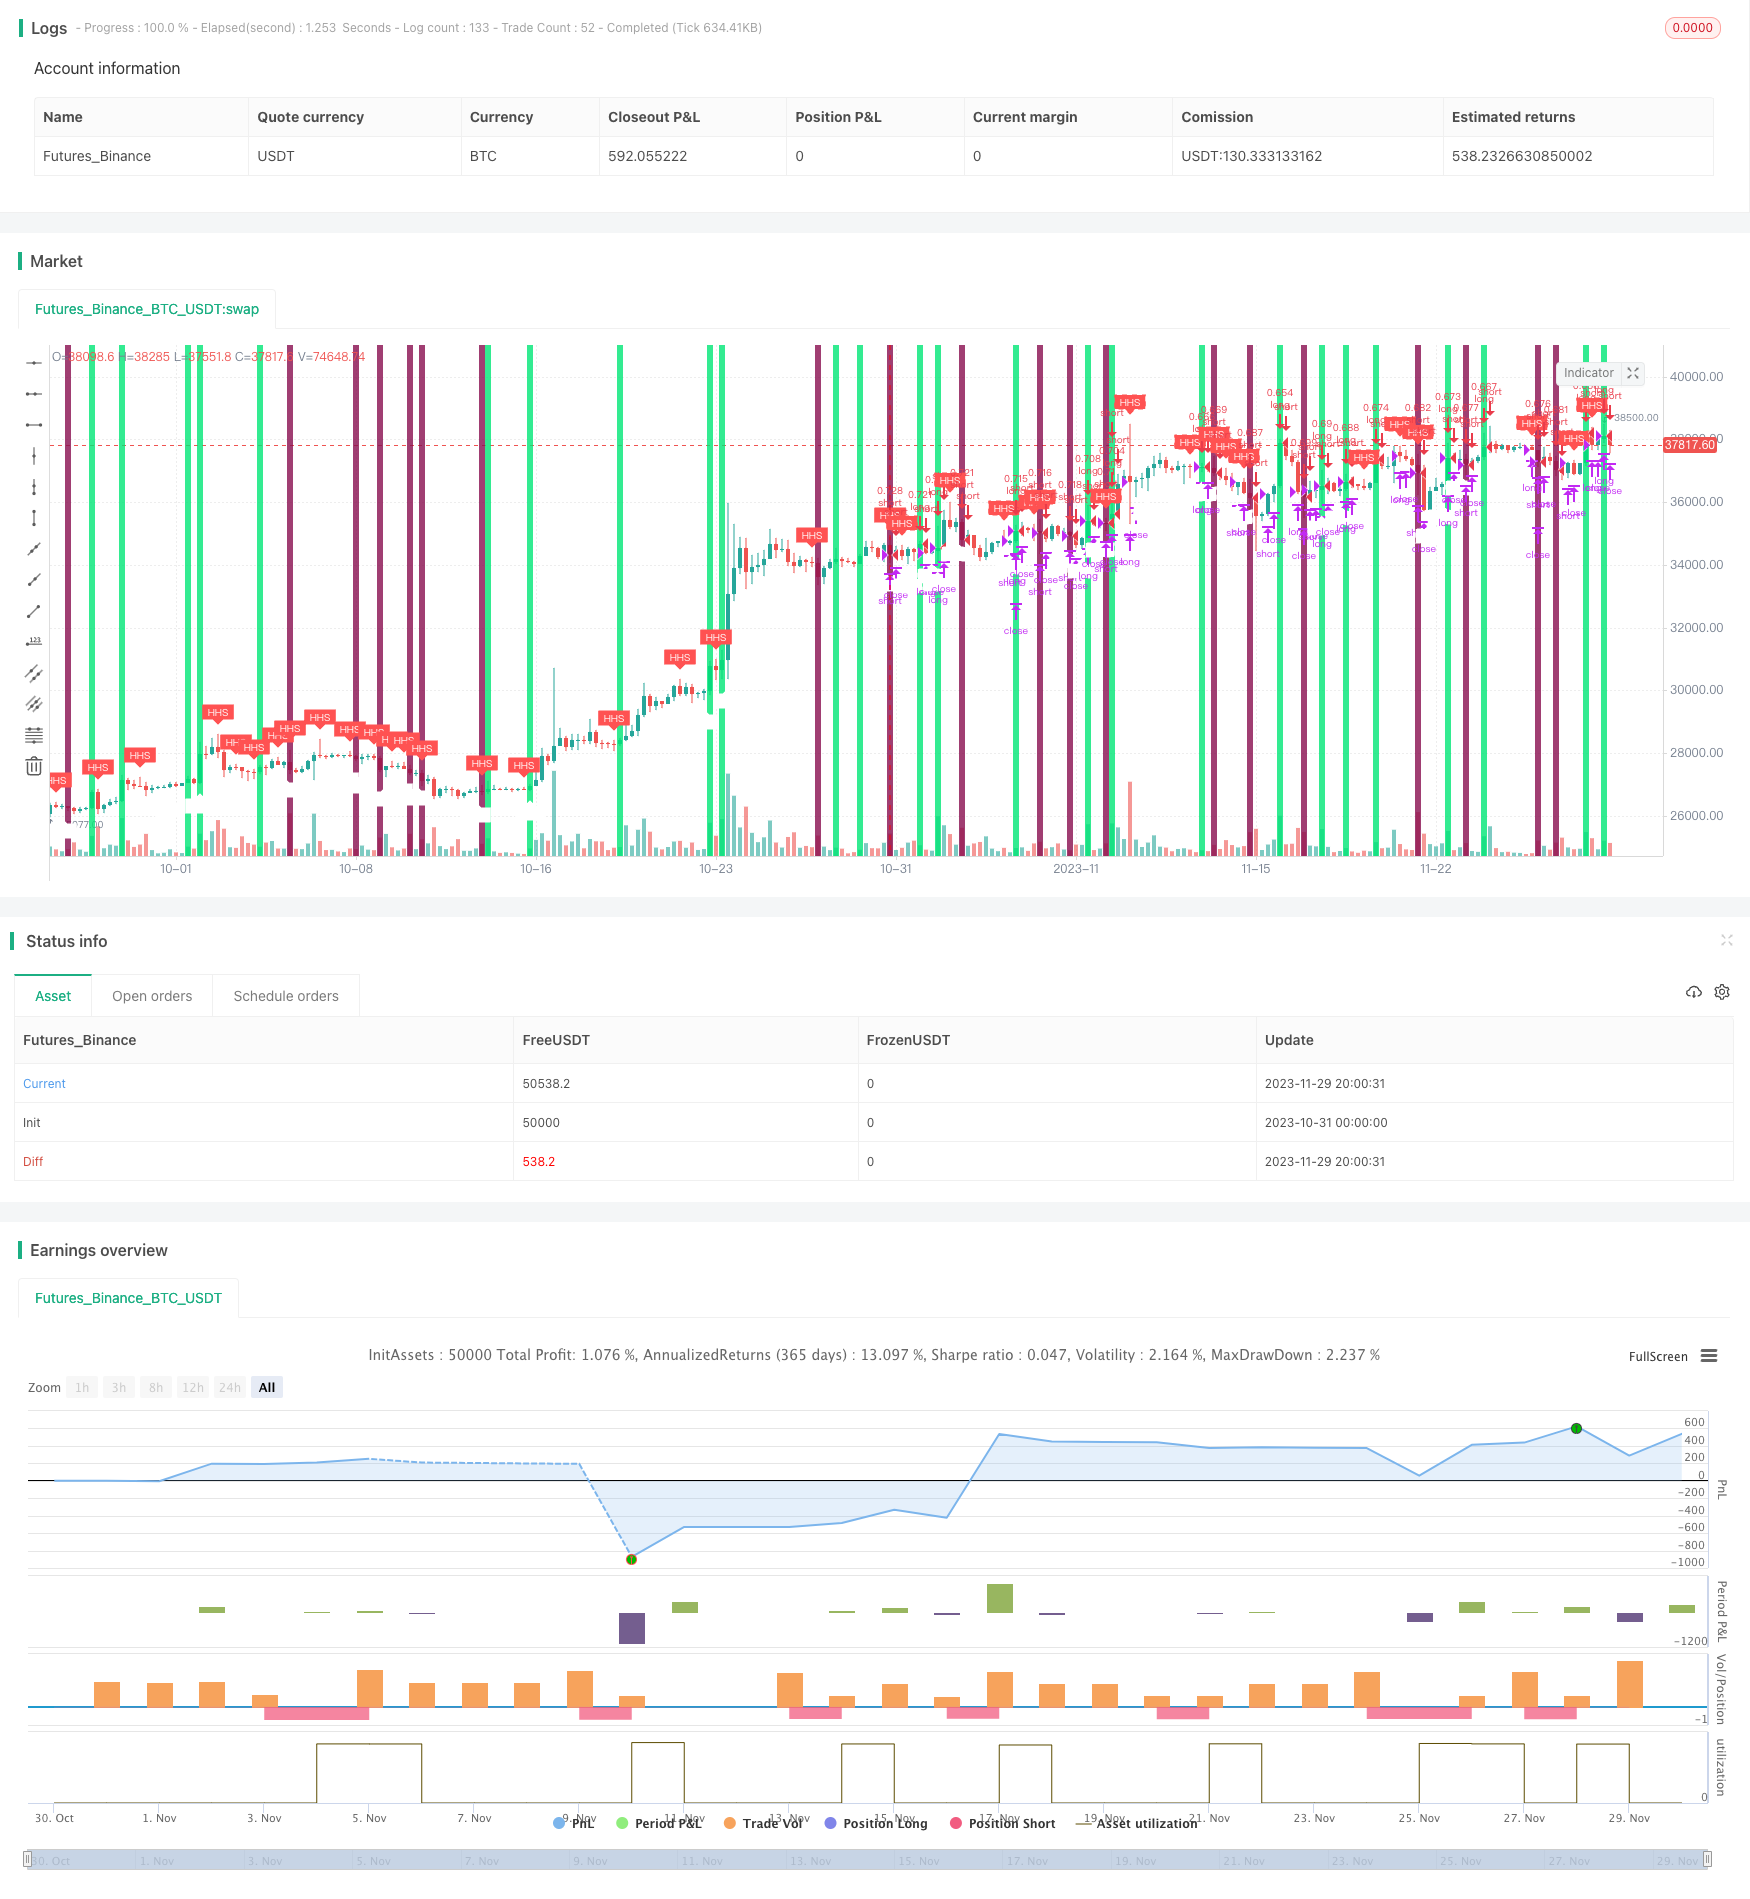
该策略运行时,还会通过画出标记和底色来直观显示HHS、LLB形态和价格突破情况。这对于直观判断市场格局和验证策略运作非常有帮助。总的来说,双重转折追踪策略通过动态追踪价格转折点来实现交易,能够有效捕捉价格反转机会。
优势分析
双重转折追踪策略具有以下优势:
-
实时追踪价格转折,可以快速捕捉市场反转机会。相比其他追踪移动平均线等指标的策略,该策略的反应更为敏捷。
-
运用价格本身的转折特征产生交易信号,没有过多参数需要优化调整,实施简单直接。
-
画出形态标记和突破标记,使策略运作过程直观可视化,验证策略效果很容易。
-
策略实现代码量不大,容易理解和二次开发。可以作为量化交易的入门策略来学习。
总的来说,双重转折追踪策略相对简单,但可以有效捕捉价格反转,值得作为快速追踪类策略来使用。
风险分析
双重转折追踪策略也存在一定的风险,主要体现在:
-
价格反转判断依赖单点信息,可能出现误判的概率较大。可以设置价格突破后有效跟踪阈值来减少误判概率。
-
未考虑大级别价格趋势,在主升浪中仍然可能产生错误的空仓信号。可以加入趋势过滤来避免这样的风险。
-
没有止损机制来控制单笔损失。实盘中需要设定合理的止损策略,控制单笔亏损在可承受范围内。
-
回测数据存在优化偏差,实盘表现可能弱于回测结果。实盘验证至关重要。
总体来说,该策略作为快速追踪反转类策略,实现简单,但也存在一定概率的误判风险。通过加入趋势过滤、止损策略等模块可以有效降低风险,使其成为稳定可靠的实盘策略。
优化方向
为降低误判概率,提高稳定性,该策略可以从以下方面进行优化:
-
加入价格有效突破判定,如要求价格跌破转折高点一定比例后才开仓。
-
加入大级别趋势判断模块,避免在主升浪中错误做空。可以使用指数移动平均线等指标判断趋势。
-
增加止损策略,如跟踪止损、区间止损等方式,控制单笔亏损在一定限度内。
-
优化仓位算法,可以根据市场波动率调整仓位大小,在高波动时减少单笔仓位。
-
测试更长时间周期的实盘数据,评估参数稳定性,并进行多次迭代优化。
通过上述几个方向的优化调整,可以显著提高该策略的实盘表现和稳定性。
总结
双重转折追踪策略通过实时监控价格的转折点来捕捉反转机会。它判断简单,实施直接,可以快速打开反转趋势的仓位。但该策略也存在一定概率的误判风险。 通过加入趋势判断、止损策略等模块,并优化参数,可以有效降低误判概率,使其成为稳定高效的实盘交易策略。该策略非常适合作为快速追踪反转类策略来使用。
||
Overview
The Double Reversal Tracking strategy generates trading signals by tracking the double reversal points of prices. It will open a short position when the price forms a new high point and will open a long position when the price forms a new low point. This real-time tracking of price reversals can capture changes in market momentum in a timely manner.
Strategy Logic
The Double Reversal Tracking strategy uses two pattern judgments to generate trading signals, including the high buy reversal pattern (HHS) and the low sell reversal pattern (LLB). The judgment formulas are as follows:
- HHS pattern: close[0] < close[1] and high[0] > high[1]
- LLB pattern: close[0] > close[1] and low[0] < low[1]
When the above conditions are met, the bar index and price of HHS and LLB will be recorded respectively. After that, the strategy will monitor in real time whether the price breaks through the recorded reversal price. When the price breaks through the HHS reversal high point, it indicates the price pattern has reversed to a downward trend and the strategy will open a short position. On the contrary, when the price breaks through the LLB reversal low point, it indicates the price pattern has reversed to an upward trend and the strategy will open a long position. In this way, the Double Reversal Tracking strategy can dynamically capture price reversal opportunities.
When the strategy is running, it will also visually display the HHS, LLB patterns and breakout situations through markings and background colors. This is very helpful for intuitively judging market conditions and verifying the strategy. In summary, the Double Reversal Tracking strategy realizes trading by dynamically tracking price reversal points, which can effectively capture price reversal opportunities.
Advantage Analysis
The Double Reversal Tracking strategy has the following advantages:
-
Real-time tracking of price reversals allows quick capturing of market reversal opportunities. Compared with other strategies tracking moving average and other technical indicators, this strategy has more agile responses.
-
It generates trading signals directly from the price reversal features, without too many parameters to optimize. The implementation is simple and straightforward.
-
The markings of patterns and breakouts make the strategy operation visualization possible, making verification of strategy performance very easy.
-
The code base of the strategy is small and easy to understand and customize. It can serve as an introductory quantitative trading strategy for learning.
In summary, although simple, the Double Reversal Tracking strategy can effectively capture price reversals and is worth using as a fast-tracking reversal strategy.
Risk Analysis
The Double Reversal Tracking strategy also has some risks, mainly:
-
The price reversal judgment relies on single-point information, which has higher probability of misjudgments. The misjudgment probability can be reduced by setting a valid tracking threshold after price breakouts.
-
It does not consider the major trend, and may still generate incorrect short signals during major up trends. Trend filtering can be introduced to avoid such risks.
-
There is no stop loss mechanism to control single trade loss. Reasonable stop loss strategies need to be set for live trading to control losses to acceptable levels.
-
Backtest data may have optimization bias, and live performance may underperform backtests. Live verification is crucial.
In general, as a fast-tracking reversal strategy, this strategy has simple implementations but also has some probability of misjudgments. By introducing trend filtering, stop loss and other modules, the risks can be effectively reduced to make it a stable and reliable live trading strategy.
Enhancement Areas
To reduce misjudgment probability and improve stability, the strategy can be enhanced from the following aspects:
-
Add effective breakout validation, such as requiring the price to break the reversal point by some percentage before opening positions.
-
Add major trend judgment module to avoid incorrect short signals during major up trends. Moving average indicators can be used to determine the trend.
-
Implement stop loss strategies like trailing stop loss and zone stop loss to control single trade loss under certain limits.
-
Optimize position sizing algorithms to adjust position size based on market volatility, reducing single position size under high volatility environments.
-
Test longer timeframes of live data to evaluate parameter stability and conduct multi-round optimization iterations.
With adjustments through the above aspects, significant improvements can be achieved on live performance and stability of this strategy.
Conclusion
The Double Reversal Tracking strategy captures reversal opportunities by real-time monitoring of price reversal points. It has simple logic, straightforward execution, and can quickly open positions along reversal trends. But it also has some probability of misjudgments. By introducing trend filtering, stop loss strategies and parameter optimization, the misjudgment risk can be effectively reduced to make it a stable and efficient strategy for live trading. It is especially suitable as a fast-tracking reversal strategy.
[/trans]
Source (PineScript)
/*backtest
start: 2023-10-31 00:00:00
end: 2023-11-30 00:00:00
period: 6h
basePeriod: 15m
exchanges: [{"eid":"Futures_Binance","currency":"BTC_USDT"}]
*/

//@version=4
strategy(title="Rev. FO", shorttitle="Rev. FO", overlay=true, pyramiding=0,calc_on_order_fills=true,calc_on_every_tick=true,default_qty_type=strategy.percent_of_equity,default_qty_value=50,initial_capital=1000,currency="USD",commission_type=strategy.commission.percent,commission_value=0.2,process_orders_on_close=false)

HHS = close[0] < close[1] and high[0] > high[1]
LLB = close[0] > close[1] and low[0] < low[1]

var trade_long = false
var text_status = "Awaiting Trade..."
var index_hhs = 0
var index_llb = 0
var price_hhs = 0.0
var price_llb = 0.0

if (HHS)
    trade_long := false
    text_status := "Trade in Short"
    index_hhs := bar_index
    price_hhs := high
if (LLB)
    trade_long := true
    text_status := "Trade in Long"
    index_llb := bar_index
    price_llb := low

plotshape(HHS, style=shape.labeldown, title="HHS", location=location.abovebar, color=color.red, text="HHS", textcolor=color.white,size=size.tiny)
plotshape(LLB, style=shape.labelup, title="LLB", location=location.belowbar, color=color.white, text="LLB", textcolor=color.white,size=size.tiny)

// HHS_top = line.new(index_hhs-1,price_hhs,bar_index,price_hhs,extend=extend.right,style=line.style_solid,width=1,color=color.red)
// LLB_bot = line.new(index_llb-1,price_llb,bar_index,price_llb,extend=extend.right,style=line.style_solid,width=1,color=color.white)
// line.delete(HHS_top[1])
// line.delete(LLB_bot[1])

//Calculates how far the signal is painted to right.
hours = 5
lapos_x = timenow+1000*60*60*hours
lapos_y = highest(20)

// lb = label.new(lapos_x, lapos_y, text=text_status,color=trade_long?color.white:color.red,xloc = xloc.bar_time,style=label.style_diamond,textcolor=trade_long?color.white:color.red,size=size.small)
// label.delete(lb[1])

breakout_hhs = crossover(high,price_hhs)
breakout_llb = crossunder(low,price_llb)

bgcolor(breakout_hhs?color.lime:na,transp=50,title="BO HHS")
bgcolor(breakout_llb?color.maroon:na,transp=50,title="BO LLB")

long_condition = breakout_hhs
long_close = close < price_hhs or breakout_llb
short_condition = breakout_llb
short_close = close > price_llb or breakout_hhs

strategy.entry(id="long",long=true,comment="L",when=long_condition)
strategy.close(id="long",when=long_close)
strategy.entry(id="short",long=false,comment="S",when=short_condition)
strategy.close(id="short",when=short_close)
Detail
https://www.fmz.com/strategy/433938
Last Modified
2023-12-01 15:36:34