
9.6 KiB
Name
双重指标策略Dual-Indicator-Strategy
Author
ChaoZhang
Strategy Description
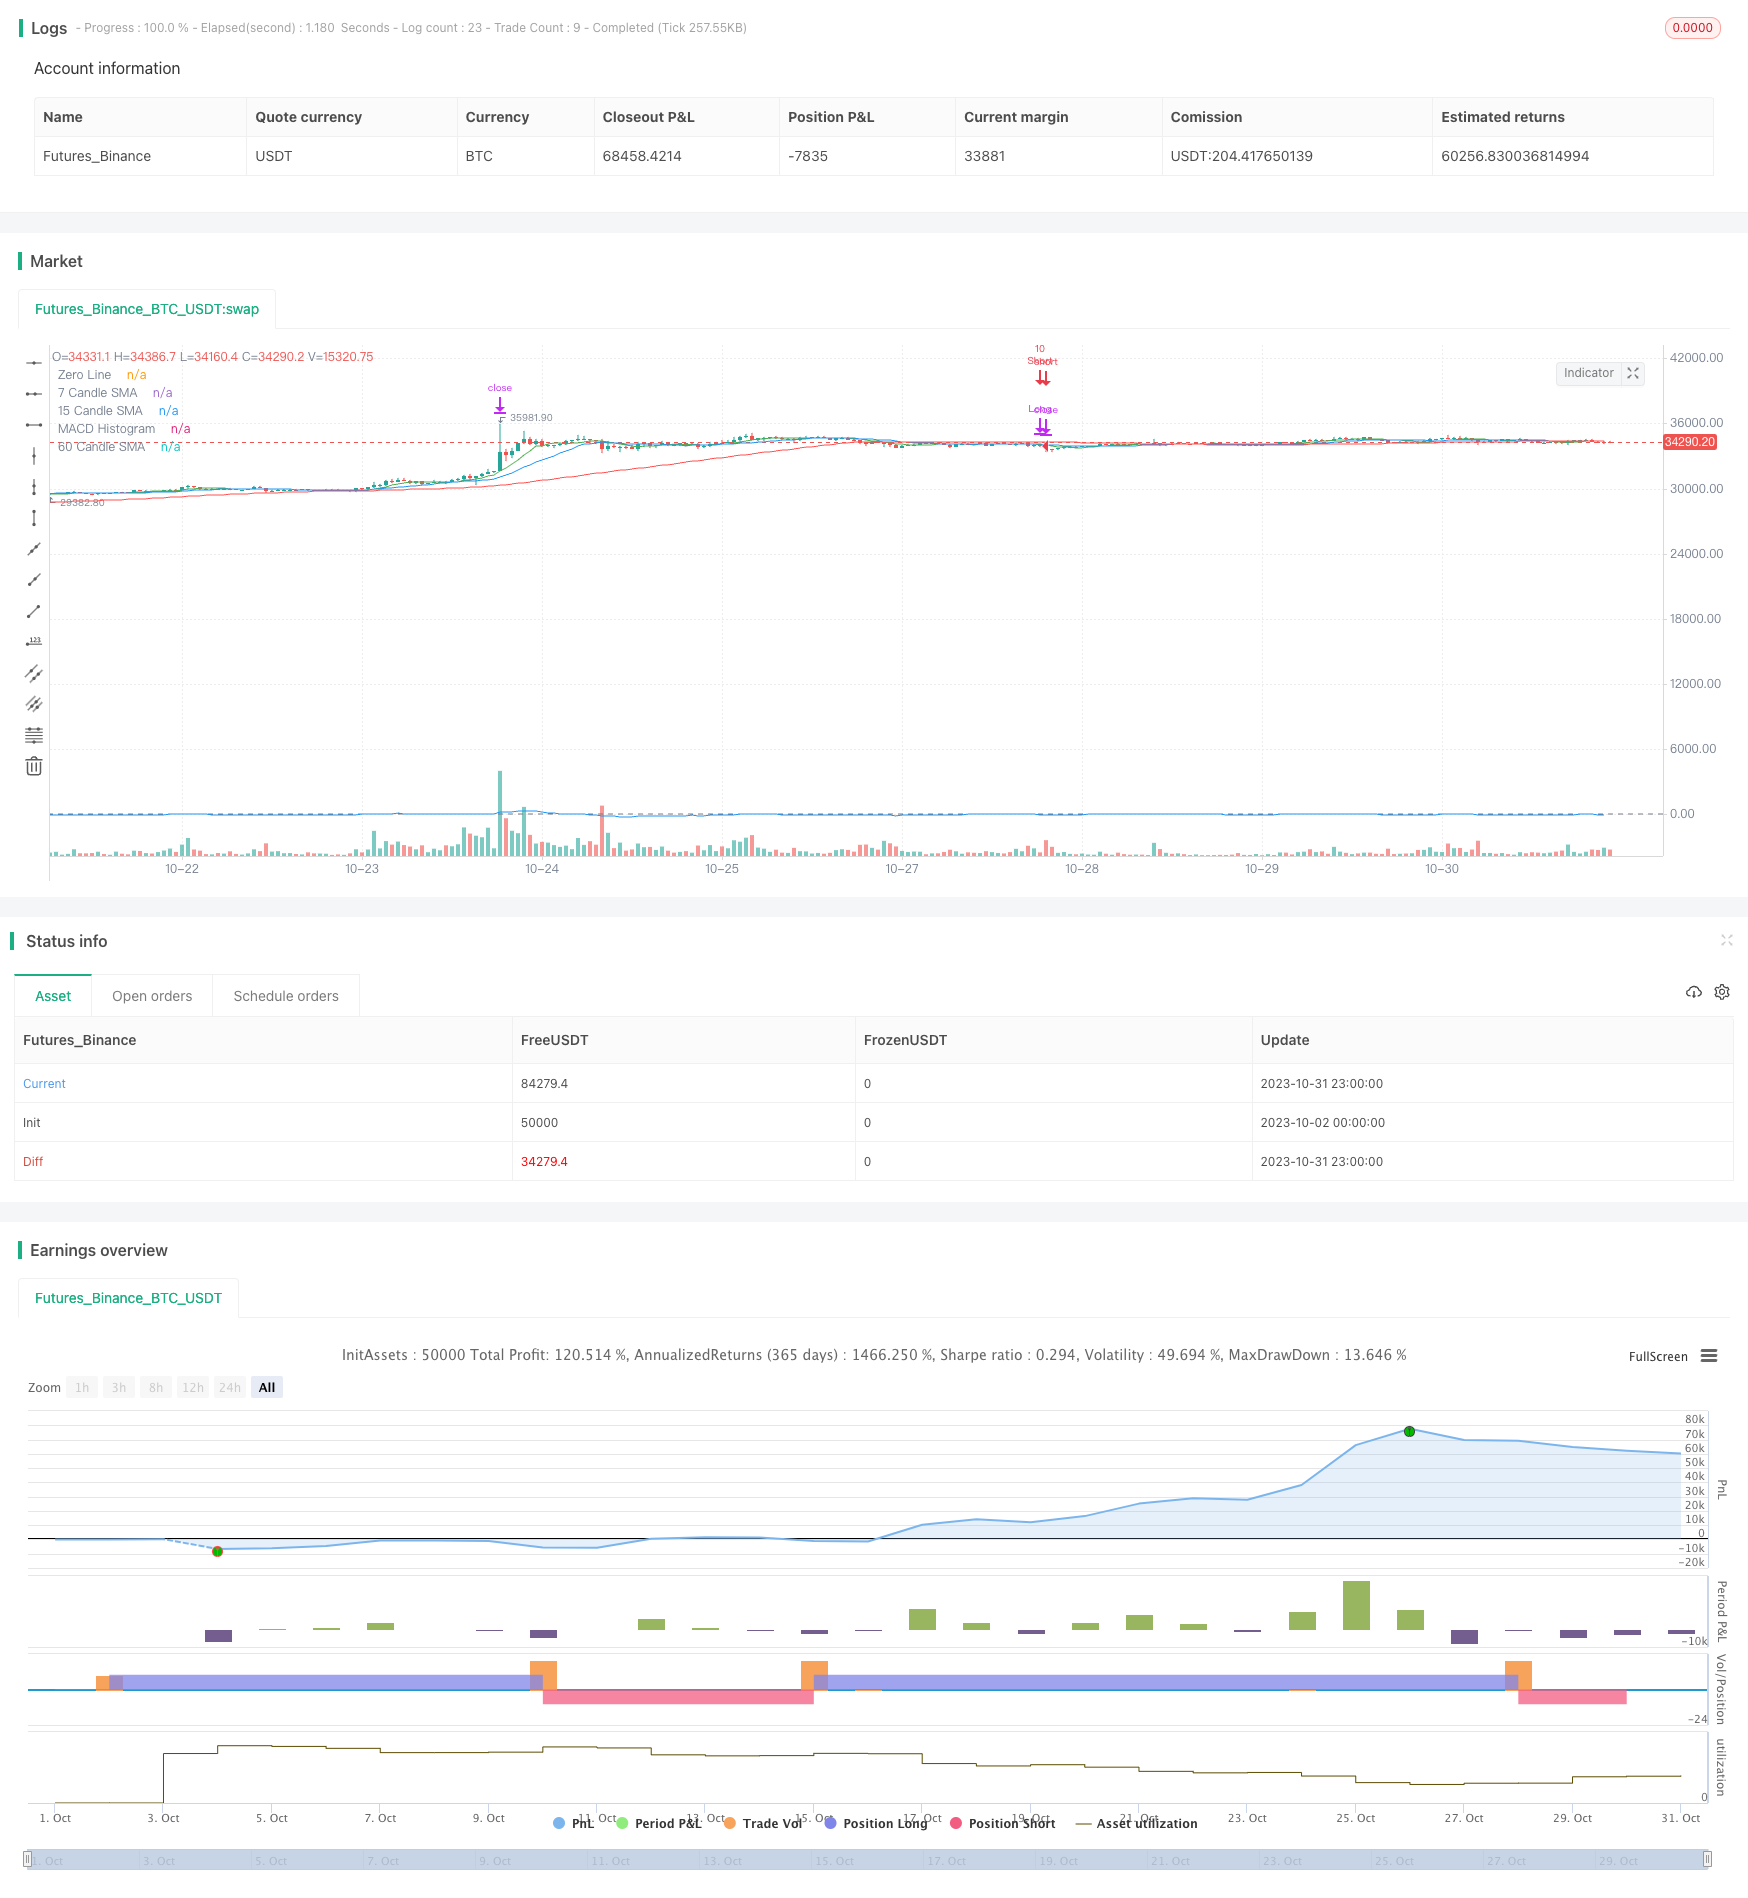
[trans]
概述
双重指标策略(Dual Indicator Strategy)是一个同时结合简单移动平均线(SMA)和移动平均收敛散发指标(MACD)的量化交易策略。该策略运用多种技术指标确认交易信号,旨在提高交易决策的准确性。
策略原理
双重指标策略主要基于两个技术指标:SMA和MACD。策略采用7根、15根和60根K线的SMA,以及标准12/26/9参数设置的MACD。
当7根SMA高于15根和60根SMA,15根SMA也高于60根SMA时,视为SMA指标给出的看涨信号,概率为0.5。
同时,当MACD指标的MACD线上穿信号线时,也视为MACD指标给出的看涨信号,概率为0.5。
当两个指标的看涨信号概率相加达到1时,就进行买入开仓。
相反,当7根SMA低于15根和60根SMA,15根SMA也低于60根SMA时,视为SMA指标给出的看跌信号,概率为0.5。
同时,当MACD指标的MACD线下穿信号线时,也视为MACD指标给出的看跌信号,概率为0.5。
当两个指标的看跌信号概率相加达到1时,就进行卖出开仓。
此外,策略采用两个不同的止盈点:价格上涨或下跌9%时,平仓50%的头寸;价格上涨或下跌21%时,平仓剩余所有头寸。
如果产生与当前持仓方向相反的信号,会先平掉之前的持仓,再按照新的信号开仓。
优势分析
双重指标策略最大的优势在于可以同时利用SMA和MACD两个指标的优点。SMA可以有效跟踪价格趋势变化,过滤市场噪音;而MACD可以发现短期的趋势反转时机。两者结合可以提高交易信号的可靠性。
此外,采用不同参数设置的多组SMA有助于辨识中长期趋势;而止盈策略可以锁定部分利润,控制风险。
风险分析
双重指标策略也存在一些潜在风险需要注意。由于仅依赖技术指标,可能出现指标发出错误信号的情况。此外,止盈设置不当也可能导致过早离场,错过大涨大跌。
可以通过调整SMA周期参数或者增加其他滤波指标来优化策略,确保交易信号更可靠。同时,止盈水平也需要根据市场波动程度进行动态调整,保证可以持续捕获趋势行情。
优化方向
双重指标策略还有一些可优化的空间:
-
测试添加其他技术指标,如RSI、布林带等,形成多重指标过滤;
-
尝试机器学习算法,利用多变量建立交易信号判断模型;
-
根据不同品种、周期参数进行策略调优;
-
增加止损策略,严格控制单笔损失;
-
优化止盈策略,在趋势中持续获利。
通过系统的回测和优化,可以不断提升策略的稳定性和盈利能力。
总结
双重指标策略综合运用SMA和MACD两个指标的优势,在提高信号准确性的同时,有效控制交易风险。该策略有良好的优化空间和扩展性,是一种可靠、适应性强的量化交易策略。通过持续的数据驱动和策略调优,该策略可以逐步发展成一个强大的量化交易系统。
||
Overview
The Dual Indicator Strategy is a quantitative trading strategy that combines Simple Moving Average (SMA) and Moving Average Convergence Divergence (MACD) indicators. By utilizing multiple technical indicators, the strategy aims to increase the accuracy of trading signals.
Strategy Logic
The core of the Dual Indicator Strategy relies on two indicators: SMA and MACD. The strategy adopts 7-, 15- and 60-period SMAs, as well as the standard 12/26/9 MACD parameter setting.
When the 7-period SMA is above the 15- and 60-period SMAs, and the 15-period SMA is above the 60-period SMA, it is considered a bullish signal from the SMA indicator, with a probability of 0.5.
At the same time, when the MACD line crosses above the signal line, it is considered a bullish signal from the MACD indicator, also with a probability of 0.5.
When the bullish signal probabilities from the two indicators add up to 1, a long position will be opened.
Conversely, when the 7-period SMA falls below the 15- and 60-period SMA, and the 15-period SMA is below the 60-period SMA, it is considered a bearish signal from the SMA indicator, with a probability of 0.5.
Meanwhile, when the MACD line crosses below the signal line, it is considered a bearish signal from the MACD indicator, with a probability of 0.5.
When the bearish signal probabilities from the two indicators add up to 1, a short position will be opened.
In addition, the strategy adopts two different take profit points: close out 50% of the position when price rises or falls by 9%, and close out the remaining position when price rises or falls by 21%.
If a signal opposite to the current position occurs, the current position will be closed first before opening a new position based on the new signal.
Advantage Analysis
The biggest advantage of the Dual Indicator Strategy is that it utilizes the strengths of both SMA and MACD indicators. SMA can effectively track price trend changes and filter out market noise, while MACD can identify short-term trend reversal opportunities. Combining the two can improve the reliability of trading signals.
In addition, adopting SMAs with different parameter settings helps discern long- to medium-term trends, while the take profit strategy locks in partial profits and controls risks.
Risk Analysis
Some potential risks of the Dual Indicator Strategy need to be noted. As it relies solely on technical indicators, incorrect signals may occur. Also, improper take profit settings could lead to premature exit, missing major trends.
The strategy can be optimized by adjusting the SMA period parameters or incorporating additional filtering indicators to ensure more reliable signals. Take profit levels also need to be dynamically adjusted based on market volatility to sustain capturing trending moves.
Optimization Directions
Some aspects of the Dual Indicator Strategy can be further optimized:
-
Test adding other technical indicators like RSI, Bollinger Bands for multi-indicator filtering.
-
Try machine learning algorithms to build signal judgment models using multiple variables.
-
Perform parameter tuning based on different products and timeframes.
-
Incorporate stop loss to strictly control single trade loss.
-
Optimize take profit strategy to ride sustained trends.
Through systematic backtesting and optimization, the strategy's stability and profitability can be continuously enhanced.
Conclusion
The Dual Indicator Strategy combines the strengths of SMA and MACD to improve signal accuracy while effectively controlling risks. With strong optimization potential and versatility, it is a robust and adaptive quantitative trading strategy. With continuous data-driven improvements, the strategy can evolve into a powerful trading system.
[/trans]
Strategy Arguments
| Argument | Default | Description |
|---|---|---|
| v_input_int_1 | 7 | 7 Candle SMA Length |
| v_input_int_2 | 15 | 15 Candle SMA Length |
| v_input_int_3 | 60 | 60 Candle SMA Length |
| v_input_int_4 | 12 | Fast Length |
| v_input_int_5 | 26 | Slow Length |
| v_input_int_6 | 9 | Signal Length |
Source (PineScript)
/*backtest
start: 2023-10-02 00:00:00
end: 2023-11-01 00:00:00
period: 1h
basePeriod: 15m
exchanges: [{"eid":"Futures_Binance","currency":"BTC_USDT"}]
*/

//@version=5
strategy("SMA & MACD Dual Direction Strategy", shorttitle="SMDDS", overlay=true, initial_capital=1000)

// SMA settings
sma7_length = input.int(7, title="7 Candle SMA Length")
sma15_length = input.int(15, title="15 Candle SMA Length")
sma60_length = input.int(60, title="60 Candle SMA Length")

// MACD settings
fast_length = input.int(12, title="Fast Length")
slow_length = input.int(26, title="Slow Length")
signal_length = input.int(9, title="Signal Length")

// Leverage
leverage = 10

// Calculate the SMAs
sma7 = ta.sma(close, sma7_length)
sma15 = ta.sma(close, sma15_length)
sma60 = ta.sma(close, sma60_length)

// Calculate the MACD line and Signal line
[macdLine, signalLine, _] = ta.macd(close, fast_length, slow_length, signal_length)

// SMA-based Probabilities
smaBullishProb = (sma7 > sma15 and sma7 > sma60 and sma15 > sma60) ? 0.5 : 0.0
smaBearishProb = (sma7 < sma15 and sma7 < sma60 and sma15 < sma60) ? 0.5 : 0.0

// MACD-based Probabilities
macdBullishProb = ta.crossover(macdLine, signalLine) ? 0.5 : 0.0
macdBearishProb = ta.crossunder(macdLine, signalLine) ? 0.5 : 0.0

// Combined Probabilities
combinedBullishProb = smaBullishProb + macdBullishProb
combinedBearishProb = smaBearishProb + macdBearishProb

// Trade logic using `if` conditions
if combinedBullishProb == 1.0
    strategy.close("Short")
    strategy.entry("Long", strategy.long, qty=leverage)

if combinedBearishProb == 1.0
    strategy.close("Long")
    strategy.entry("Short", strategy.short, qty=leverage)

// Exit conditions based on profit points
longTargetProfit1 = close * 1.09
longTargetProfit2 = close * 1.21

shortTargetProfit1 = close * 0.91
shortTargetProfit2 = close * 0.79

strategy.exit("Long TP1", from_entry="Long", limit=longTargetProfit1, qty_percent=0.5)
strategy.exit("Long TP2", from_entry="Long", limit=longTargetProfit2)

strategy.exit("Short TP1", from_entry="Short", limit=shortTargetProfit1, qty_percent=0.5)
strategy.exit("Short TP2", from_entry="Short", limit=shortTargetProfit2)

// Visualization (optional)
plot(sma7, color=color.green, title="7 Candle SMA")
plot(sma15, color=color.blue, title="15 Candle SMA")
plot(sma60, color=color.red, title="60 Candle SMA")
hline(0, "Zero Line", color=color.gray)
plot(macdLine - signalLine, color=color.blue, title="MACD Histogram")
Detail
https://www.fmz.com/strategy/430864
Last Modified
2023-11-02 15:30:54