
12 KiB
Name
双重均线震荡交易策略Double-Moving-Average-Oscillation-Trading-Strategy
Author
ChaoZhang
Strategy Description
[trans]
概述
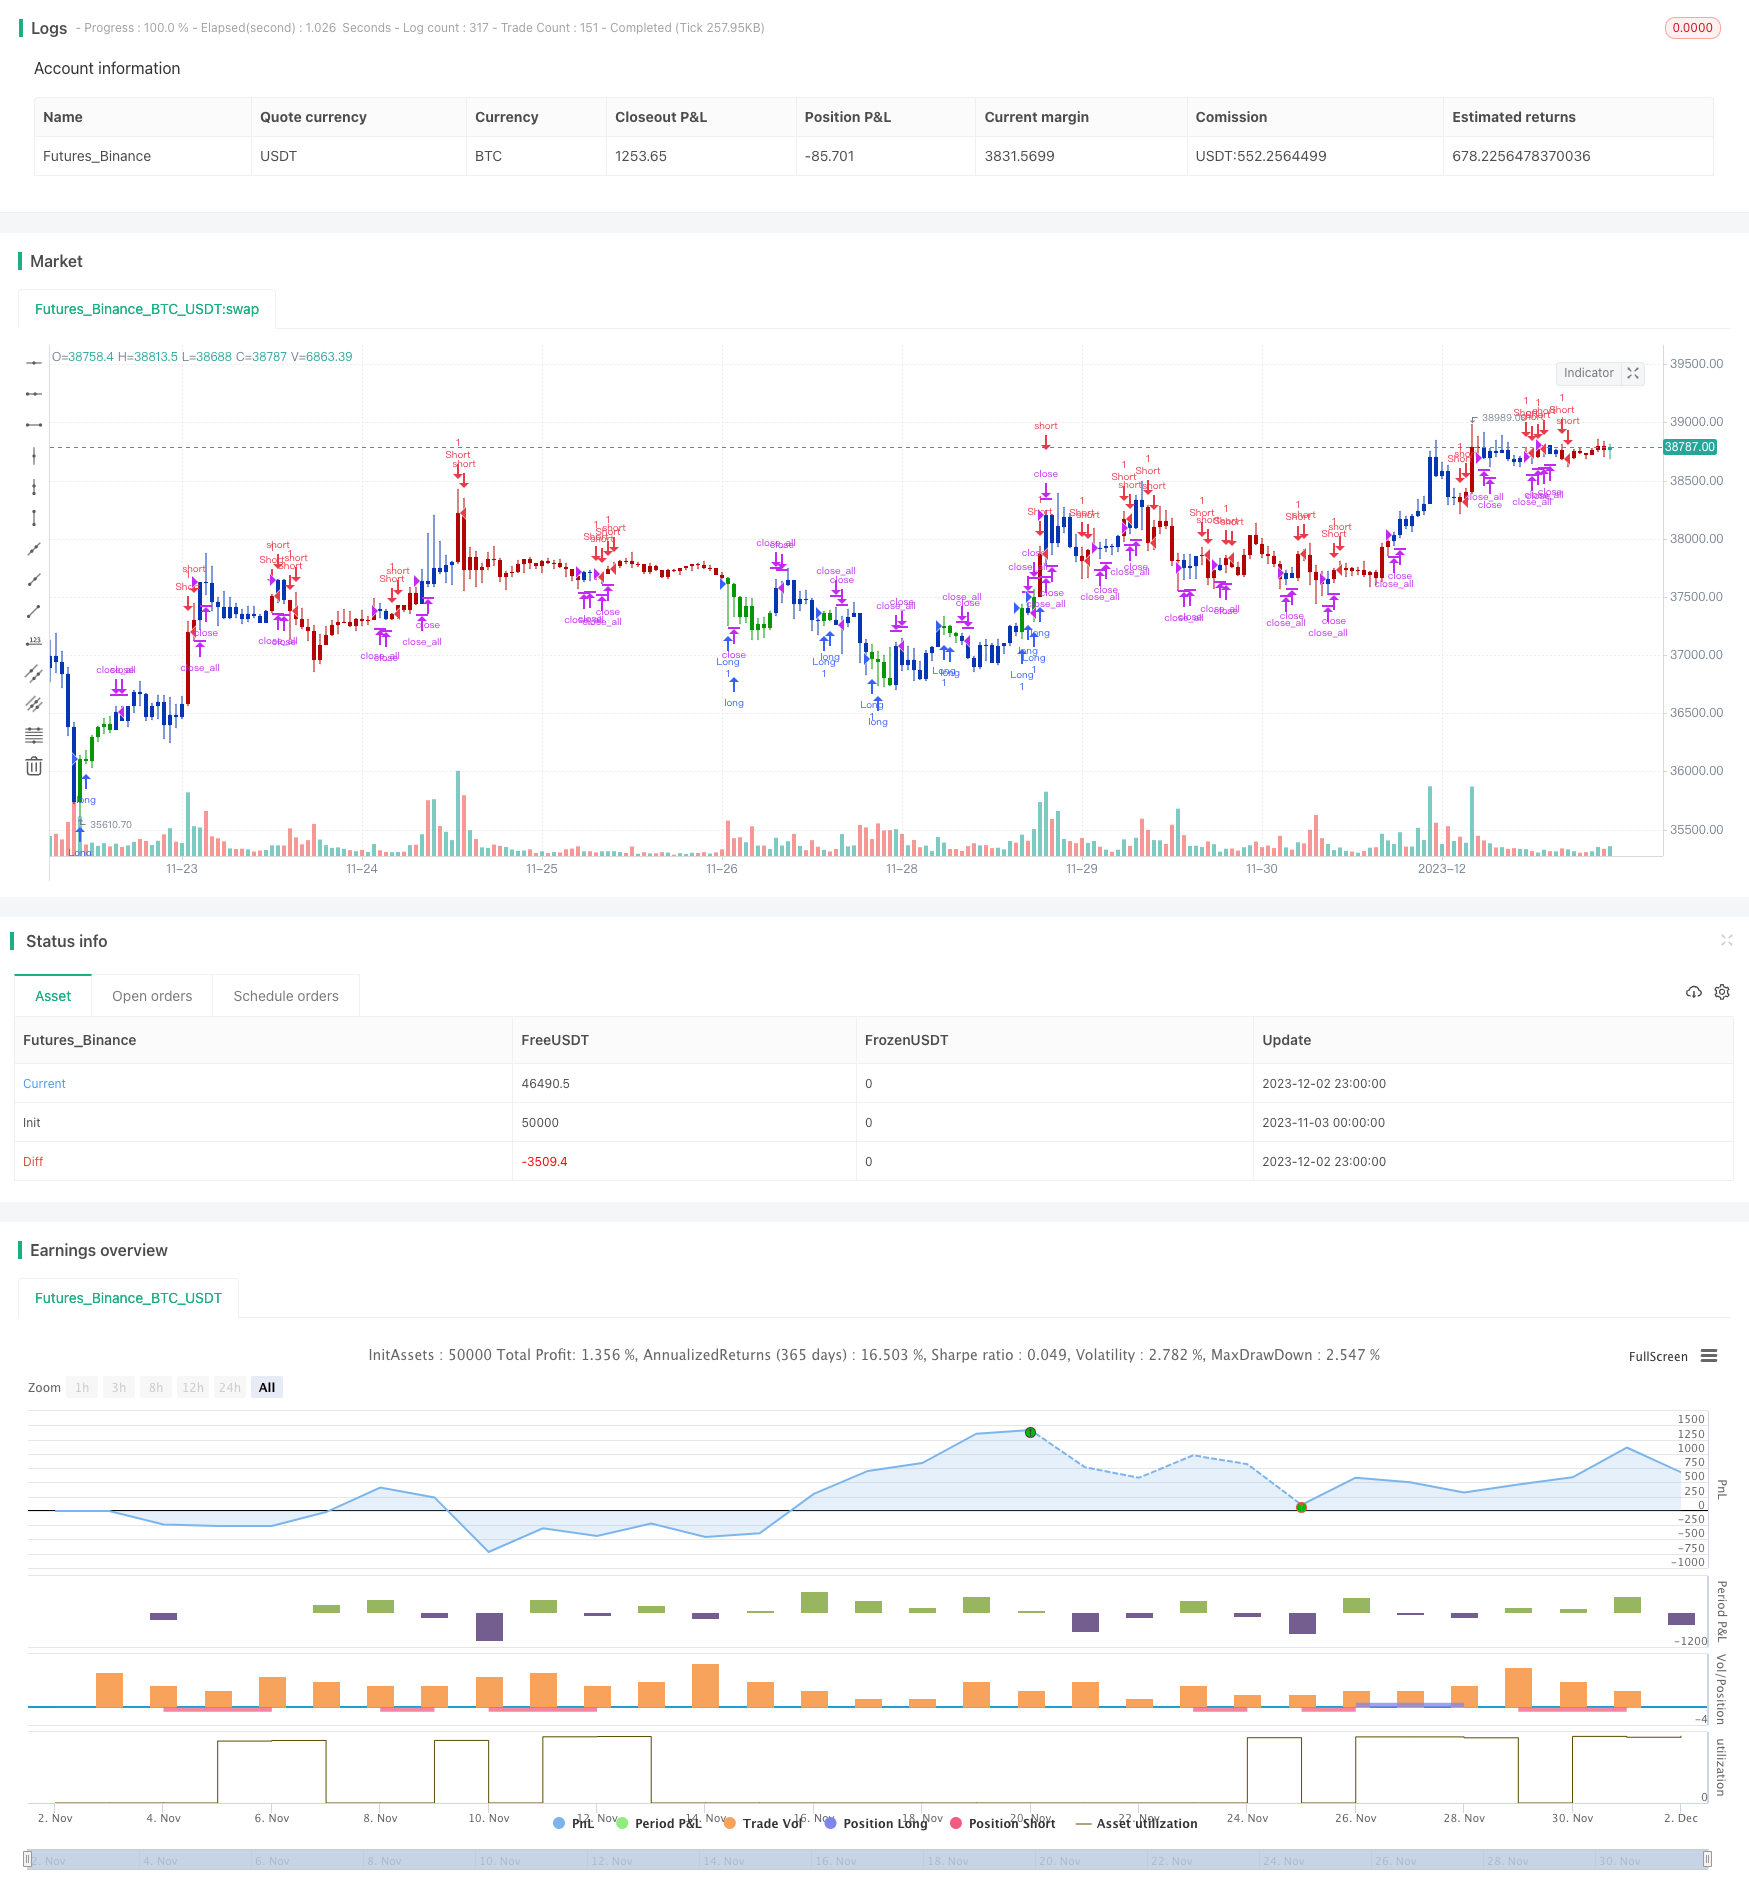
双重均线震荡交易策略通过组合使用2/20指数移动平均线和自适应价格带震荡指标,形成交易信号,实现在震荡行情中获利。该策略主要适用于股指、外汇、商品和数字货币等具有明显震荡特性的市场。
策略原理
双重均线震荡交易策略由两部分组成:
-
2/20指数移动平均线。该指标在价格上涨突破20日线且下跌未跌破2日线时产生买入信号;价格下跌突破2日线且上涨未超过20日线时产生卖出信号。
-
自适应价格带震荡指标。该指标基于价格的波动范围构建价格带,通过价格突破上下价格带判断市场转折点,产生买入和卖出信号。
双重均线震荡交易策略是在2/20指数移动平均线和自适应价格带震荡指标同时发出信号时,才产生实际的交易信号,实现策略交易。这可以有效过滤掉部分无效信号,提高信号的质量。
优势分析
双重均线震荡交易策略结合利用均线指标和波动性指标的优势,具有以下特点:
-
可靠的交易信号。双重指标验证提高信号质量,有效过滤无效信号。
-
适应震荡行情。组合使用均线和价格带指标,可准确判定震荡行情中的转折点。
-
操作频率适中。较双指数移动平均线策略,可以减少无效交易的发生。
-
容易实施自动交易。信号规则清晰,参数设定简单,易于编程实现自动交易。
风险分析
双重均线震荡交易策略也存在以下风险:
-
信号延迟可能较大。双重指标组合过滤信号,可能错过价格快速反转的机会。
-
震荡行情减弱时效果变差。策略主要依赖震荡行情,震荡性减弱时,交易信号和获利空间会随之减少。
-
参数优化影响显著。指标参数设置会对交易结果产生较大影响,需要进行系统优化确定最优参数。
针对以上风险,可以采用动态调整参数的方法应对市场环境变化,同时设置止损策略控制亏损风险。
优化方向
双重均线震荡交易策略可以从以下几个方面进行优化:
- 测试更多均线和价格带参数组合。系统地测试不同长度的均线和价格带参数,寻找最优参数组合。
2.加入成交量指标过滤信号。结合交易量异常信号过滤均线价格信号,可进一步提高信号质量。
-
设置动态止损机制。当市场震荡性减弱时,适当收紧止损点,减小单笔亏损。
-
结合深度学习模型。使用LSTM等深度学习模型对交易信号进行验证,使策略更加智能化。
总结
双重均线震荡交易策略通过组合2/20指数移动平均线和自适应价格带震荡指标,产生高质量的震荡交易信号,能够适应股指、外汇、大宗商品等波动性较大的市场,在震荡区间内进行频繁交易套利。该策略具有信号质量高、容易自动化实现等优势。同时也需要注意控制延迟识别转折点和动态调整参数的风险,在此基础上仍有很大的优化空间。 ||
Overview
The Double Moving Average Oscillation Trading Strategy generates trading signals by combining the 2/20 exponential moving average and the Adaptive Price Zone oscillation indicator to profit in oscillating markets. This strategy is mainly suitable for markets with obvious oscillation characteristics, such as stock index, forex, commodity and digital currency.
Strategy Principle
The Double Moving Average Oscillation Trading Strategy consists of two parts:
-
2/20 Exponential Moving Average. This indicator generates a buy signal when the price breaks through the 20-day line and does not break through the 2-day line on the rise; it generates a sell signal when the price breaks through the 2-day line and does not exceed the 20-day line on the decline.
-
Adaptive Price Zone Oscillation Indicator. This indicator constructs price bands based on the volatility range of prices and judges market turning points by prices breaking through upper and lower price bands to generate buy and sell signals.
The Double Moving Average Oscillation Trading Strategy generates actual trading signals only when the 2/20 exponential moving average and the Adaptive Price Zone oscillation indicator issue signals at the same time to implement strategy trading. This can effectively filter out some invalid signals and improve signal quality.
Advantage Analysis
The Double Moving Average Oscillation Trading Strategy combines the advantages of moving average indicators and volatility indicators, with the following characteristics:
-
Reliable trading signals. Double indicator verification improves signal quality and filters out invalid signals effectively.
-
Adapt to oscillating markets. The combined use of moving average and price band indicators can accurately determine turning points in oscillating markets.
-
Moderate operation frequency. Compared with the dual exponential moving average strategy, it can reduce the occurrence of invalid transactions.
-
Easy to implement automatic trading. The signal rules are clear and the parameters are simple to set, which is easy to program to achieve automatic trading.
Risk Analysis
The Double Moving Average Oscillation Trading Strategy also has the following risks:
-
Signal delay may be large. Combining double indicators to filter signals may miss opportunities for rapid price reversals.
-
Poor performance when oscillation weakens. The strategy relies mainly on oscillating markets, and trading signals and profit margins will decrease as volatility weakens.
-
Significant impact of parameter optimization. Indicator parameter settings can have a greater impact on trading outcomes and need to be systematically optimized for optimum parameters.
In response to the above risks, methods such as dynamically adjusting parameters can be adopted to adapt to market environmental changes, while setting stop loss strategies to control downside risk.
Optimization Directions
The Double Moving Average Oscillation Trading Strategy can be optimized in the following aspects:
-
Test more combinations of moving averages and price bands. Systematically test moving averages and price bands of different lengths to find the optimal parameter combination.
-
Add volume indicator to filter signals. Combining abnormal trading volume signals to filter price signals of moving averages can further improve signal quality.
-
Set dynamic stop loss mechanism. When market volatility weakens, appropriately tighten stop loss points to reduce single loss.
-
Combine deep learning models. Use LSTM and other deep learning models to verify trading signals to make strategies more intelligent.
Summary
The Double Moving Average Oscillation Trading Strategy generates high-quality oscillation trading signals by combining the 2/20 exponential moving average and the Adaptive Price Zone oscillation indicator, which can adapt to volatile markets such as stock index, forex, commodity with large fluctuations and conduct frequent trading arbitrage within the oscillation range. The strategy has advantages such as high signal quality and easy automation. At the same time, risks such as delayed identification of turning points and dynamic adjustment of parameters also need to be controlled, and there is still great room for optimization on this basis.
[/trans]
Strategy Arguments
| Argument | Default | Description |
|---|---|---|
| v_input_1 | 20 | nPeriods |
| v_input_2 | 2 | nBandPct |
| v_input_int_1 | 14 | (?●═════ 2/20 EMA ═════●)Length |
| v_input_bool_1 | false | (?●═════ MISC ═════●)Trade reverse |
| v_input_int_2 | true | (?●═════ Time Start ═════●)From Day |
| v_input_int_3 | true | From Month |
| v_input_int_4 | 2005 | From Year |
Source (PineScript)
/*backtest
start: 2023-11-03 00:00:00
end: 2023-12-03 00:00:00
period: 1h
basePeriod: 15m
exchanges: [{"eid":"Futures_Binance","currency":"BTC_USDT"}]
*/

//@version=5
////////////////////////////////////////////////////////////
//  Copyright by HPotter v1.0 02/03/2022
// This is combo strategies for get a cumulative signal.
//
// First strategy
// This indicator plots 2/20 exponential moving average. For the Mov
// Avg X 2/20 Indicator, the EMA bar will be painted when the Alert criteria is met.
//
// Second strategy
// The adaptive price zone (APZ) is a volatility-based technical indicator that helps investors
// identify possible market turning points, which can be especially useful in a sideways-moving
// market. It was created by technical analyst Lee Leibfarth in the article “Identify the
// Turning Point: Trading With An Adaptive Price Zone,” which appeared in the September 2006 issue
// of the journal Technical Analysis of Stocks and Commodities.
// This indicator attempts to signal significant price movements by using a set of bands based on
// short-term, double-smoothed exponential moving averages that lag only slightly behind price changes.
// It can help short-term investors and day traders profit in volatile markets by signaling price
// reversal points, which can indicate potentially lucrative times to buy or sell. The APZ can be
// implemented as part of an automated trading system and can be applied to the charts of all tradeable assets.
//
// WARNING:
// - For purpose educate only
// - This script to change bars colors.
////////////////////////////////////////////////////////////
EMA20(Length) =>
    pos = 0.0
    xPrice = close
    xXA = ta.ema(xPrice, Length)
    nHH = math.max(high, high[1])
    nLL = math.min(low, low[1])
    nXS = nLL > xXA or nHH < xXA ? nLL : nHH
    iff_1 = nXS < close[1] ? 1 : nz(pos[1], 0)
    pos := nXS > close[1] ? -1 : iff_1
    pos

APZ(nPeriods,nBandPct) =>
    pos = 0.0
    xHL = high - low
    nP = math.ceil(math.sqrt(nPeriods))
    xVal1 = ta.ema(ta.ema(close,nP), nP)
    xVal2 = ta.ema(ta.ema(xHL,nP), nP)
    UpBand = nBandPct * xVal2 + xVal1
    DnBand = xVal1 - nBandPct * xVal2
    pos := low < DnBand ? 1 : high > UpBand ? -1 : pos[1]
    pos

strategy(title='Combo 2/20 EMA & Adaptive Price Zone', shorttitle='Combo', overlay=true)
var I1 = '●═════ 2/20 EMA ═════●'
Length = input.int(14, minval=1, group=I1)
var I2 = '●═════ Adaptive Price Zone  ═════●'
nPeriods = input(20)
nBandPct = input(2)
var misc = '●═════ MISC ═════●'
reverse = input.bool(false, title='Trade reverse', group=misc)
var timePeriodHeader = '●═════ Time Start ═════●'
d = input.int(1, title='From Day', minval=1, maxval=31, group=timePeriodHeader)
m = input.int(1, title='From Month', minval=1, maxval=12, group=timePeriodHeader)
y = input.int(2005, title='From Year', minval=0, group=timePeriodHeader)

StartTrade = time > timestamp(y, m, d, 00, 00) ? true : false
posEMA20 = EMA20(Length)
prePosAPZ = APZ(nPeriods,nBandPct)
iff_1 = posEMA20 == -1 and prePosAPZ == -1 and StartTrade ? -1 : 0
pos = posEMA20 == 1 and prePosAPZ == 1 and StartTrade ? 1 : iff_1
iff_2 = reverse and pos == -1 ? 1 : pos
possig = reverse and pos == 1 ? -1 : iff_2
if possig == 1
    strategy.entry('Long', strategy.long)
if possig == -1
    strategy.entry('Short', strategy.short)
if possig == 0
    strategy.close_all()
barcolor(possig == -1 ? #b50404 : possig == 1 ? #079605 : #0536b3)
Detail
https://www.fmz.com/strategy/434183
Last Modified
2023-12-04 15:28:12