
9.4 KiB
Name
双重反转趋势跟踪策略Dual-Reversal-Trend-Tracking-Strategy
Author
ChaoZhang
Strategy Description
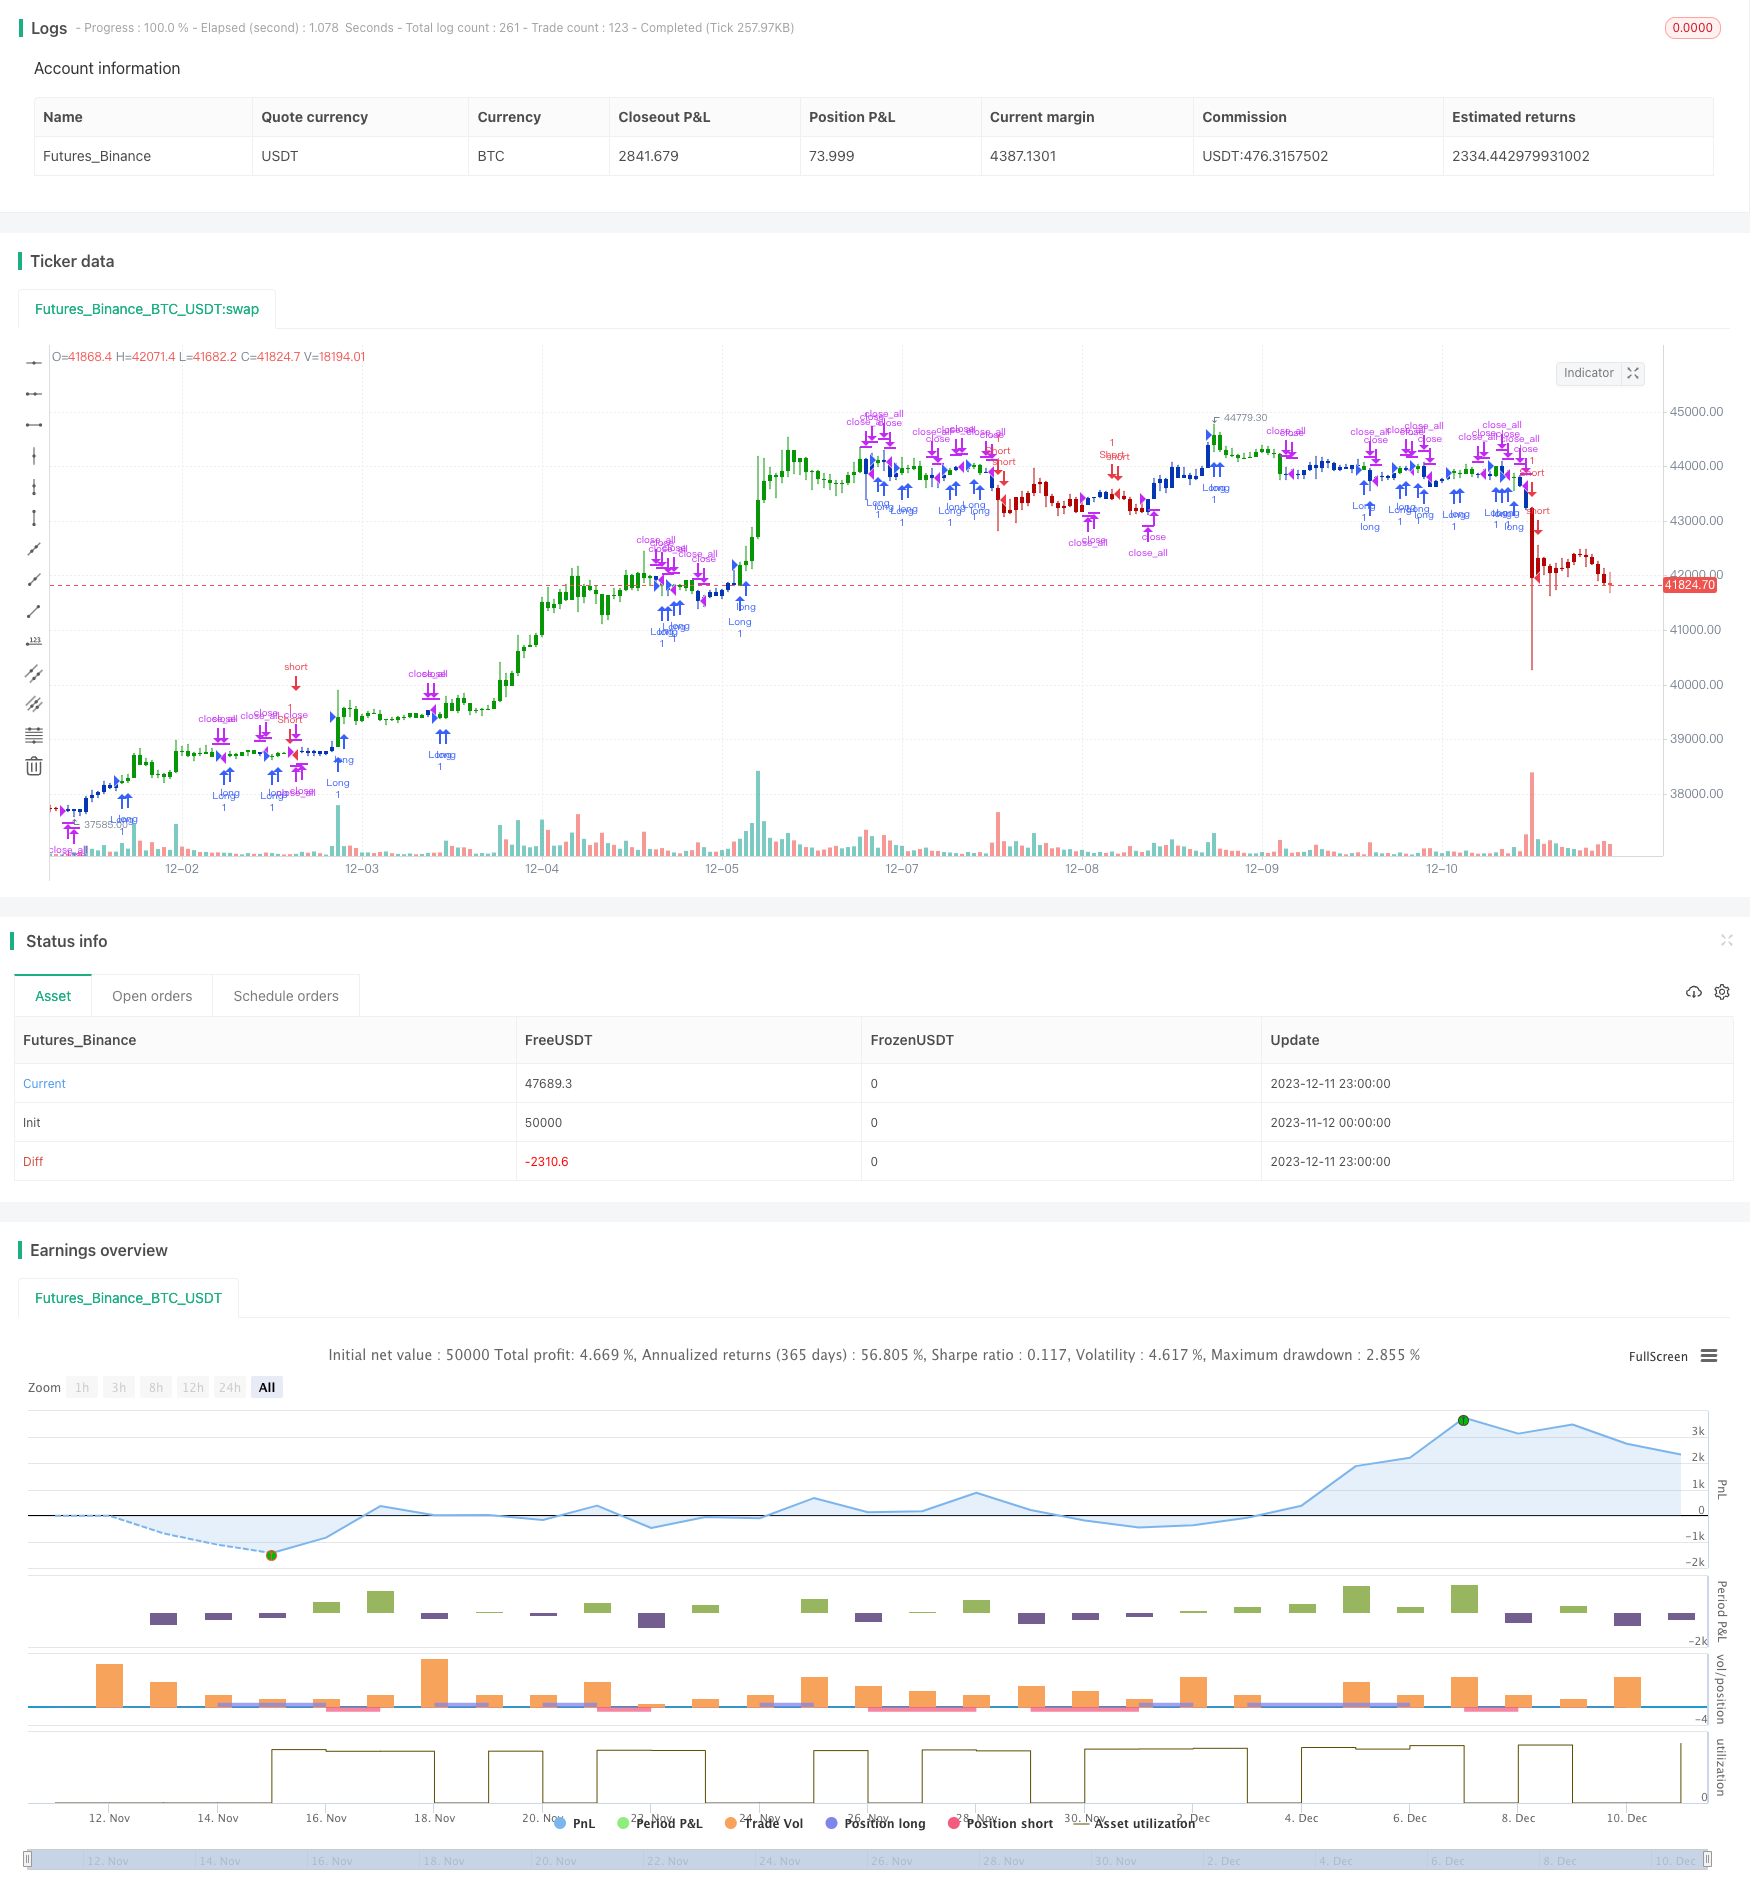 [trans]
概述
这是一个结合双重反转信号的趋势跟踪策略。它整合了123反转策略和性能指数策略,追踪价格反转点,实现更可靠的趋势判断。
策略原理
该策略由两个子策略组成:
-
123反转策略
使用14日K线判断反转信号。具体规则是:
- 多头信号:前两日收盘价下跌,当前K线收盘价高于前一日收盘价,9日Stochastic Slow低于50
- 空头信号:前两日收盘价上涨,当前K线收盘价低于前一日收盘价,9日Stochastic Fast高于50
-
性能指数策略
计算过去14日的涨跌幅作为指标。规则如下:
- 性能指数>(0),产生多头信号
- 性能指数<(0),产生空头信号
最终信号是两种信号的综合。即需要同向的多空信号才会产生实际的买卖操作。
这样可以过滤掉部分噪音,使得信号更加可靠。
策略优势
这种双重反转系统有以下优势:
- 结合双重因素判断,信号更加可靠
- 能够有效过滤市场噪音,避免假信号
- 123形态经典且实用,容易判断和复现
- 性能指数能够判断未来趋势走向
- 参数组合灵活,可进一步优化
策略风险
该策略也存在一些风险:
- 可能错过突发性反转,无法全面捕捉趋势
- 双重条件组合导致信号变少,可能影响盈利能力
- 需要同向判断,容易受到个股特殊波动的影响
- 参数设置问题可能导致信号偏差
可以考虑以下几个方面的优化:
- 调整参数,如K线长度、Stochastic周期等
- 优化双重信号的判断逻辑
- 结合更多因子,如成交量等
- 增加止损机制
总结
该策略整合双重反转判断,能有效发现价格转折点。虽然信号发生概率降低,但可靠性较高,适合捕捉中长线趋势。可以通过参数调整和多因子优化进一步增强策略效果。
||
Overview
This is a trend tracking strategy that combines dual reversal signals. It integrates the 123 reversal strategy and performance index strategy to track price reversal points for more reliable trend judgment.
Strategy Principle
The strategy consists of two sub-strategies:
-
123 Reversal Strategy
Use 14-day K-line to judge reversal signals. The specific rules are:
- Bullish signal: The closing price fell in the previous two days. The current K-line closing price is higher than the previous day's closing price. 9-day Stochastic Slow is lower than 50
- Bearish signal: The closing price rose in the previous two days. The current K-line closing price is lower than the previous day's closing price. 9-day Stochastic Fast is higher than 50
-
Performance Index Strategy
Calculate the increase/decrease percentage over the past 14 days as an indicator. The rules are:
- Performance index > (0), generate bullish signal -Performance index <(0), generate bearish signal
The final signal is a combination of both signals. That is, same direction bullish/bearish signals are required to generate actual buy/sell operations.
This can filter out some noise and make the signals more reliable.
Advantages of the Strategy
This dual reversal system has the following advantages:
- More reliable signals by combining dual factors
- Can effectively filter market noise and avoid false signals
- 123 pattern is classic and practical, easy to judge and reproduce
- Performance index can judge future trend direction
- Flexible parameter combination, can be further optimized
Risks of the Strategy
The strategy also has some risks:
- May miss sudden reversals, cannot fully capture trends
- Dual signal combinations lead to fewer signals, which may affect profitability
- Requires consistent judgment, easily affected by individual stock fluctuations
- Parameter setting problems may lead to signal deviations
Following aspects can be considered for optimization:
- Adjust parameters like K-line length, Stochastic cycle etc.
- Optimize the logic for dual signal judgment
- Incorporate more factors like volume etc.
- Add stop loss mechanism
Summary
The strategy integrates dual reversal judgments to effectively discover price inflection points. Although the probability of signal occurrence decreases, the reliability is higher, suitable for capturing medium and long term trends. The strategy effect can be further enhanced through parameter adjustment and multi-factor optimization. [/trans]
Strategy Arguments
| Argument | Default | Description |
|---|---|---|
| v_input_1 | true | ---- 123 Reversal ---- |
| v_input_2 | 14 | Length |
| v_input_3 | true | KSmoothing |
| v_input_4 | 3 | DLength |
| v_input_5 | 50 | Level |
| v_input_6 | true | ---- Perfomance index ---- |
| v_input_7 | 14 | Period |
| v_input_8 | false | Trade reverse |
Source (PineScript)
/*backtest
start: 2023-11-12 00:00:00
end: 2023-12-12 00:00:00
period: 1h
basePeriod: 15m
exchanges: [{"eid":"Futures_Binance","currency":"BTC_USDT"}]
*/

//@version=4
////////////////////////////////////////////////////////////
//  Copyright by HPotter v1.0 15/04/2021
// This is combo strategies for get a cumulative signal.
//
// First strategy
// This System was created from the Book "How I Tripled My Money In The
// Futures Market" by Ulf Jensen, Page 183. This is reverse type of strategies.
// The strategy buys at market, if close price is higher than the previous close
// during 2 days and the meaning of 9-days Stochastic Slow Oscillator is lower than 50.
// The strategy sells at market, if close price is lower than the previous close price
// during 2 days and the meaning of 9-days Stochastic Fast Oscillator is higher than 50.
//
// Second strategy
// The Performance indicator or a more familiar term, KPI (key performance indicator),
// is an industry term that measures the performance. Generally used by organizations,
// they determine whether the company is successful or not, and the degree of success.
// It is used on a business’ different levels, to quantify the progress or regress of a
// department, of an employee or even of a certain program or activity. For a manager
// it’s extremely important to determine which KPIs are relevant for his activity, and
// what is important almost always depends on which department he wants to measure the
// performance for.  So the indicators set for the financial team will be different than
// the ones for the marketing department and so on.
//
// Similar to the KPIs companies use to measure their performance on a monthly, quarterly
// and yearly basis, the stock market makes use of a performance indicator as well, although
// on the market, the performance index is calculated on a daily basis. The stock market
// performance indicates the direction of the stock market as a whole, or of a specific stock
// and gives traders an overall impression over the future security prices, helping them decide
// the best move. A change in the indicator gives information about future trends a stock could
// adopt, information about a sector or even on the whole economy. The financial sector is the
// most relevant department of the economy and the indicators provide information on its overall
// health, so when a stock price moves upwards, the indicators are a signal of good news. On the
// other hand, if the price of a particular stock decreases, that is because bad news about its
// performance are out and they generate negative signals to the market, causing the price to go
// downwards. One could state that the movement of the security prices and consequently, the movement
// of the indicators are an overall evaluation of a country’s economic trend.
//
// WARNING:
// - For purpose educate only
// - This script to change bars colors.
////////////////////////////////////////////////////////////
Reversal123(Length, KSmoothing, DLength, Level) =>
    vFast = sma(stoch(close, high, low, Length), KSmoothing)
    vSlow = sma(vFast, DLength)
    pos = 0.0
    pos := iff(close[2] < close[1] and close > close[1] and vFast < vSlow and vFast > Level, 1,
	         iff(close[2] > close[1] and close < close[1] and vFast > vSlow and vFast < Level, -1, nz(pos[1], 0)))
	pos


PI(Period) =>
    pos = 0.0
    xKPI = (close - close[Period]) * 100 / close[Period]
    pos := iff(xKPI > 0, 1,
              iff(xKPI < 0, -1, nz(pos[1], 0)))
    pos

strategy(title="Combo Backtest 123 Reversal & Perfomance index", shorttitle="Combo", overlay = true)
line1 = input(true, "---- 123 Reversal ----")
Length = input(14, minval=1)
KSmoothing = input(1, minval=1)
DLength = input(3, minval=1)
Level = input(50, minval=1)
//-------------------------
line2 = input(true, "---- Perfomance index ----")
Period = input(14, minval=1)
reverse = input(false, title="Trade reverse")
posReversal123 = Reversal123(Length, KSmoothing, DLength, Level)
posPI = PI(Period)
pos = iff(posReversal123 == 1 and posPI == 1 , 1,
	   iff(posReversal123 == -1 and posPI == -1, -1, 0))
possig = iff(reverse and pos == 1, -1,
          iff(reverse and pos == -1 , 1, pos))
if (possig == 1 )
    strategy.entry("Long", strategy.long)
if (possig == -1 )
    strategy.entry("Short", strategy.short)
if (possig == 0)
    strategy.close_all()
barcolor(possig == -1 ? #b50404: possig == 1 ? #079605 : #0536b3 )
Detail
https://www.fmz.com/strategy/435291
Last Modified
2023-12-13 18:01:53