
9.1 KiB
Name
双轨跟踪震荡分型策略Dual-track-Oscillator-Pattern-Strategy
Author
ChaoZhang
Strategy Description
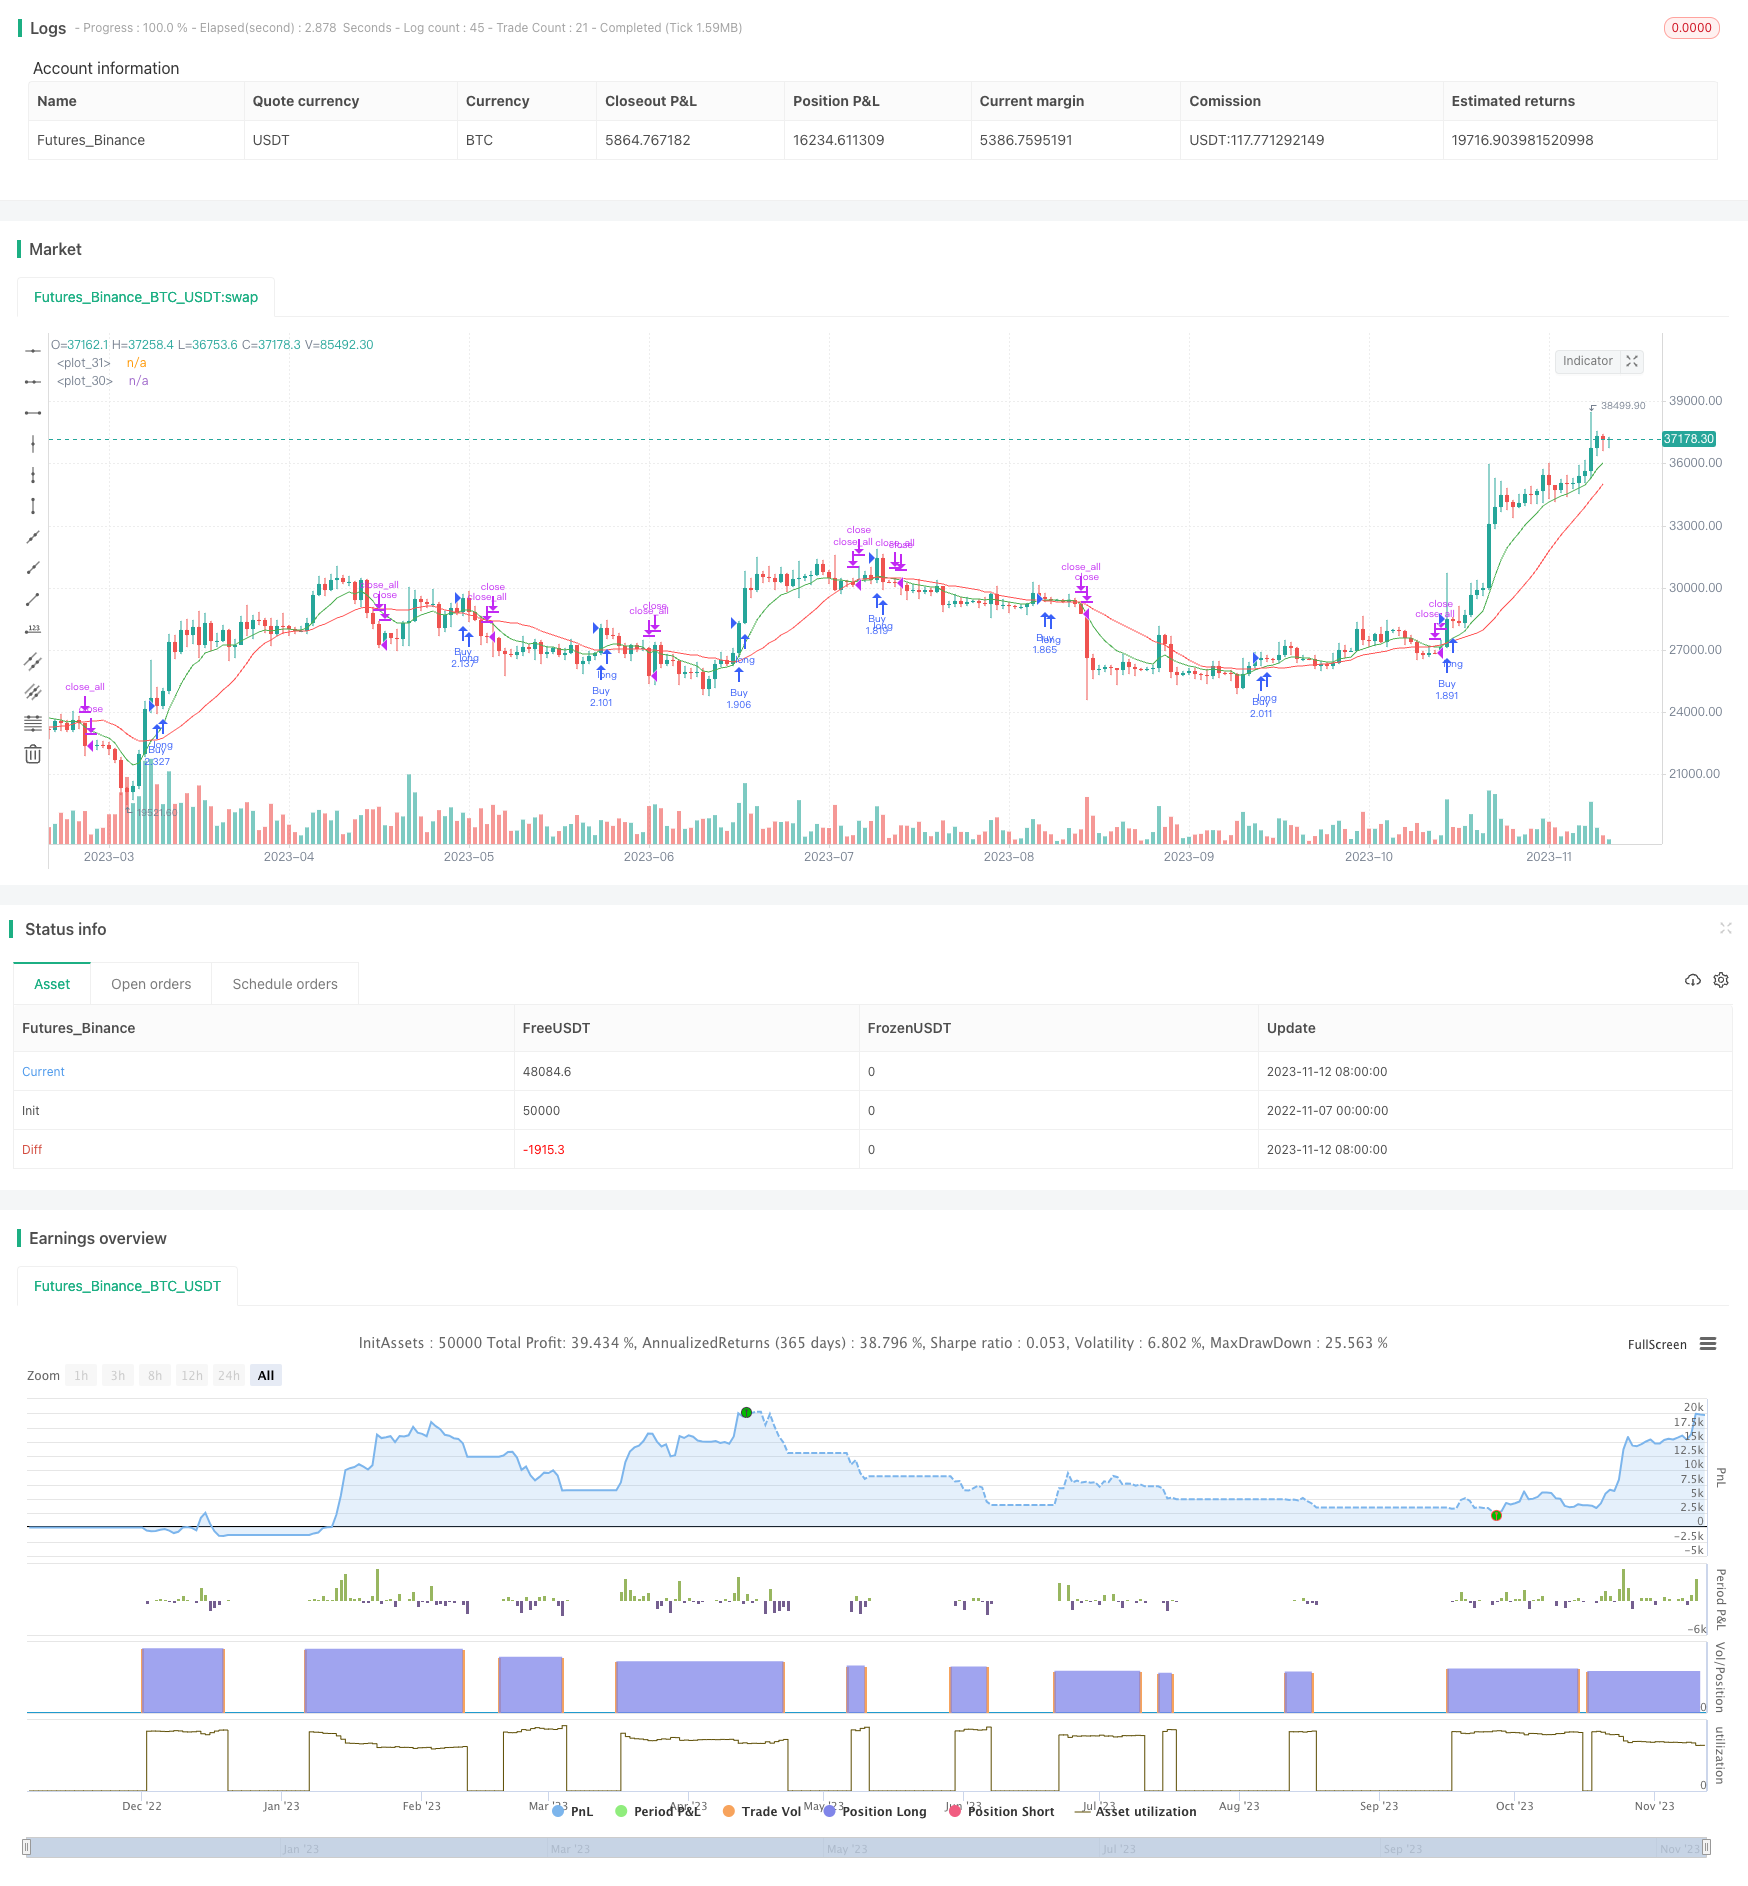 [trans]
概述
双轨跟踪震荡分型策略是一种基于布林带和EMA指标的量化交易策略。该策略 attempts to capture short-term price fluctuations through identifying oscillator patterns based on Bollinger Bands and EMA.
策略原理
该策略同时使用布林带和EMA作为技术指标。布林带包含上轨、中轨和下轨,能够判断价格是否处于震荡区间。EMA是一种趋势跟踪指标,能够判断价格趋势。
该策略首先计算布林带的中轨,也就是价格的n日简单移动均线,其中n值默认为20天。布林带上轨和下轨分别为中轨加/减两个标准差。然后计算9日EMA。
当价格上穿EMA时,视为买入信号;当价格下穿EMA时,视为卖出信号。这样,EMA作为快速均线,能够捕捉价格短期趋势;而布林带中轨作为慢速均线,能过滤掉部分假信号。
所以,该策略通过EMA和布林带的双轨跟踪,尽可能捕捉价格的短期震荡。当EMA上穿中轨时买入,EMA下穿中轨时卖出。
策略优势分析
这种双轨跟踪策略有以下几个优势:
-
使用EMA和布林带中轨双轨跟踪,能够同时判断趋势和震荡,更准确地捕捉短期价格波动。
-
EMA作为快速均线,布林带中轨作为慢速均线,二者配合使用,可以有效过滤假信号,提高信号质量。
-
指标参数可调整,n值和布林带标准差可根据市场调整,适应性强。
-
策略思路简单清晰易于实现,非常适合短期震荡行情。
-
可适当优化参数,结合其他指标过滤,进一步提高策略稳定性。
风险分析
该策略也存在一些潜在风险:
-
布林带上下轨容易形成支撑和压力,可能会提前触发止损。
-
EMA和布林带中轨交叉时,价格可能出现背离,发出错误信号。
-
大幅趋势行情时,EMA容易形成san杯底买点或三山顶卖点,可能错过趋势。
-
震荡行情减弱时,交易信号将明显减少,无法持续盈利。
-
参数设置不当可能导致过度交易或漏失交易机会。
-
交易费用会降低实际盈利,需要控制好仓位规模。
策略优化方向
该策略可以从以下几个方面进行优化:
-
增加成交量等指标,过滤信号质量不佳的交叉信号。
-
结合RSI等超买超卖指标,避免买卖点出现在极端区域。
-
根据ATR值来设置止损和止盈,使止损更合理。
-
增加对趋势的判断,避免趋势行情下产生错误信号。
-
优化参数,如EMA周期、布林带参数等,使之更符合不同市场环境。
-
采用机器学习方法动态优化参数,使策略更具鲁棒性。
-
采用算法交易,设置更严格的入场和出场条件,减少人为干预。
总结
双轨跟踪震荡分型策略同时利用EMA和布林带双轨跟踪价格,通过EMA上穿中轨买入,EMA下穿中轨卖出,捕捉短期价格震荡,是一个较为简单实用的短线策略。该策略具有趋势判断和滤除假信号的优势,但也存在一定的风险。通过不断优化参数设置、入场出场条件等,该策略可以变得更稳定可靠,适用于更多市场环境,是一个值得学习和应用的策略思路。
||
Overview
The Dual-track Oscillator Pattern strategy is a quantitative trading strategy based on Bollinger Bands and EMA indicators. It attempts to capture short-term price fluctuations through identifying oscillator patterns based on Bollinger Bands and EMA.
Strategy Logic
The strategy uses both Bollinger Bands and EMA as technical indicators. Bollinger Bands contain upper, middle and lower bands to judge if price is oscillating. EMA is a trend following indicator to determine price trend.
First, the middle band of Bollinger Bands is calculated as the n-day simple moving average of price, where n defaults to 20 days. The upper and lower bands are middle band plus/minus two standard deviations. Then the 9-day EMA is calculated.
When price crosses above EMA, it is a buy signal. When price crosses below EMA, it is a sell signal. So EMA as a fast moving average captures short-term trend, while the middle band as a slow moving average filters some false signals.
By tracking dual bands of EMA and Bollinger Bands middle line, the strategy aims to capture short-term price oscillations. It buys when EMA crosses above middle line, and sells when EMA crosses below middle line.
Advantage Analysis
The dual-track strategy has the following advantages:
-
Using EMA and Bollinger Bands middle line dual tracks, it can judge both trend and oscillation, and more accurately capture short-term price fluctuations.
-
EMA as fast MA and middle band as slow MA work together to effectively filter false signals and improve signal quality.
-
Indicator parameters are adjustable. The n value and Bollinger Bands standard deviation can be adjusted according to market conditions for better adaptability.
-
The strategy logic is simple and clear, very suitable for short-term oscillating markets.
-
It can be optimized by adjusting parameters and incorporating other filters to further improve stability.
Risk Analysis
The strategy also has some potential risks:
-
Bollinger Bands upper and lower bands can form support and resistance easily, triggering premature stop loss.
-
Divergence may happen between EMA and middle band when they cross, generating incorrect signals.
-
In strong trending markets, EMA may form W-bottoms and M-tops, missing the trend.
-
Trading signals will reduce significantly when oscillation weakens, unable to sustain profitability.
-
Inadequate parameter tuning may lead to overtrading or missing opportunities.
-
Transaction costs erode actual profits, position sizing needs control.
Optimization Directions
The strategy can be optimized in the following aspects:
-
Add volume to filter low quality crossover signals.
-
Combine RSI to avoid buying/selling in overbought/oversold levels.
-
Use ATR to set more reasonable stop loss and take profit.
-
Add trend judgment to avoid wrong signals in trending markets.
-
Optimize parameters like EMA period and Bollinger Bands settings to suit different market environments.
-
Use machine learning to dynamically optimize parameters for robustness.
-
Adopt algorithmic trading with strict entry and exit rules to minimize human interference.
Summary
The Dual-track Oscillator Pattern strategy tracks price using dual bands of EMA and Bollinger Bands middle line. It buys when EMA crosses above middle band, and sells when EMA crosses below middle band, to capture short-term price oscillations. This simple short-term strategy has the advantage of filtering false signals and judging trends, but also has some risks. By continuously optimizing parameters, entry/exit rules etc., it can become more robust and applicable to more market environments, making it a worthwhile strategy approach to learn and apply.
[/trans]
Strategy Arguments
| Argument | Default | Description |
|---|---|---|
| v_input_1 | 20 | length |
| v_input_2 | 9 | lengthEMA |
| v_input_3_close | 0 | Source: close |
| v_input_4_close | 0 | Source EMA: close |
| v_input_5 | 2019 | From Year |
| v_input_6 | true | From Month |
| v_input_7 | true | From Day |
| v_input_8 | 9999 | To Year |
| v_input_9 | 12 | To Month |
| v_input_10 | 31 | To Day |
Source (PineScript)
/*backtest
start: 2022-11-07 00:00:00
end: 2023-11-13 00:00:00
period: 1d
basePeriod: 1h
exchanges: [{"eid":"Futures_Binance","currency":"BTC_USDT"}]
*/

//@version=4
strategy(shorttitle="BBXEMA", title="Bollinger Bands Cross EMA", default_qty_type=strategy.percent_of_equity, default_qty_value=100, overlay=true)
length = input(20, minval=1)
lengthEMA = input(9)
src = input(close, title="Source")
srcEMA = input(close, title="Source EMA")
//mult = input(2.0, minval=0.001, maxval=50)

// === INPUT BACKTEST RANGE ===
FromYear  = input(defval = 2019, title = "From Year", minval = 2009)
FromMonth = input(defval = 1, title = "From Month", minval = 1, maxval = 12)
FromDay   = input(defval = 1, title = "From Day", minval = 1, maxval = 31)
ToYear    = input(defval = 9999, title = "To Year", minval = 2009)
ToMonth   = input(defval = 12, title = "To Month", minval = 1, maxval = 12)
ToDay     = input(defval = 31, title = "To Day", minval = 1, maxval = 31)

// === FUNCTION EXAMPLE ===
start     = timestamp(FromYear, FromMonth, FromDay, 00, 00)  // backtest start window
finish    = timestamp(ToYear, ToMonth, ToDay, 23, 59)        // backtest finish window
window()  => true
basis = sma(src, length)
EMA = ema(srcEMA,lengthEMA)
//dev = mult * stdev(src, length)
//upper = basis + dev
//lower = basis - dev

Buy = crossover(EMA,basis)
Sell = crossunder(EMA,basis)

bb = plot(basis, color=color.red)
signal = plot(EMA, color=color.green)
//p1 = plot(upper, color=color.blue)
//p2 = plot(lower, color=color.blue)
//fill(p1, p2)

strategy.entry("Buy",true,when=window() and Buy)
strategy.close_all(when=window() and Sell)
Detail
https://www.fmz.com/strategy/432096
Last Modified
2023-11-14 14:12:16