
11 KiB
Name
双轨跑赢大盘指数的分型规律量化策略EMA-MACD-Quantitative-Strategy-With-Dual-Track-Running-and-Leading-the-Market-Index
Author
ChaoZhang
Strategy Description
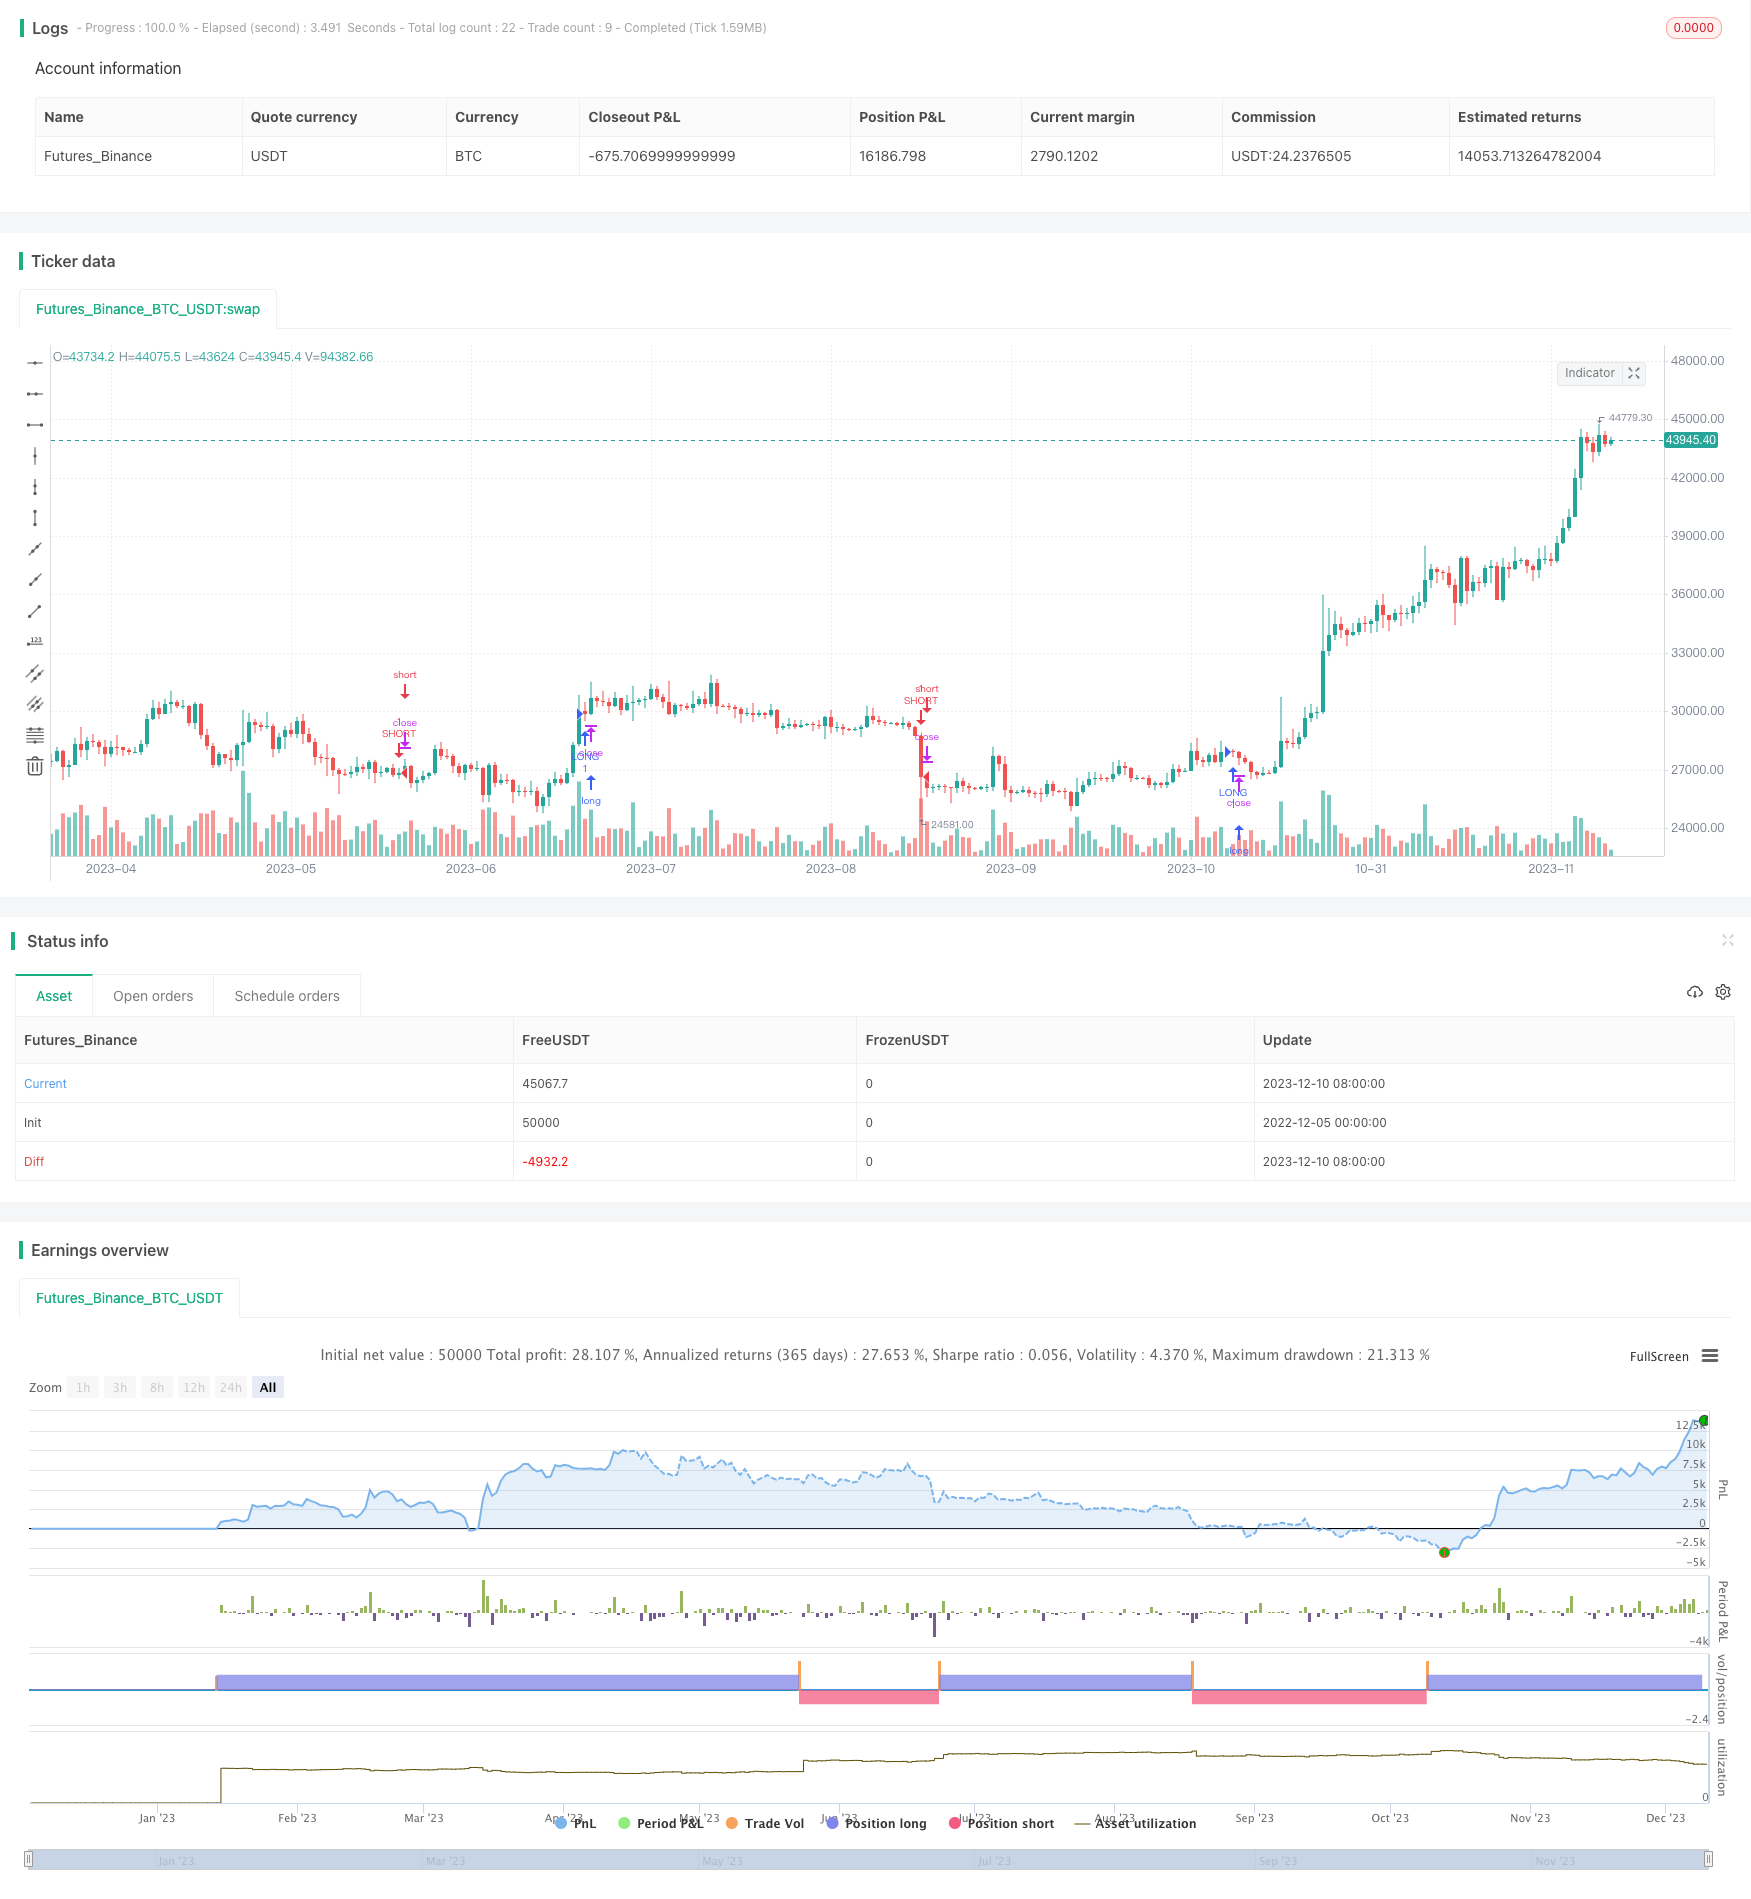 [trans]
概述
本策略主要利用EMA移动平均线和MACD指标,判断行情分型的变化,进行追涨杀跌的操作。核心思路是当短期EMA线从下方突破长期EMA线而MACD同时上穿0轴向上时,做多;当短期EMA从上方突破长期EMA而MACD同时下穿0轴向下时,做空。
原理
该策略融合了移动平均线指标和MACD指标。
首先,它使用了两个不同长度周期的EMA指标,一个是25周期EMA线,一个是50周期EMA线。25周期EMA线能反映短期趋势,50周期EMA线能反映中长期趋势。当短期EMA线从下方上穿长期EMA线时,表示行情从下跌转为上涨,属于金叉信号,做多判断。当短期EMA从上方下穿长期EMA时,表示行情从上涨转为下跌,属于死叉信号,做空判断。
其次,该策略同时结合MACD指标判信号。MACD指标包括DIF线和DEA线,代表短期和长期指数平滑移动平均线的差值,通过双EMA算出。本策略设置DIF为12日EMA减26日EMA。DEA线为DIF的9日指数移动平均。DIF线代表动量,DEA线代表MACD的平均值。当DIF从下方上穿DEA线时产生买入信号。当DIF从上方下穿DEA时产生卖出信号。
综合这两个指标,当发生25日EMA金叉50日EMA,同时MACD的DIF线上穿DEA线时,产生买入信号,做多;当发生25日EMA死叉50日EMA,同时MACD的DIF线下穿DEA线时,产生卖出信号,做空。
优势分析
这是一个非常典型的双轨策略,同时结合MACD指标产生更可靠的交易信号,具有以下优势:
-
使用双EMA均线,能避免whipsaws现象和假突破,产生更可靠的交易信号。
-
融合MACD指标,能进一步验证交易信号,避免EMA双轨假信号的风险,提高策略的实战效果。
-
采用25和50日线作为快慢线,参数选择更为准确,能捕捉到中短线明显的趋势变化。
-
利用追涨杀跌思路,能跑赢大盘指数,在行情大幅上涨和下跌时获得较大收益。
-
策略逻辑简单清晰,容易理解和实施,适合量化初学者使用。
-
可谨慎适当优化参数,使策略更好地适应不同品种和行情环境。
风险分析
该策略也存在一些风险需要警惕:
-
EMA均线产生假信号的可能性依然存在,如遇剧烈行情,仍会出现whipsaw现象。
-
MACD指标参数需要不断优化和调整,否则会产生错误信号或者信号滞后。
-
需要警惕止损点设置是否合理,避免无效突破造成较大亏损。
-
需要关注行情和政策环境变化,避免系统性风险造成较大亏损。
-
需要控制仓位规模和杠杆水平,防止单边大行情爆仓。
优化方向
该策略还可以从以下几个维度进行优化:
-
测试更加准确和实战有效的参数组合,如测试20日和60日EMA均线作为交易轨,DIF为10日EMA和20日EMA差值等。
-
增加成交量指标的确认,避免低量假突破。
-
结合波动率指标如ATR确定更科学的止损方式。
-
利用机器学习算法自动优化参数,使策略参数动态适应市场环境变化。
-
增加仓位控制模块,让仓位规模可随交易表现和衡量指标动态变化。
-
可在更长周期的图表上绘制该策略信号,辅助决策更长线方向的操作。
总结
本策略整合了移动平均线指标和MACD指标的优点,通过双EMA均线判断质量比较高的K线分型,配合DIF和DEA判断MACD动量方向的匹配,形成了一个稳定、实战效果较好的追涨杀跌型量化策略。该策略逻辑简单清晰,易于理解和优化,非常适合量化学习者入门和实战。通过不断测试和优化参数,该策略可以成为跑赢指数的价值策略之一。
||
Overview
This strategy mainly utilizes the EMA moving average line and MACD indicator to determine the changes in market patterns and performs momentum trading strategies. The core idea is to go long when the short-term EMA line crosses above the long-term EMA line and the MACD simultaneously crosses above 0, and go short when the short-term EMA crosses below the long-term EMA and the MACD simultaneously crosses below 0.
Principle
This strategy integrates the moving average line indicator and the MACD indicator.
First, it uses two EMA indicators with different cycle lengths, one is the 25 cycle EMA line and the other is the 50 cycle EMA line. The 25 cycle EMA line can reflect short-term trends while the 50 cycle EMA line reflects medium-and-long term trends. When the short-term EMA line crosses above the long-term EMA line from the bottom, it indicates the market is turning from decline to upside, which is a golden cross signal for going long. When the short-term EMA crosses below the long-term EMA from above, it indicates the market is turning from upside to downside, which is a death cross signal for going short.
At the same time, the strategy also incorporates MACD indicator signals. The MACD indicator includes a DIF line and a DEA line, which represent the difference between short-term and long-term exponential moving averages, calculated by double EMAs. This strategy sets the DIF as the difference between 12-day EMA and 26-day EMA. The DEA line is the 9-day exponential moving average of the DIF. The DIF line represents momentum while the DEA line represents the MACD average. When the DIF crosses above the DEA line from the bottom, it generates a buy signal. When the DIF crosses below the DEA from above, it generates a sell signal.
Combining these two indicators, a long entry signal is generated when the 25-day EMA has a golden cross of the 50-day EMA, while the MACD's DIF line crosses above the DEA line. A short entry signal is generated when the 25-day EMA has a death cross of the 50-day EMA, while the MACD'S DIF line crosses below the DEA line.
Advantage Analysis
This is a very typical dual-track strategy which integrated with the MACD indicator to generate more reliable trading signals with the following advantages:
-
Using dual EMA lines can avoid whipsaws and false breakouts to generate more reliable trading signals.
-
Integrating the MACD indicator can further verify trading signals and avoid the risk of false EMA dual-track signals, improving the practical effectiveness of the strategy.
-
Using the 25-day and 50-day line as the fast and slow line, the parameter selection is more accurate which can capture significant trend changes in medium-and-short term cycles.
-
By chasing momentum and mean reversion mindset, this strategy can outrun the benchmark index and achieve significant returns during sharp uptrends and downtrends on the broader market.
-
The strategy logic is simple and straightforward, easy for understanding and implementation, suitable for quantitative beginners.
-
Parameters can be carefully optimized to better adapt the strategy across different products and market environments.
Risk Analysis
There are still some risks worth noticing for this strategy:
-
The possibility of false EMA signals remains, whipsaw may still occur in violent market movements.
-
MACD parameters need continuous optimization and adjustment, otherwise incorrect signals or signal lags may occur.
-
Need to be cautious of whether the stop loss point setting is reasonable to avoid ineffective breakthroughs causing greater losses.
-
Need to pay attention to changes in market and policy environments to avoid systemic risks causing greater losses.
-
Need to control position sizing and leverage level to prevent the risk of forced liquidation from one-sided trends.
Optimization Directions
This strategy can also be optimized in the following aspects:
-
Test more accurate parameter combinations with higher practical efficiency, such as using 20-day and 60-day EMA lines as trading tracks, with DIF as the difference between 10-day EMA and 20-day EMA.
-
Increase confirmation from trading volume indicators to avoid low-volume false breakouts.
-
Incorporate volatility indicators like ATR to determine more scientific stop loss methods.
-
Utilize machine learning algorithms to automatically optimize parameters for dynamically adapting to changing market environments.
-
Add position sizing control module for dynamically adjusting sizes based on strategy performance and metrics.
-
Can plot strategy signals on higher timeframe charts to assist decisions on longer-term directional trades.
Summary
This strategy integrates the strengths of moving average line indicators and MACD indicators by judging higher quality candlestick patterns through dual EMA lines combined with DIF and DEA matching on MACD momentum direction, forming a steady and efficient momentum trading strategy. The logic is simple and easy to understand and optimize, very suitable for quant traders to get started and implementation. Through continuous testing and optimizing, this strategy can become one of the value strategies that outperforms indices.
[/trans]
Strategy Arguments
| Argument | Default | Description |
|---|---|---|
| v_input_1 | 12 | Fast Length |
| v_input_2 | 26 | Slow Length |
| v_input_3_close | 0 | Source: close |
| v_input_4 | 9 | Signal Smoothing |
| v_input_5 | 0 | Oscillator MA Type: EMA |
| v_input_6 | 0 | Signal Line MA Type: EMA |
| v_input_7 | 25 | Len Ema 1 |
| v_input_8 | 50 | Len Ema 2 |
Source (PineScript)
/*backtest
start: 2022-12-05 00:00:00
end: 2023-12-11 00:00:00
period: 1d
basePeriod: 1h
exchanges: [{"eid":"Futures_Binance","currency":"BTC_USDT"}]
*/

//@version=4
strategy(title="EMA+MACD", shorttitle="EMA+MACD", overlay=true)
// Getting inputs
fast_length = input(title="Fast Length", type=input.integer, defval=12)
slow_length = input(title="Slow Length", type=input.integer, defval=26)
src = input(title="Source", type=input.source, defval=close)


signal_length = input(title="Signal Smoothing", type=input.integer, minval = 1, maxval = 50, defval = 9)
sma_source = input(title="Oscillator MA Type", type=input.string, defval="EMA", options=["SMA", "EMA"])
sma_signal = input(title="Signal Line MA Type", type=input.string, defval="EMA", options=["SMA", "EMA"])

fast_ma = sma_source == "SMA" ? sma(src, fast_length) : ema(src, fast_length)
slow_ma = sma_source == "SMA" ? sma(src, slow_length) : ema(src, slow_length)
macd = fast_ma - slow_ma
signal = sma_signal == "SMA" ? sma(macd, signal_length) : ema(macd, signal_length)
hist = macd - signal
len1 = input(title="Len Ema 1 ",type=input.integer,defval=25)
len2 = input(title="Len Ema 2 ",type=input.integer,defval=50)
ema1 = ema(src,len1)
ema2 = ema(src,len2)

bull = crossover(ema1,ema2) and macd > 0
bear = crossover(ema2,ema1) and macd < 0
l1 = bull ? label.new(x=bar_index,y=low,yloc=yloc.belowbar,text="BUY",color=color.green,textcolor=color.white,style=label.style_triangleup) : na
l2 = bear ? label.new(x=bar_index,y=high,yloc=yloc.abovebar,text="SELL",color=color.red,textcolor=color.white,style=label.style_triangledown) : na


strategy.entry("LONG",strategy.long,when=bull)
strategy.entry("SHORT",strategy.short,when=bear)
Detail
https://www.fmz.com/strategy/435100
Last Modified
2023-12-12 12:13:25