
7.9 KiB
Name
双线性BB口系统策略Dual-Moving-Average-Bollinger-Band-System-Strategy
Author
ChaoZhang
Strategy Description
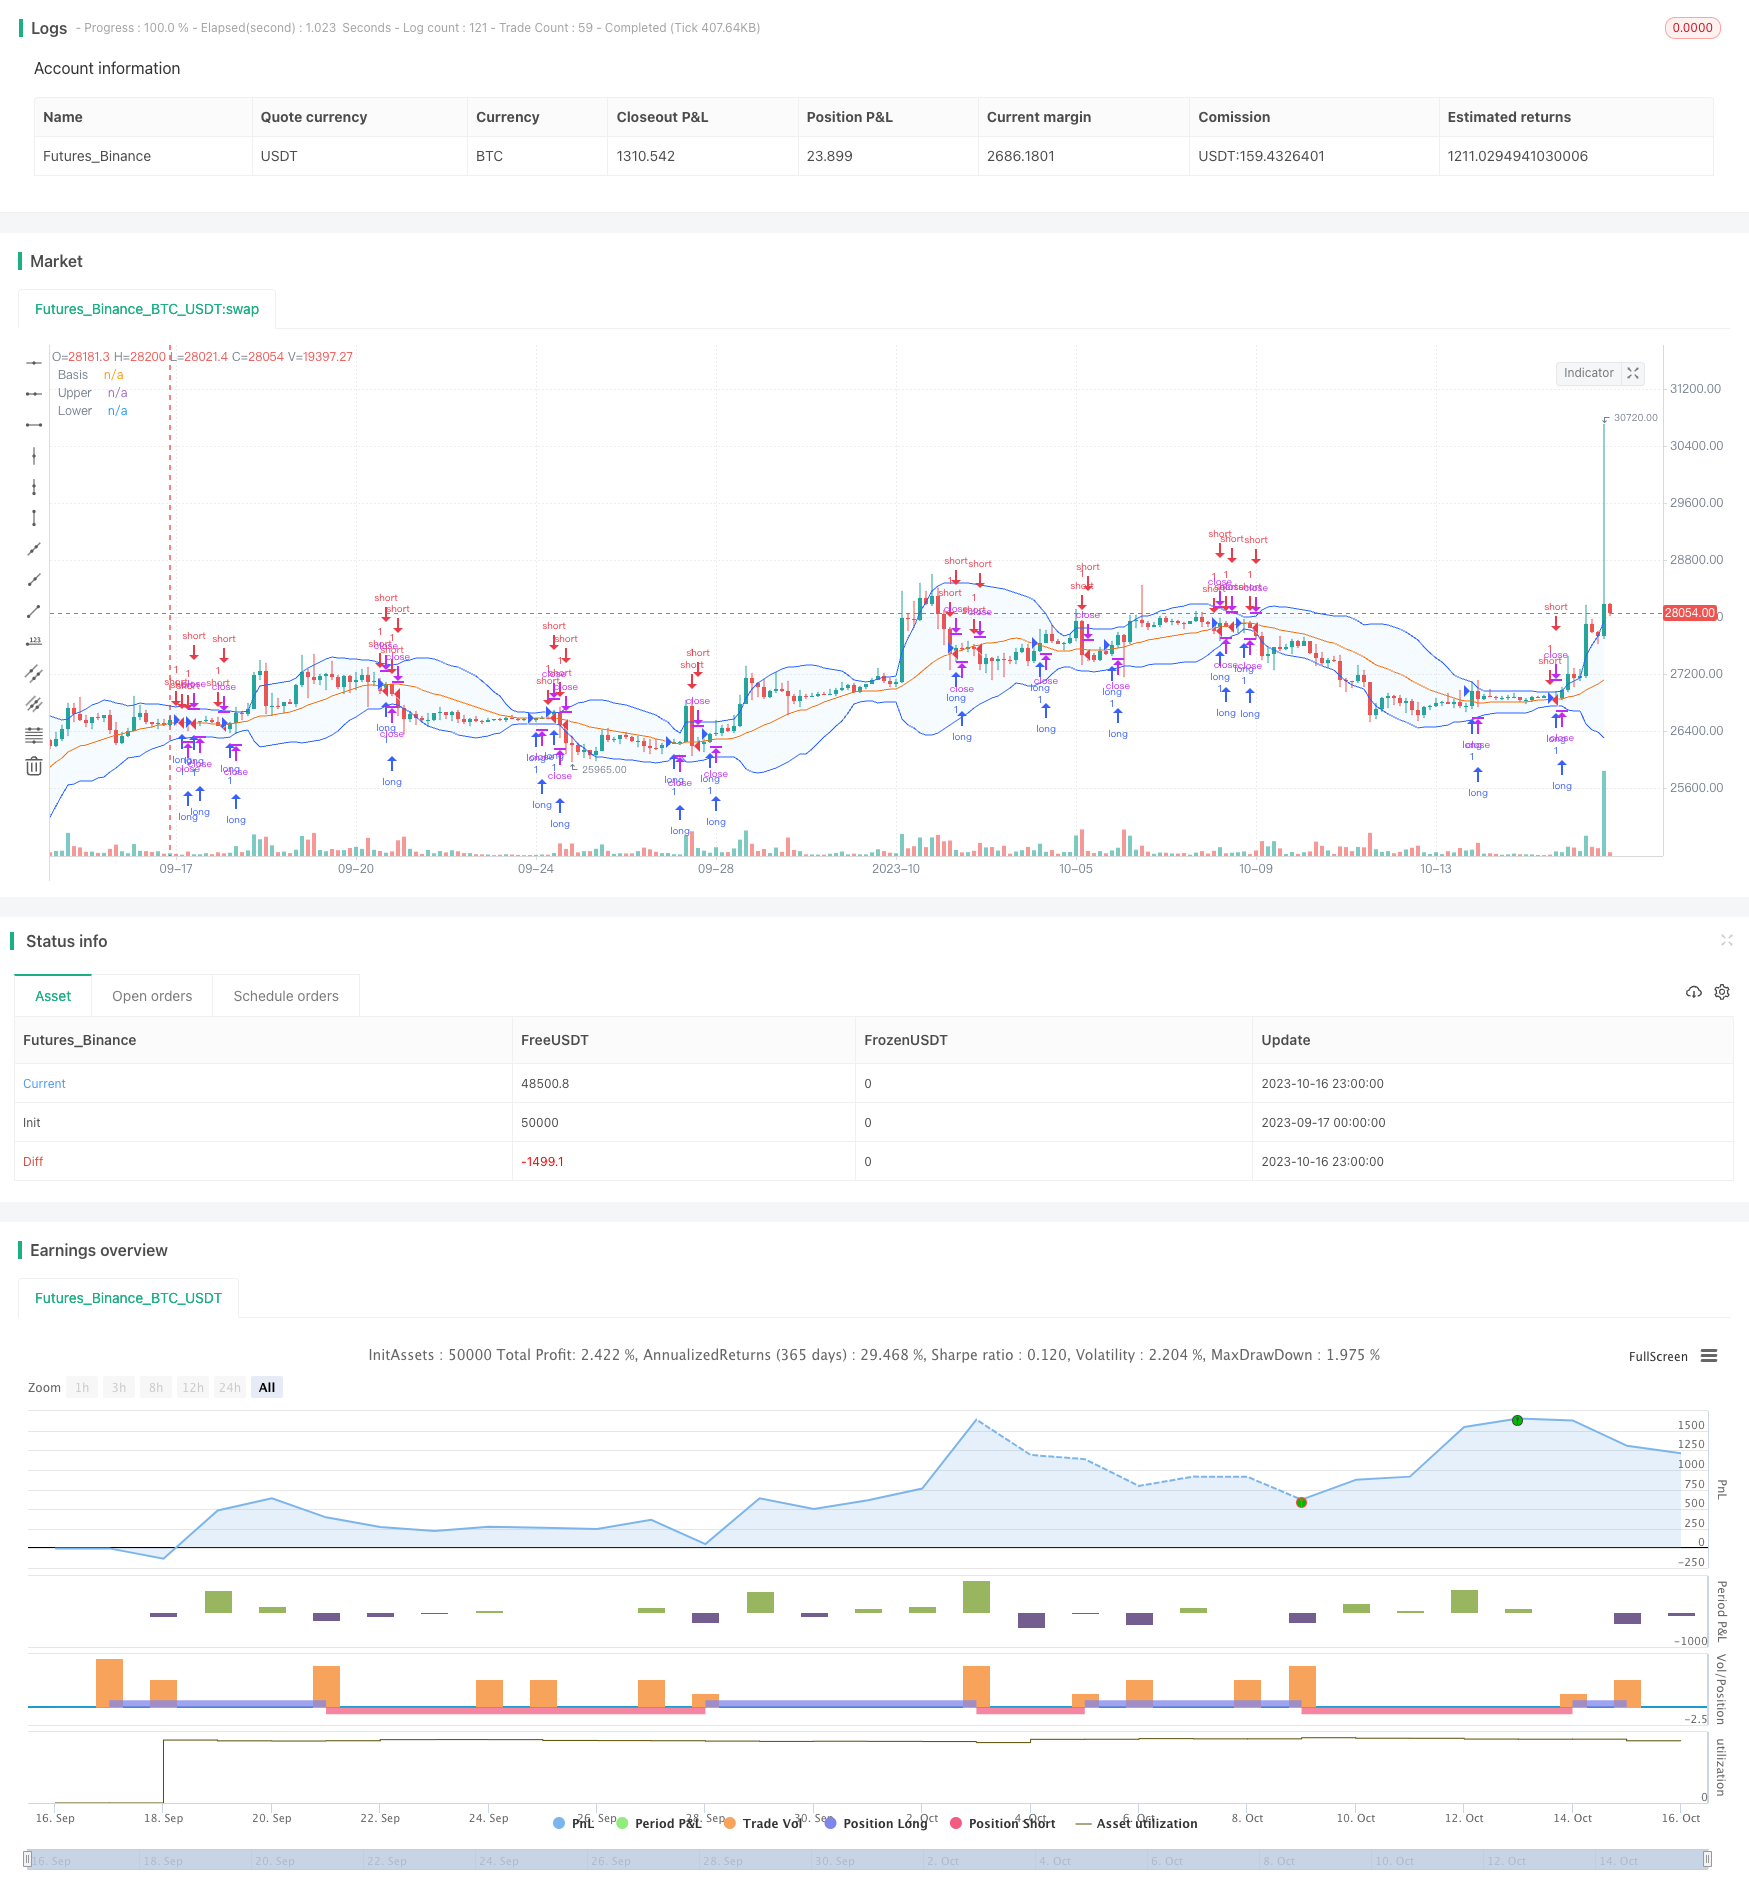
[trans]
概述
双线性BB口系统策略是一种典型的碰口交易策略。策略利用波动性指标布林带,通过双线口开仓,结合止盈止损管理资金,实现盈利。
原理
该策略主要基于布林带指标,布林带由均线、带宽决定。策略首先计算n周期的收盘价均线作为中轨,带宽为中轨的m倍标准差。然后分别绘制中轨上下各m个标准差的上轨和下轨。价格碰触上轨时看空,碰触下轨时看多。
具体来说,策略通过以下步骤实现:
-
输入参数:计算均线长度n,标准差倍数m
-
计算中轨:n周期收盘价的简单移动均线
-
计算上轨:中轨 + m * n周期收盘价标准差
-
计算下轨:中轨 - m * n周期收盘价标准差
-
画出中轨、上轨、下轨
-
当收盘价由下向上穿过中轨时,做多
-
当收盘价由上向下穿过中轨时,做空
-
设置止盈止损点,退出仓位
通过双线碰口进入场内,并设置止盈止损,可以有效控制风险,实现稳定盈利。
优势
该策略具有以下优势:
-
规则清晰,易于实现。
-
利用布林带指标,具有一定的科学依据。
-
双线口开仓,可以有效过滤震荡市场的假突破。
-
包含止盈止损机制,可以控制风险。
-
回测数据充足,具有真实可靠性。
-
参数优化空间大,可调整至最佳状态。
风险
该策略也存在一些风险:
-
布林带指标对参数敏感,不同参数可能导致结果差异较大。
-
双线口打开仓位频率可能过低,容易错过交易机会。
-
止盈止损点设置不当,可能过早止损或获利不足。
-
行情趋势变化时,布林带系统可能会产生较大亏损。
-
回测时间窗口较短,可能存在过拟合风险。
对应解决方法:
-
对参数进行优化,找到最优参数组合。
-
适当缩小布林带宽度,增加开仓频率。
-
根据不同市场调整止盈止损点,保证最佳结果。
-
增加趋势过滤,避免逆势交易。
-
增加回测时间长度,确保系统稳健性。
优化方向
该策略可以从以下几个方向进行优化:
-
优化参数,改进入场系统。可以通过更全面的参数优化,找到最佳的参数组合。
-
增加趋势判断。加入趋势判断指标,避免逆势开仓。
-
优化止盈止损。可以通过动态止盈止损、移动止损等方式优化盈亏管理。
-
结合其他指标过滤。加入MACD、KDJ等指标判断时机,过滤假突破。
-
增加机器学习模型。使用LSTM等深度学习模型进一步优化策略。
-
组合其他策略类型。与其他基础策略或高级策略组合,实施资金管理。
总结
双线性BB口系统策略整体表现良好,具有科学的指标运用、清晰的交易规则、灵活的参数设定等优点。通过不断优化参数、止盈止损、趋势判断等方面,可以进一步提升系统稳定性。此外,与其他策略和模式组合使用,也可以强化策略效果,创造更大价值。
||
Overview
The Dual Moving Average Bollinger Band system strategy is a typical touch trading strategy. It utilizes the volatility indicator Bollinger Bands and dual-line touches to open positions, along with stop profit and stop loss mechanisms to manage funds and generate profits.
Principles
This strategy is mainly based on the Bollinger Bands indicator. Bollinger Bands consist of a moving average line and bandwidth. The strategy first calculates the moving average of closing prices over n periods as the middle band, with the bandwidth being m times the standard deviation of the middle band. The upper band and lower band are then plotted as m standard deviations above and below the middle band. When price touches the upper band, a short position is opened. When price touches the lower band, a long position is opened.
Specifically, the strategy implements the following steps:
-
Input parameters: set moving average length n and standard deviation multiplier m
-
Calculate middle band: n-period simple moving average of closing prices
-
Calculate upper band: middle band + m * n-period standard deviation of closing prices
-
Calculate lower band: middle band - m * n-period standard deviation of closing prices
-
Plot the middle, upper and lower bands
-
When closing price crosses above middle band, go long
-
When closing price crosses below middle band, go short
-
Set stop profit and stop loss points to exit positions
Entering positions on dual-line touches together with stop profit and stop loss mechanisms can effectively control risks and generate steady profits.
Advantages
The advantages of this strategy include:
-
Simple and clear rules, easy to implement.
-
Based on Bollinger Bands indicator with scientific rationale.
-
Dual-line touches filter false breakouts in ranging markets.
-
Contains stop profit and stop loss, managing risks.
-
Sufficient backtesting data ensures reliability.
-
Large parameter tuning space for optimization.
Risks
There are some risks to consider:
-
Bollinger Bands are sensitive to parameters which may lead to varied results.
-
Dual-line entry may miss trading opportunities due to low frequency.
-
Improper stop profit and stop loss settings may lead to premature stop loss or insufficient profits.
-
Large losses may occur when market trend changes.
-
Shorter backtesting timeframe may lead to overfitting risks.
Possible solutions:
-
Optimize parameters to find best combination.
-
Narrow bands to increase frequency.
-
Adjust stops based on different markets.
-
Add trend filter to avoid counter-trend trades.
-
Expand backtest timeframe to ensure robustness.
Improvements
Some ways to improve the strategy:
-
Optimize parameters for better entries. More comprehensive parameter tuning can find optimal parameter sets.
-
Add trend detection. Trend filters prevent trading against the trend.
-
Optimize exits. Dynamic or trailing stops can improve profit management.
-
Add filters with other indicators. MACD, KDJ etc. can help filter false breakouts.
-
Incorporate machine learning models like LSTM to further optimize.
-
Combine with other basic or advanced strategies for portfolio management.
Conclusion
The Dual Moving Average Bollinger Band system demonstrates overall positive results, with advantages like scientific indicators, clear rules, and flexible parameters. Further improvements to parameters, exits, and trend filters can enhance stability. Combining with other strategies and frameworks can also boost strategy performance and maximize value.
[/trans]
Strategy Arguments
| Argument | Default | Description |
|---|---|---|
| v_input_int_1 | 20 | length |
| v_input_1_close | 0 | Source: close |
| v_input_float_1 | 2 | StdDev |
| v_input_int_2 | false | Offset |
Source (PineScript)
/*backtest
start: 2023-09-17 00:00:00
end: 2023-10-17 00:00:00
period: 3h
basePeriod: 15m
exchanges: [{"eid":"Futures_Binance","currency":"BTC_USDT"}]
*/

//@version=5

strategy("BB돌파", overlay=true)
length = input.int(20, minval=1)
src = input(close, title="Source")
mult = input.float(2.0, minval=0.001, maxval=50, title="StdDev")
basis = ta.sma(src, length)
dev = mult * ta.stdev(src, length)
upper = basis + dev
lower = basis - dev
offset = input.int(0, "Offset", minval = -500, maxval = 500)
plot(basis, "Basis", color=#FF6D00, offset = offset)
p1 = plot(upper, "Upper", color=#2962FF, offset = offset)
p2 = plot(lower, "Lower", color=#2962FF, offset = offset)
fill(p1, p2, title = "Background", color=color.rgb(33, 150, 243, 95))


long = ta.crossover(close,basis)
short = ta.crossunder(close,basis)

strategy.entry("long", strategy.long, when =long)
strategy.entry("short", strategy.short, when =short)
Detail
https://www.fmz.com/strategy/429561
Last Modified
2023-10-18 11:01:19