
6.1 KiB
Name
双时间框架趋势跟踪策略Dual-Timeframe-Trend-Tracking-Strategy
Author
ChaoZhang
Strategy Description
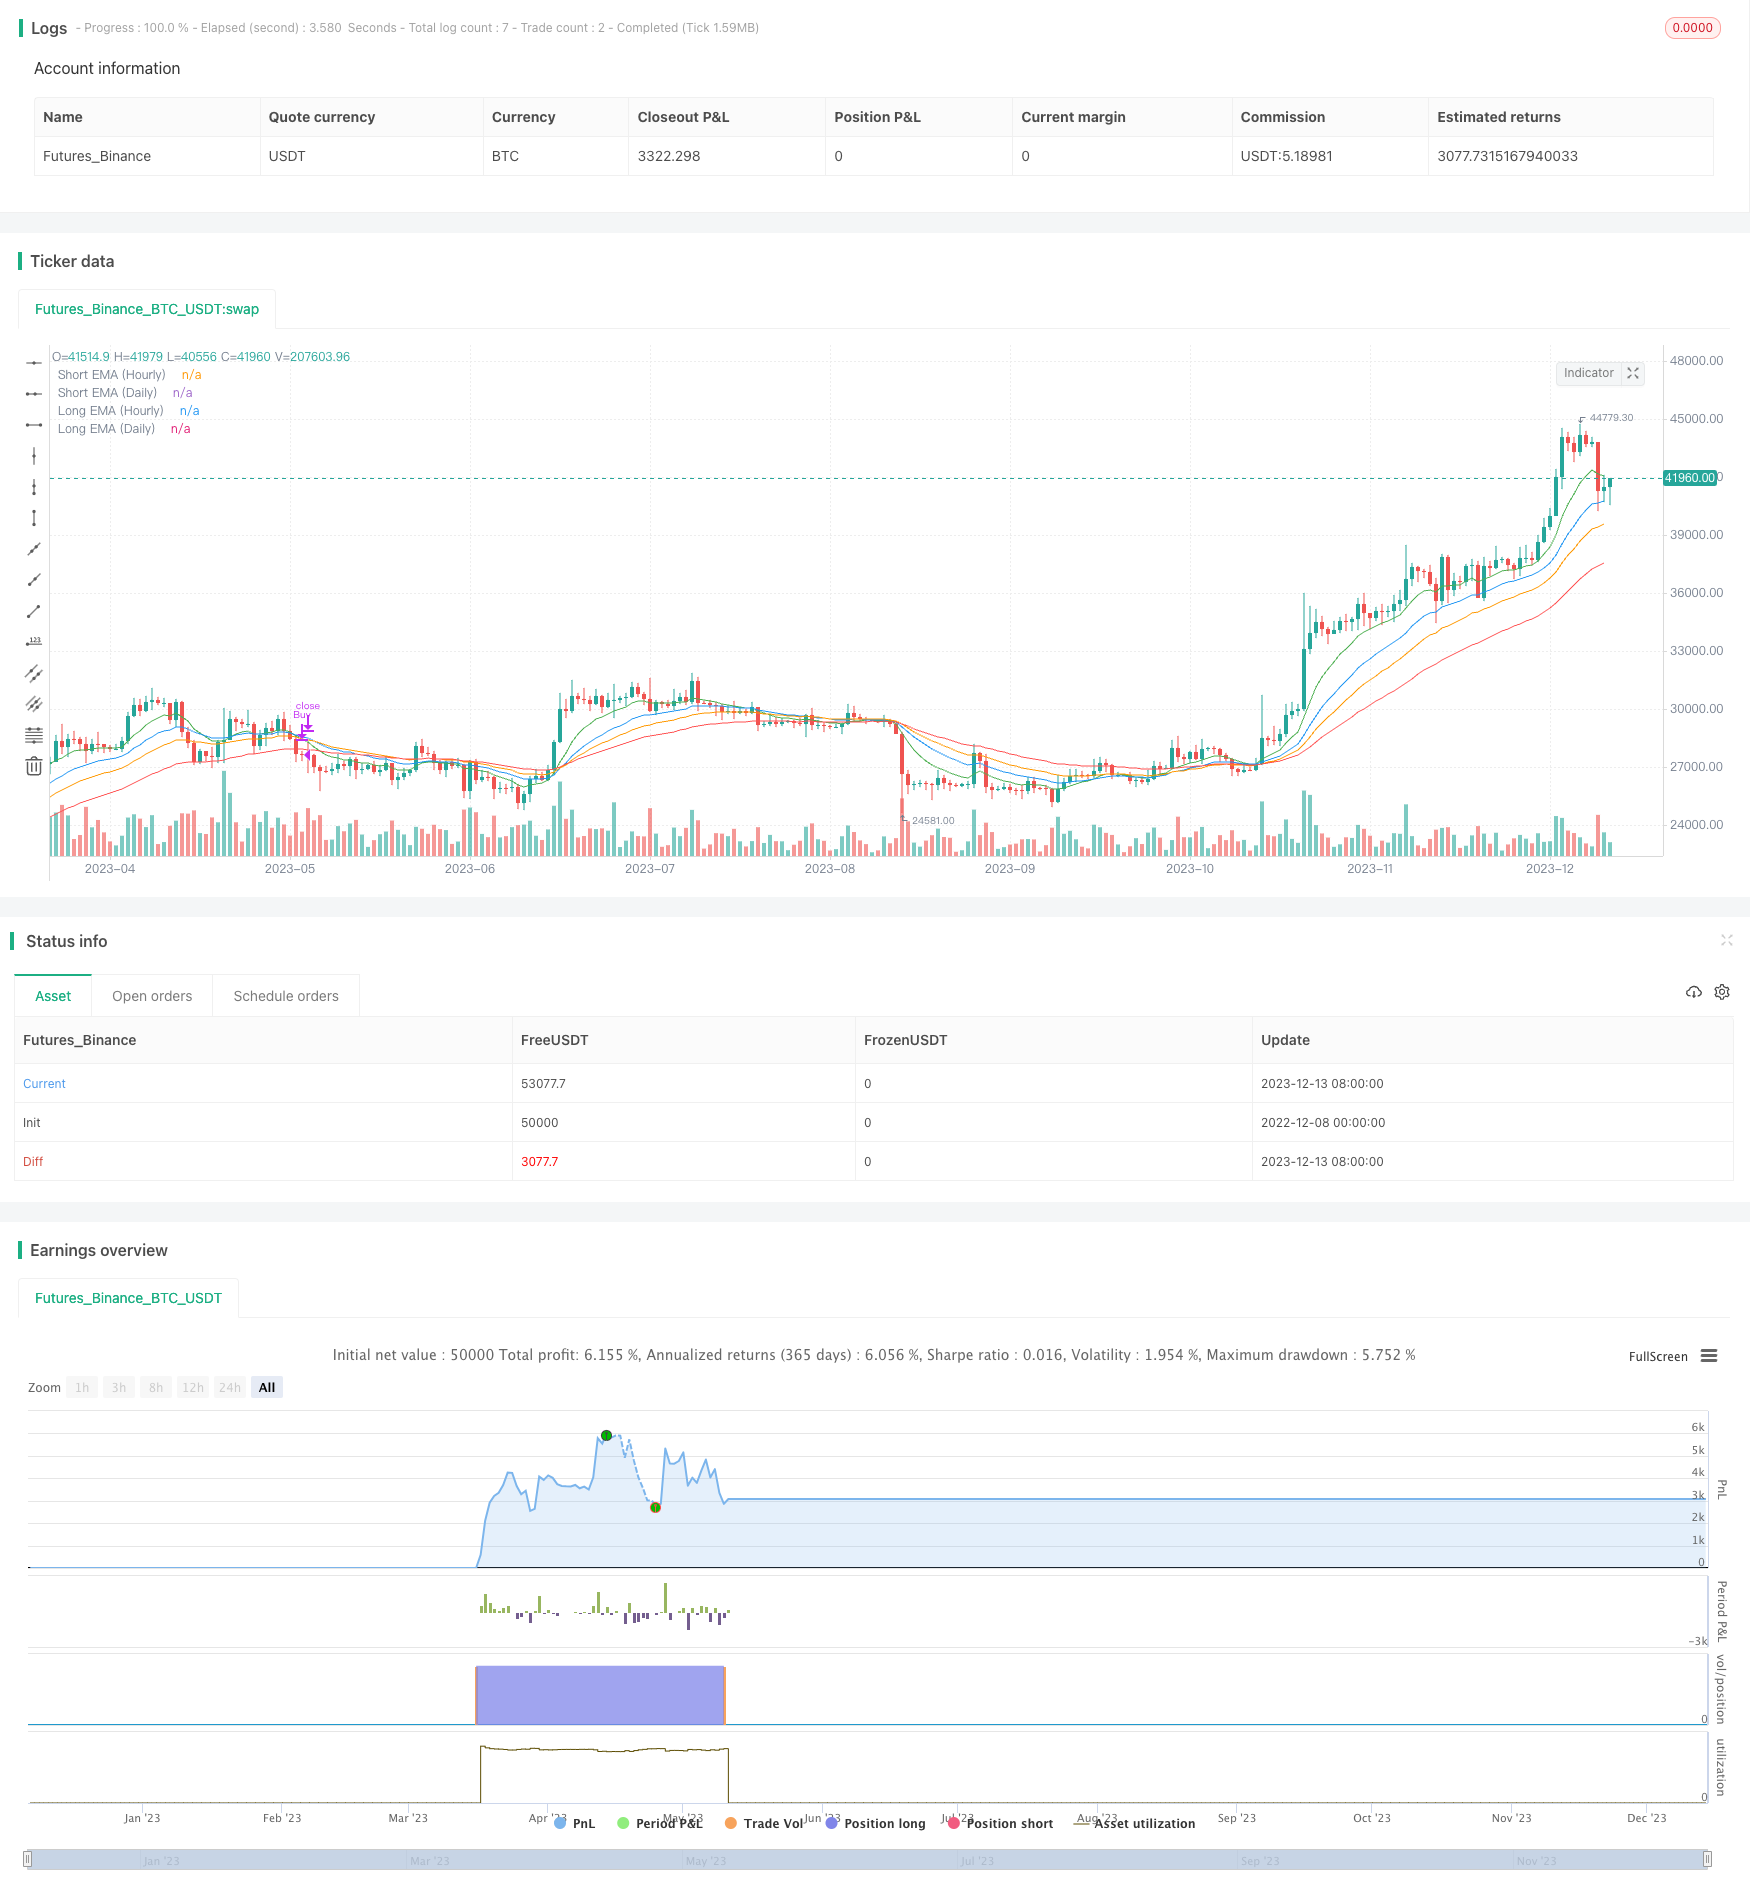
[trans]
概述
该策略使用双移动平均线在日线和小时线上进行配置,在日线判断大趋势方向,在小时线进行具体的入市出场。当日线表示上升趋势而小时线发生金叉时做多;当日线表示上升趋势而小时线发生死叉时平仓。这种配置使得我们在大趋势中捕捉中短线机会的同时规避了短期市场波动的影响。
策略原理
- 在日线图上计算快速EMA线和慢速EMA线
- 当快速EMA线上穿慢速EMA线时判断为上升趋势
- 在小时线图上也分别计算快慢EMA线
- 当小时线的快速EMA线上穿慢速EMA线时做多
- 当小时线的快速EMA线下穿慢速EMA线时平仓
优势分析
这种双时间框架配置的主要优势有:
- 能在大趋势中捕捉短期交易机会,增强盈利概率
- 使用双EMA过滤配置,避免被套利
- 只在趋势背景良好时开仓,有效控制风险
- 结合多时间轴判断,提高决策的准确性
风险分析
该策略主要的风险有:
- 大趋势判断出现错误时,止损风险较大
- 小时线出现剧烈波动时,会产生虚假信号
- 参数设置不当时,容易过度交易而招致套利
可以通过适当放宽止损幅度,优化参数组合,或增加过滤条件等方法来规避和减少这些风险。
优化方向
该策略还可以进一步优化:
- 在日线或小时线上增加量能指标等过滤,提高决策准确性
- 添加自适应止损机制,主动规避风险
- 优化移动平均线参数的组合,寻找最佳配置
- 在更高时间框架判断趋势,实现多时间轴嵌套
总结
本策略使用双时间框架分析,在大趋势判断的基础上,捕捉中短线机会。配置双EMA以滤除噪音。这种配置既保证了盈利的概率,也有效控制了风险。通过进一步优化,可以使策略更加稳健高效,值得recommendation。
||
Overview
This strategy uses double moving averages configured on the daily and hourly charts to determine the major trend direction on the daily chart and enter and exit trades on the hourly chart. It goes long when the daily chart indicates an upward trend and the hourly chart sees a golden cross, and closes the position when the daily chart shows an upward trend but the hourly chart sees a death cross. This configuration allows us to capture short-to-medium-term opportunities while avoiding the impacts of short-term market fluctuations.
Strategy Logic
- Calculate fast and slow EMA lines on the daily chart
- Determine an upward trend when the fast EMA line crosses above the slow EMA line
- Also calculate fast and slow EMA lines on the hourly chart
- Go long when the hourly fast EMA crosses above the slow EMA
- Close the position when the hourly fast EMA crosses below the slow EMA
Advantage Analysis
The main advantages of this dual timeframe configuration are:
- Captures short-term trading opportunities in line with major trends, improving profitability
- The double EMA filter avoids whipsaws
- Only trades when trend background is favorable, effectively controlling risk
- Combining multiple timeframes improves decision accuracy
Risk Analysis
Main risks of this strategy are:
- Incorrect major trend judgement leads to larger stop loss risk
- Volatile hourly price action can generate false signals
- Improper parameter tuning causes overtrading and whipsaws
These risks can be mitigated by widening stop loss levels, optimizing parameters, or adding filters.
Optimization Directions
This strategy can be further optimized by:
- Adding additional indicators like volume to improve signal accuracy
- Implementing adaptive stop loss mechanisms to actively manage risk
- Finding optimal moving average parameter combinations
- Judging trends across even higher timeframes for robustness
Conclusion
This strategy leverages a dual timeframe analysis to capture short-to-medium-term opportunities within major trends. The double EMA configuration filters out noise. This provides solid profitability while effectively managing risk. Further optimizations can make the strategy more robust and efficient for wider application.
[/trans]
Strategy Arguments
| Argument | Default | Description |
|---|---|---|
| v_input_int_1 | 20 | Short EMA Length (Daily) |
| v_input_int_2 | 50 | Long EMA Length (Daily) |
| v_input_int_3 | 10 | Short EMA Length (Hourly) |
| v_input_int_4 | 30 | Long EMA Length (Hourly) |
Source (PineScript)
/*backtest
start: 2022-12-08 00:00:00
end: 2023-12-14 00:00:00
period: 1d
basePeriod: 1h
exchanges: [{"eid":"Futures_Binance","currency":"BTC_USDT"}]
*/

//@version=5
strategy("Dual Time Frame Strategy", overlay=true)

// Define Daily Time Frame Inputs
lenShort = input.int(20, title="Short EMA Length (Daily)", minval=1)
lenLong = input.int(50, title="Long EMA Length (Daily)", minval=1)

// Calculate EMAs on Daily Time Frame
emaShort_D = ta.ema(close, lenShort)
emaLong_D = ta.ema(close, lenLong)

// Define Hourly Time Frame Inputs
lenShort_H = input.int(10, title="Short EMA Length (Hourly)", minval=1)
lenLong_H = input.int(30, title="Long EMA Length (Hourly)", minval=1)

// Calculate EMAs on Hourly Time Frame
emaShort_H = ta.ema(close, lenShort_H)
emaLong_H = ta.ema(close, lenLong_H)

// Daily Time Frame Condition
dailyUpTrend = emaShort_D > emaLong_D

// Hourly Time Frame Condition
hourlyBuy = ta.crossover(emaShort_H, emaLong_H)
hourlySell = ta.crossunder(emaShort_H, emaLong_H)

// Strategy Entry and Exit Conditions
if (dailyUpTrend and hourlyBuy)
    strategy.entry("Buy", strategy.long)

if (dailyUpTrend and hourlySell)
    strategy.close("Buy")

// Plot EMAs for Daily and Hourly Time Frames
plot(emaShort_D, color=color.blue, title="Short EMA (Daily)")
plot(emaLong_D, color=color.red, title="Long EMA (Daily)")

plot(emaShort_H, color=color.green, title="Short EMA (Hourly)")
plot(emaLong_H, color=color.orange, title="Long EMA (Hourly)")
Detail
https://www.fmz.com/strategy/435492
Last Modified
2023-12-15 13:46:47