
10 KiB
Name
双均线反转突破策略Dual-Moving-Average-Reversal-Breakout-Strategy
Author
ChaoZhang
Strategy Description
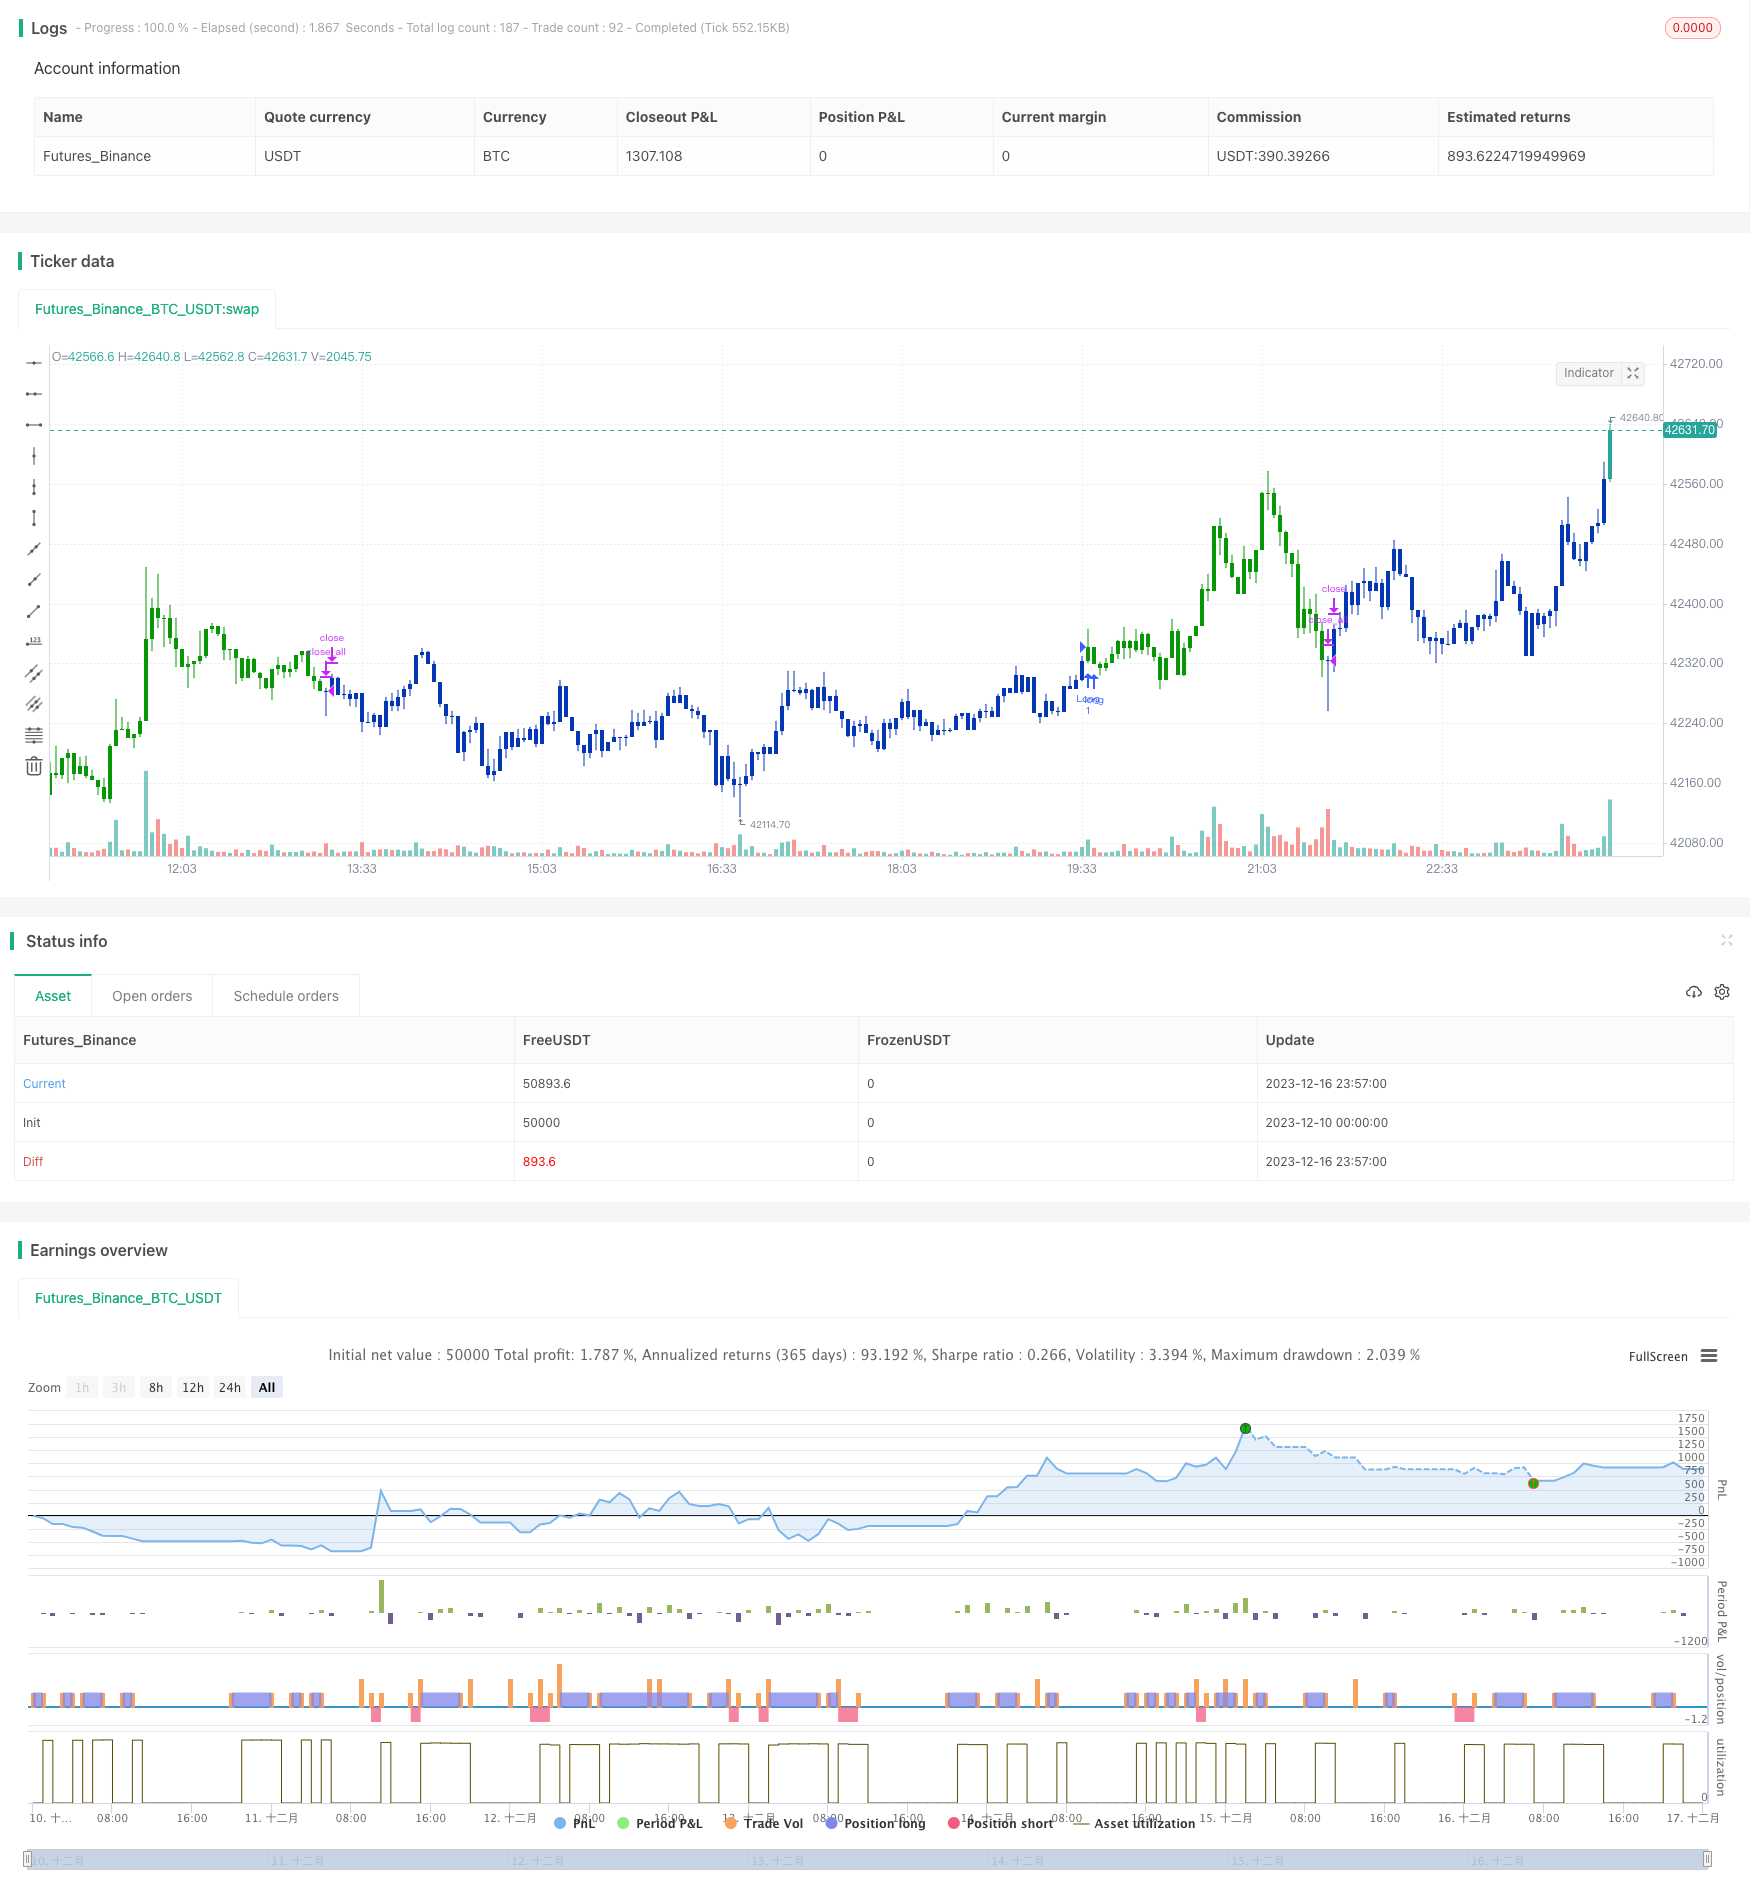 [trans]
概述
双均线反转突破策略是一种组合策略,它结合了123反转策略和价格与均线差距策略这两种策略。该策略的主要思想是在123反转形成信号的同时,价格与指定周期的均线差距也形成一一对应的信号时,才生成交易信号。
策略原理
双均线反转突破策略由两部分组成:
-
123反转策略
123反转策略的交易信号是:连续两天收盘价反转(即前一天收盘价较高,第二天收盘较低;或前一天收盘较低,第二天收盘较高),同时9日随机指标K线位于某一水平之下(默认为50),这样就形成买入信号;连续两天收盘价反转,同时9日随机指标K线高于某一水平(默认为50),这样就形成卖出信号。
-
价格与均线差距策略
价格与均线差距策略,是计算价格与指定周期均线(默认14日)的差距百分比。当差距小于某一水平(默认3%)时产生买入信号,当差距大于某一水平(默认0.54%)时产生卖出信号。
双均线反转突破策略,只有当上述两个策略的交易信号同向时,即都为买入或都为卖出时,本策略才产生实际的交易信号。
优势分析
双均线反转突破策略结合了反转策略和趋势策略的优点,可谓取长补短。
123反转策略作为反转策略,可在价格反转时捕捉反转机会。而价格与均线差距策略作为趋势跟踪策略,能把握较长线上的趋势。两者结合,既可及时捕捉短期价格反转,又可把握长期趋势,避免被套。
此外,通过要求两种策略信号同向,可有效减少无效交易次数,提高信噪比。
风险分析
双均线反转突破策略虽然综合运用了两种策略的优势,但也承袭了两种策略各自的风险。
对于123反转部分,连续两日反转并不能完全确保价格反转,可能是短期回调行情造成的假反转。此外,随机指标参数设置不当也可能导致信号质量下降。
对于价格与均线差距部分,均线参数设置不当可能导致信号滞后。此外,价格与均线差距无法判断趋势方向,只能机械生成信号。
综上所述,该策略的主要风险在于参数设置不当和判断失误。可通过优化参数,设定止损止盈,或人工干预交易来规避风险。
优化方向
双均线反转突破策略可从以下几个方面进行优化:
- 优化均线和随机指标参数,提高信号质量
- 加入其他指标过滤,确保交易信号更可靠
- 增加止损止盈设置
- 增加趋势判断模块,避免不合适的交易
- 人工干预和参数自适应
通过多种手段的结合,可望进一步提升策略的稳定性和盈利水平。
总结
双均线反转突破策略综合运用反转策略和趋势策略的优势,在两种策略信号同向时产生实际交易信号。它既可捕捉短期价格反转机会,又可跟踪长期趋势,避免被套。同时通过组合双重信号可提高信号的可靠性。该策略可通过多种手段进行优化升级,是一种功能强大、应用广泛的量化交易策略。
||
Overview
The Dual Moving Average Reversal Breakout Strategy is a combination strategy that incorporates both the 123 Reversal Strategy and the Price & Moving Average Divergence Strategy. The key idea of this strategy is to generate trading signals only when the 123 Reversal signals align with the price & MA divergence signals.
Strategy Logic
The Dual Moving Average Reversal Breakout Strategy consists of two components:
-
123 Reversal Strategy
The 123 Reversal Strategy generates trading signals based on two consecutive days of close price reversal (i.e. higher close followed by lower close; or lower close followed by higher close), combined with the 9-day Stochastic Oscillator K-line being below/above a certain level (default 50). Buy signals are generated when K-line is below 50 and sell signals are generated when K-line is above 50.
-
Price & Moving Average Divergence Strategy
The Price & MA Divergence Strategy calculates the percentage difference between price and a moving average of certain period (default 14). It generates buy signals when the divergence is below a threshold (default 3%) and sell signals when the divergence is above a threshold (default 0.54%).
The Dual Moving Average Reversal Breakout Strategy only generates actual trading signals when the signals from both strategies above align in the same direction, i.e. both are buy or both are sell signals.
Advantage Analysis
The Dual Moving Average Reversal Breakout Strategy combines the strengths of reversal and trend-following strategies for synergy.
The 123 Reversal picks reversals signals to capitalize on turnarounds. The Price & MA Divergence tracks the longer term trend. Together they capture short-term reversals while riding the bigger trend to avoid being trapped.
Moreover, by requiring aligned signals from both strategies, the number of invalid trades can be reduced significantly, improving signal-to-noise ratio.
Risk Analysis
While harnessing the strengths of both strategies, the Dual Moving Average Reversal Breakout Strategy also inherits the risks associated with each one.
For the 123 Reversal component, two consecutive daily reversals do not guarantee a real trend reversal. They could well be false signals caused by short-term pullbacks. Also, poor parameter tuning of the Stochastic Oscillator may degrade signal quality.
For the Price & MA Divergence part, inappropriate moving average parameters can lead to lagging signals. Also, the divergence itself does not indicate trend direction, only generating mechanical signals.
In summary, the major risks of this strategy come from poor parameter tuning and faulty signal generation. Risks can be mitigated via parameter optimization, stop loss/take profit, manual intervention etc.
Enhancement Opportunities
The Dual Moving Average Reversal Breakout Strategy can be enhanced in the following aspects:
- Optimize MA and oscillator parameters for better signals
- Add other indicators for signal filtering
- Incorporate stop loss and take profit
- Add trend determination to avoid untimely trades
- Manual intervention and adaptive parameter tuning
With a combination of different enhancement methods, strategy stability and profitability can be further improved.
Conclusion
The Dual Moving Average Reversal Breakout Strategy combines the strengths of reversal and trend-following strategies, generating trades only when both signal types align. It captures short-term reversal opportunities while riding bigger trends to avoid traps. The dual-signal mechanism also improves reliability. With abundant enhancement opportunities, it is a versatile and powerful quantified trading strategy.
[/trans]
Strategy Arguments
| Argument | Default | Description |
|---|---|---|
| v_input_1 | true | ---- 123 Reversal ---- |
| v_input_2 | 14 | Length |
| v_input_3 | true | KSmoothing |
| v_input_4 | 3 | DLength |
| v_input_5 | 50 | Level |
| v_input_6 | true | ---- Difference between price and MA ---- |
| v_input_7 | 14 | LengthDBP |
| v_input_8 | 0.54 | SellZone |
| v_input_9 | 0.03 | BuyZone |
| v_input_10 | false | Trade reverse |
Source (PineScript)
/*backtest
start: 2023-12-10 00:00:00
end: 2023-12-17 00:00:00
period: 3m
basePeriod: 1m
exchanges: [{"eid":"Futures_Binance","currency":"BTC_USDT"}]
*/

//@version=4
////////////////////////////////////////////////////////////
//  Copyright by HPotter v1.0 13/04/2021
// This is combo strategies for get a cumulative signal.
//
// First strategy
// This System was created from the Book "How I Tripled My Money In The
// Futures Market" by Ulf Jensen, Page 183. This is reverse type of strategies.
// The strategy buys at market, if close price is higher than the previous close
// during 2 days and the meaning of 9-days Stochastic Slow Oscillator is lower than 50.
// The strategy sells at market, if close price is lower than the previous close price
// during 2 days and the meaning of 9-days Stochastic Fast Oscillator is higher than 50.
//
// Second strategy
// Percent difference between price and MA
//
// WARNING:
// - For purpose educate only
// - This script to change bars colors.
////////////////////////////////////////////////////////////
Reversal123(Length, KSmoothing, DLength, Level) =>
    vFast = sma(stoch(close, high, low, Length), KSmoothing)
    vSlow = sma(vFast, DLength)
    pos = 0.0
    pos := iff(close[2] < close[1] and close > close[1] and vFast < vSlow and vFast > Level, 1,
	         iff(close[2] > close[1] and close < close[1] and vFast > vSlow and vFast < Level, -1, nz(pos[1], 0)))
	pos


DBP_MA(Length,SellZone,BuyZone) =>
    pos = 0.0
    xSMA = sma(close, Length)
    nRes = abs(close - xSMA) * 100 / close
    pos:= iff(nRes < BuyZone, 1,
           iff(nRes > SellZone, -1, nz(pos[1], 0)))
    pos

strategy(title="Combo Backtest 123 Difference between price and MA", shorttitle="Combo", overlay = true)
line1 = input(true, "---- 123 Reversal ----")
Length = input(14, minval=1)
KSmoothing = input(1, minval=1)
DLength = input(3, minval=1)
Level = input(50, minval=1)
//-------------------------
line2 = input(true, "---- Difference between price and MA ----")
LengthDBP = input(14, minval=1)
SellZone = input(0.54, minval=0.01, step = 0.01)
BuyZone = input(0.03, minval=0.01, step = 0.01)
reverse = input(false, title="Trade reverse")
posReversal123 = Reversal123(Length, KSmoothing, DLength, Level)
posDBP_MA = DBP_MA(LengthDBP,SellZone,BuyZone)
pos = iff(posReversal123 == 1 and posDBP_MA == 1 , 1,
	   iff(posReversal123 == -1 and posDBP_MA == -1, -1, 0))
possig = iff(reverse and pos == 1, -1,
          iff(reverse and pos == -1 , 1, pos))
if (possig == 1 )
    strategy.entry("Long", strategy.long)
if (possig == -1 )
    strategy.entry("Short", strategy.short)
if (possig == 0)
    strategy.close_all()
barcolor(possig == -1 ? #b50404: possig == 1 ? #079605 : #0536b3 )
Detail
https://www.fmz.com/strategy/435701
Last Modified
2023-12-18 10:24:08