
15 KiB
Name
动量震荡交易策略Dynamic-Momentum-Oscillator-Trading-Strategy
Author
ChaoZhang
Strategy Description
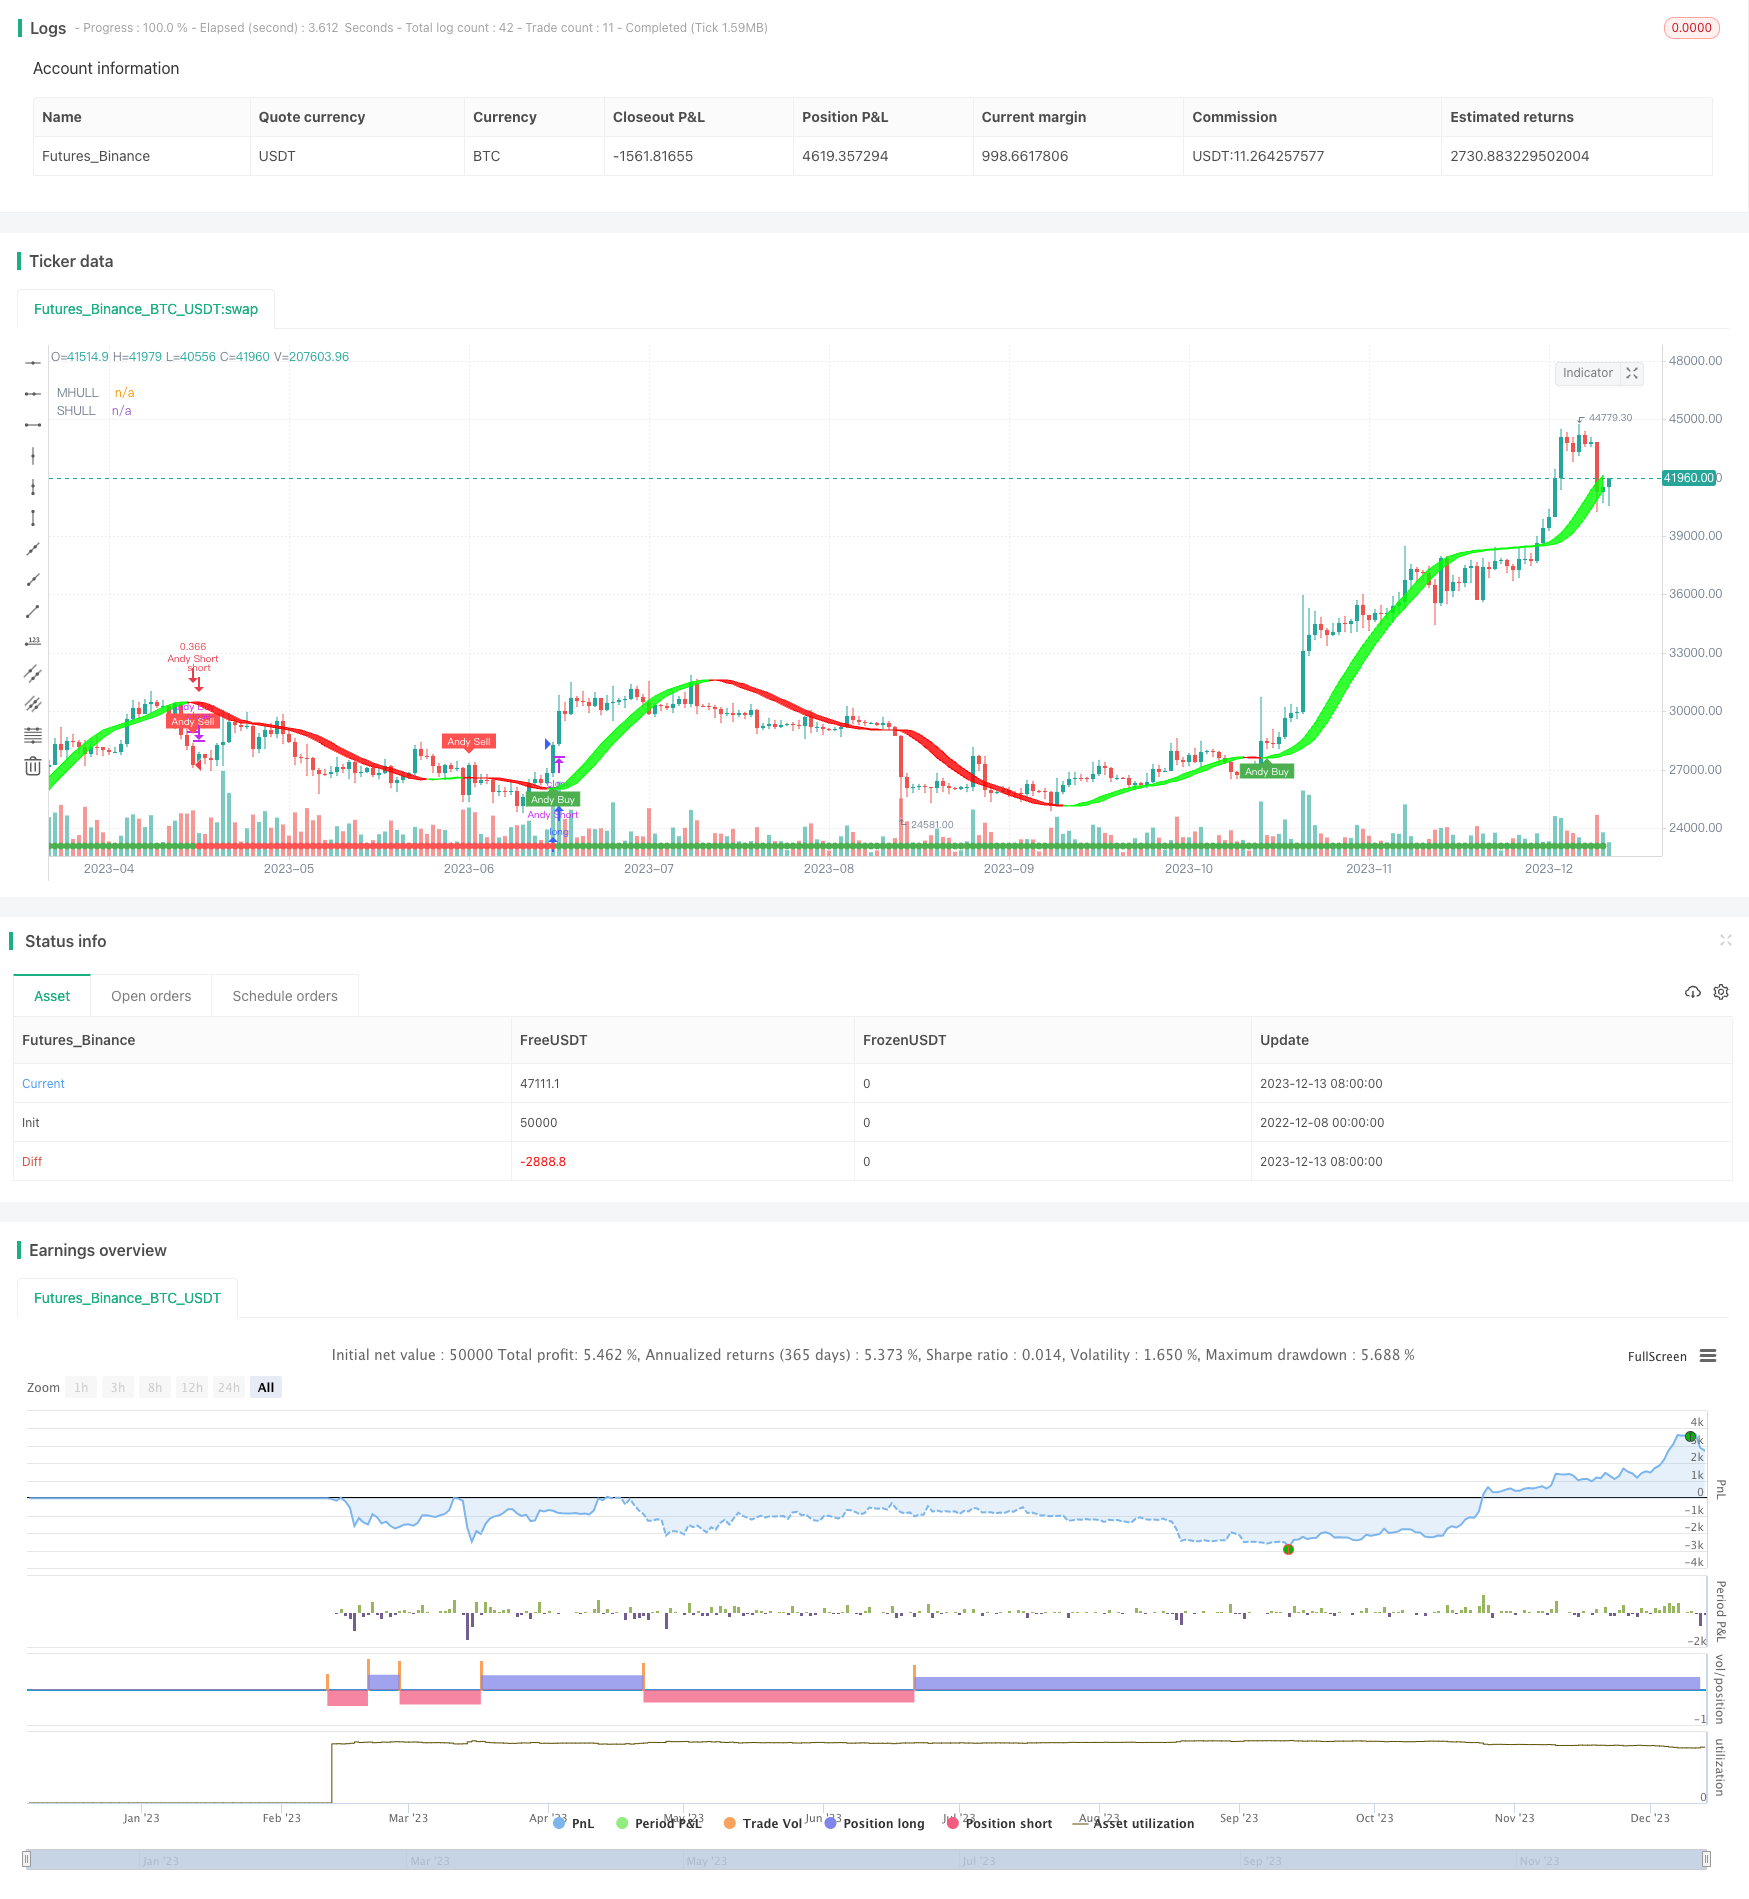 [trans]
概述
Dynamic Momentum Oscillator Trading Strategy(DMO策略)是一个基于动量震荡指标的15分钟短线交易策略。该策略结合多种技术指标实现高精确度的交易信号,可有效辅助新手交易者在短时间内进行买卖决策,控制风险,提高盈利概率。
策略原理
该策略首先使用Doinchian通道判断市场主要趋势方向。当价格突破该通道上沿时为看涨信号,若突破下沿则为看跌信号。其次,策略采用3种Hull移动平均线变体中的一种,结合自适应ATR通道实现更精确的趋势判断。当快线上穿中线时为买入信号,下穿中线则为卖出信号。最后,结合半整平均指标的辅助,过滤掉部分假信号,提高信号的可靠性。在获悉较为可靠的交易信号后,策略即进入对应的多空头仓位。
优势分析
DMO策略最大的优势在于多种指标的有机结合,不同指标可相互验证,从而过滤假信号,使每次交易信号更加精确可靠。此外,Doinchian通道判断主趋势的方式简单直接,半整平均线过滤信号的手段也较为常规,整体而言易于理解,新手上手难度不大。相比单一指标,DMO可在同等交易次数下获得更高胜率和盈利率。
风险分析
尽管DMO策略较为稳定可靠,但任何量化交易策略都难免存在一定风险。具体来说,快线与中线产生死叉时,如果没有其他指标验证,依然有可能是假信号。此外,像所有短线策略一样,DMO也面临一定的过度交易风险。如果遇到市场突发事件导致指标失效,停损幅度设定不当也会造成较大损失。为降低风险,建议适当调整中长期指标参数,并与更高时间周期指标进行组合验证,同时加大停损距离,严格控制单笔损失。
优化方向
DMO策略可从以下几个维度进行优化:第一,调整Hull MA的参数,优化移动平均线的长度,平滑效果与灵敏度之间的平衡;第二,改进Doinchian通道判断逻辑,如调整通道参数,或增加附加条件限制入场;第三,尝试其他指标代替半整平均,如布林带、KDJ等,提高辅助过滤效果;第四,根据不同品种特点指定合适的交易区间,如改为5分钟或30分钟策略。这些优化举措有助于根据市场环境和品种特征量身定制DMO策略,提升策略稳定性。
总结
DMO是一套多指标优化组合的短线策略。它融合Doinchian通道、Hull MA以及半整平均线,有效判断市场趋势,产生精确的交易信号。策略手段相对简单直观,操作难度不大,可作为新手的入门策略。与单一指标相比,DMO可产生更高的交易胜率和盈利率。通过调参数、改进组合及指定交易区间等措施,DMO策略可望获得更长期更稳定的优异表现。
||
Overview
The Dynamic Momentum Oscillator (DMO) Trading Strategy is a 15-minute short-term trading strategy based on momentum oscillator indicators. This strategy combines multiple technical indicators to generate highly accurate trading signals, which can effectively assist novice traders in making buy and sell decisions within a short period of time, control risks, and increase profitability.
Strategy Logic
This strategy first uses the Doinchian Channel to determine the main trend direction of the market. A breakout above the upper band of the channel is a bullish signal, while a breakout below the lower band is a bearish signal. Secondly, the strategy adopts one of the three Hull Moving Average variants in combination with an adaptive ATR channel for more precise trend judgment. When the fast line crosses above the middle line, it is a buy signal, and when it crosses below, it is a sell signal. Finally, with the aid of the Halftrend indicator for additional filtration of false signals, the reliability of the trading signals can be further improved. Upon receipt of relatively reliable trading signals, the strategy will then enter corresponding long or short positions.
Advantage Analysis
The biggest advantage of the DMO strategy lies in the organic combination of multiple indicators. Different indicators can verify each other to filter out false signals, making each trading signal more accurate and reliable. In addition, the Doinchian channel's way of judging the main trend is simple and straightforward, and the means of filtering signals with the Halftrend line is also relatively conventional. Overall it is easy to understand with a low learning curve for beginners. Compared with single indicators, DMO can achieve higher win rates and profitability given the same number of trades.
Risk Analysis
Although the DMO strategy is relatively stable and reliable, any quantitative trading strategy is bound to carry certain risks. Specifically, when the fast line crosses below the middle line, it may still be a false signal without verification from other indicators. In addition, like all short-term strategies, DMO also faces risks associated with overtrading. If sudden market events occur that render indicators ineffective, improper stop loss settings can also lead to greater losses. To mitigate risks, it is advisable to appropriately adjust the parameters of medium and long term indicators, combine them with higher timeframe indicators for verification, and increase the stop loss distance to strictly control single trade losses.
Optimization Directions
The DMO strategy can be optimized in the following aspects: first, adjust the parameters of the Hull MA to balance the smoothing effect and sensitivity of the moving averages; second, improve the Doinchian channel logic, such as adjusting channel parameters or adding additional restrictions; third, try other indicators to replace the Halftrend for better filtration, such as Bollinger Bands, KDJ, etc.; fourth, specify appropriate trading intervals based on the characteristics of different trading instruments, for example changing it to a 5-minute or 30-minute strategy. These optimization measures can help customize the DMO strategy according to market conditions and instrument characteristics to enhance stability.
Conclusion
DMO is a short-term strategy that optimizes the combination of multiple indicators. It integrates Doinchian Channel, Hull MA and Halftrend to effectively determine market trends and generate precise trading signals. With relatively simple and intuitive techniques and easy operation, it can serve as an introductory strategy for beginners. Compared to single indicators, DMO can achieve higher win rates and profitability. Through measures like parameter tuning, combination improvements and interval specification, the DMO strategy has the potential to achieve longer-term superior performance with enhanced stability.
[/trans]
Strategy Arguments
| Argument | Default | Description |
|---|---|---|
| v_input_int_1 | 30 | dlen |
| v_input_1_hlc3 | 0 | Source: hlc3 |
| v_input_string_1 | 0 | Hull Variation: Hma |
| v_input_2 | 55 | Length |
| v_input_3 | true | Length multiplier |
| v_input_4 | 2 | Amplitude |
| v_input_5 | 2 | Channel Deviation |
| v_input_int_2 | 7 | atr_length |
| v_input_int_3 | 50 | atr_rsi_length |
Source (PineScript)
/*backtest
start: 2022-12-08 00:00:00
end: 2023-12-14 00:00:00
period: 1d
basePeriod: 1h
exchanges: [{"eid":"Futures_Binance","currency":"BTC_USDT"}]
*/

// This source code is subject to the terms of the Mozilla Public License 2.0 at https://mozilla.org/MPL/2.0/
// © kgynofomo

//@version=5
strategy(title="[Salavi] | Andy Super Pro Strategy [BTC|M15]",overlay = true, pyramiding = 1,initial_capital = 10000, default_qty_type = strategy.cash,default_qty_value = 10000)

//Doinchian Trend Ribbon
dlen = input.int(defval=30, minval=10)

dchannel(len) =>
    float hh = ta.highest(len)
    float ll = ta.lowest(len)

    int trend = 0
    trend := close > hh[1] ? 1 : close < ll[1] ? -1 : nz(trend[1])
    trend

dchannelalt(len, maintrend) =>
    float hh = ta.highest(len)
    float ll = ta.lowest(len)

    int trend = 0
    trend := close > hh[1] ? 1 : close < ll[1] ? -1 : nz(trend[1])
    maintrend == 1 ? trend == 1 ? #00FF00ff : #00FF009f : maintrend == -1 ? trend == -1 ? #FF0000ff : #FF00009f : na

maintrend = dchannel(dlen)
donchian_bull = maintrend==1
donchian_bear = maintrend==-1


//Hulls
src = input(hlc3, title='Source')
modeSwitch = input.string('Hma', title='Hull Variation', options=['Hma', 'Thma', 'Ehma'])
length = input(55, title='Length')
lengthMult = input(1.0, title='Length multiplier ')

useHtf = false
htf = '240'

switchColor = true
candleCol = false
visualSwitch = true
thicknesSwitch = 1
transpSwitch = 40

//FUNCTIONS
//HMA
HMA(_src, _length) =>
    ta.wma(2 * ta.wma(_src, _length / 2) - ta.wma(_src, _length), math.round(math.sqrt(_length)))
//EHMA
EHMA(_src, _length) =>
    ta.ema(2 * ta.ema(_src, _length / 2) - ta.ema(_src, _length), math.round(math.sqrt(_length)))
//THMA
THMA(_src, _length) =>
    ta.wma(ta.wma(_src, _length / 3) * 3 - ta.wma(_src, _length / 2) - ta.wma(_src, _length), _length)

//SWITCH
Mode(modeSwitch, src, len) =>
    modeSwitch == 'Hma' ? HMA(src, len) : modeSwitch == 'Ehma' ? EHMA(src, len) : modeSwitch == 'Thma' ? THMA(src, len / 2) : na

//OUT
_hull = Mode(modeSwitch, src, int(length * lengthMult))
HULL = useHtf ? request.security(syminfo.ticker, htf, _hull) : _hull
MHULL = HULL[0]
SHULL = HULL[2]

//COLOR
hullColor = switchColor ? HULL > HULL[2] ? #00ff00 : #ff0000 : #ff9800
hull_bull = HULL > HULL[2]
bull_start = hull_bull and hull_bull[1]==false
hull_bear = HULL < HULL[2]
bear_start = hull_bear and hull_bear[1]==false

barcolor(color=candleCol ? switchColor ? hullColor : na : na)

//halftrend
amplitude = input(title='Amplitude', defval=2)
channelDeviation = input(title='Channel Deviation', defval=2)
// showArrows = input(title='Show Arrows', defval=true)
// showChannels = input(title='Show Channels', defval=true)

var int trend = 0
var int nextTrend = 0
var float maxLowPrice = nz(low[1], low)
var float minHighPrice = nz(high[1], high)

var float up = 0.0
var float down = 0.0
float atrHigh = 0.0
float atrLow = 0.0
float arrowUp = na
float arrowDown = na

atr2 = ta.atr(100) / 2
dev = channelDeviation * atr2

highPrice = high[math.abs(ta.highestbars(amplitude))]
lowPrice = low[math.abs(ta.lowestbars(amplitude))]
highma = ta.sma(high, amplitude)
lowma = ta.sma(low, amplitude)

if nextTrend == 1
    maxLowPrice := math.max(lowPrice, maxLowPrice)

    if highma < maxLowPrice and close < nz(low[1], low)
        trend := 1
        nextTrend := 0
        minHighPrice := highPrice
        minHighPrice
else
    minHighPrice := math.min(highPrice, minHighPrice)

    if lowma > minHighPrice and close > nz(high[1], high)
        trend := 0
        nextTrend := 1
        maxLowPrice := lowPrice
        maxLowPrice

if trend == 0
    if not na(trend[1]) and trend[1] != 0
        up := na(down[1]) ? down : down[1]
        arrowUp := up - atr2
        arrowUp
    else
        up := na(up[1]) ? maxLowPrice : math.max(maxLowPrice, up[1])
        up
    atrHigh := up + dev
    atrLow := up - dev
    atrLow
else
    if not na(trend[1]) and trend[1] != 1
        down := na(up[1]) ? up : up[1]
        arrowDown := down + atr2
        arrowDown
    else
        down := na(down[1]) ? minHighPrice : math.min(minHighPrice, down[1])
        down
    atrHigh := down + dev
    atrLow := down - dev
    atrLow

ht = trend == 0 ? up : down

var color buyColor = color.blue
var color sellColor = color.red

htColor = trend == 0 ? buyColor : sellColor
// htPlot = plot(ht, title='HalfTrend', linewidth=2, color=htColor)

// atrHighPlot = plot(showChannels ? atrHigh : na, title='ATR High', style=plot.style_circles, color=color.new(sellColor, 0))
// atrLowPlot = plot(showChannels ? atrLow : na, title='ATR Low', style=plot.style_circles, color=color.new(buyColor, 0))

// fill(htPlot, atrHighPlot, title='ATR High Ribbon', color=color.new(sellColor, 90))
// fill(htPlot, atrLowPlot, title='ATR Low Ribbon', color=color.new(buyColor, 90))

HalfTrend_buySignal = not na(arrowUp) and trend == 0 and trend[1] == 1
HalfTrend_sellSignal = not na(arrowDown) and trend == 1 and trend[1] == 0

// plotshape(showArrows and buySignal ? atrLow : na, title='Arrow Up', style=shape.triangleup, location=location.absolute, size=size.tiny, color=color.new(buyColor, 0))
// plotshape(showArrows and sellSignal ? atrHigh : na, title='Arrow Down', style=shape.triangledown, location=location.absolute, size=size.tiny, color=color.new(sellColor, 0))


//ema
filter_ema = ta.ema(close,200)
ema_bull = close>filter_ema
ema_bear = close<filter_ema

atr_length = input.int(7)
atr = ta.atr(atr_length)
atr_rsi_length = input.int(50)
atr_rsi = ta.rsi(atr,atr_rsi_length)
atr_valid = atr_rsi>50

longCondition = bull_start and atr_valid
shortCondition = bear_start and atr_valid

Exit_long_condition = shortCondition
Exit_short_condition = longCondition

if longCondition
    strategy.entry("Andy Buy",strategy.long, limit=close,comment="Andy Buy Here")

if Exit_long_condition
    strategy.close("Andy Buy",comment="Andy Buy Out")
    // strategy.entry("Andy fandan Short",strategy.short, limit=close,comment="Andy 翻單 short Here")
    // strategy.close("Andy fandan Buy",comment="Andy short Out")


if shortCondition
    strategy.entry("Andy Short",strategy.short, limit=close,comment="Andy short Here")


// strategy.exit("STR","Long",stop=longstoploss)
if Exit_short_condition
    strategy.close("Andy Short",comment="Andy short Out")
    // strategy.entry("Andy fandan Buy",strategy.long, limit=close,comment="Andy 翻單 Buy Here")
    // strategy.close("Andy fandan Short",comment="Andy Buy Out")


inLongTrade = strategy.position_size > 0
inLongTradecolor = #58D68D
notInTrade = strategy.position_size == 0
inShortTrade = strategy.position_size < 0

// bgcolor(color = inLongTrade?color.rgb(76, 175, 79, 70):inShortTrade?color.rgb(255, 82, 82, 70):na)
plotshape(close!=0,location = location.bottom,color = inLongTrade?color.green:inShortTrade?color.red:na)


plotshape(longCondition, title='Buy', text='Andy Buy', style=shape.labelup, location=location.belowbar, color=color.new(color.green, 0), textcolor=color.new(color.white, 0), size=size.tiny)
plotshape(shortCondition, title='Sell', text='Andy Sell', style=shape.labeldown, location=location.abovebar, color=color.new(color.red, 0), textcolor=color.new(color.white, 0), size=size.tiny)

Fi1 = plot(MHULL, title='MHULL', color=hullColor, linewidth=thicknesSwitch, transp=50)
Fi2 = plot(SHULL, title='SHULL', color=hullColor, linewidth=thicknesSwitch, transp=50)

fill(Fi1, Fi2, title='Band Filler', color=hullColor, transp=transpSwitch)
Detail
https://www.fmz.com/strategy/435470
Last Modified
2023-12-15 11:00:25