
8.4 KiB
Name
动量追踪策略Momentum-Tracking-Strategy
Author
ChaoZhang
Strategy Description
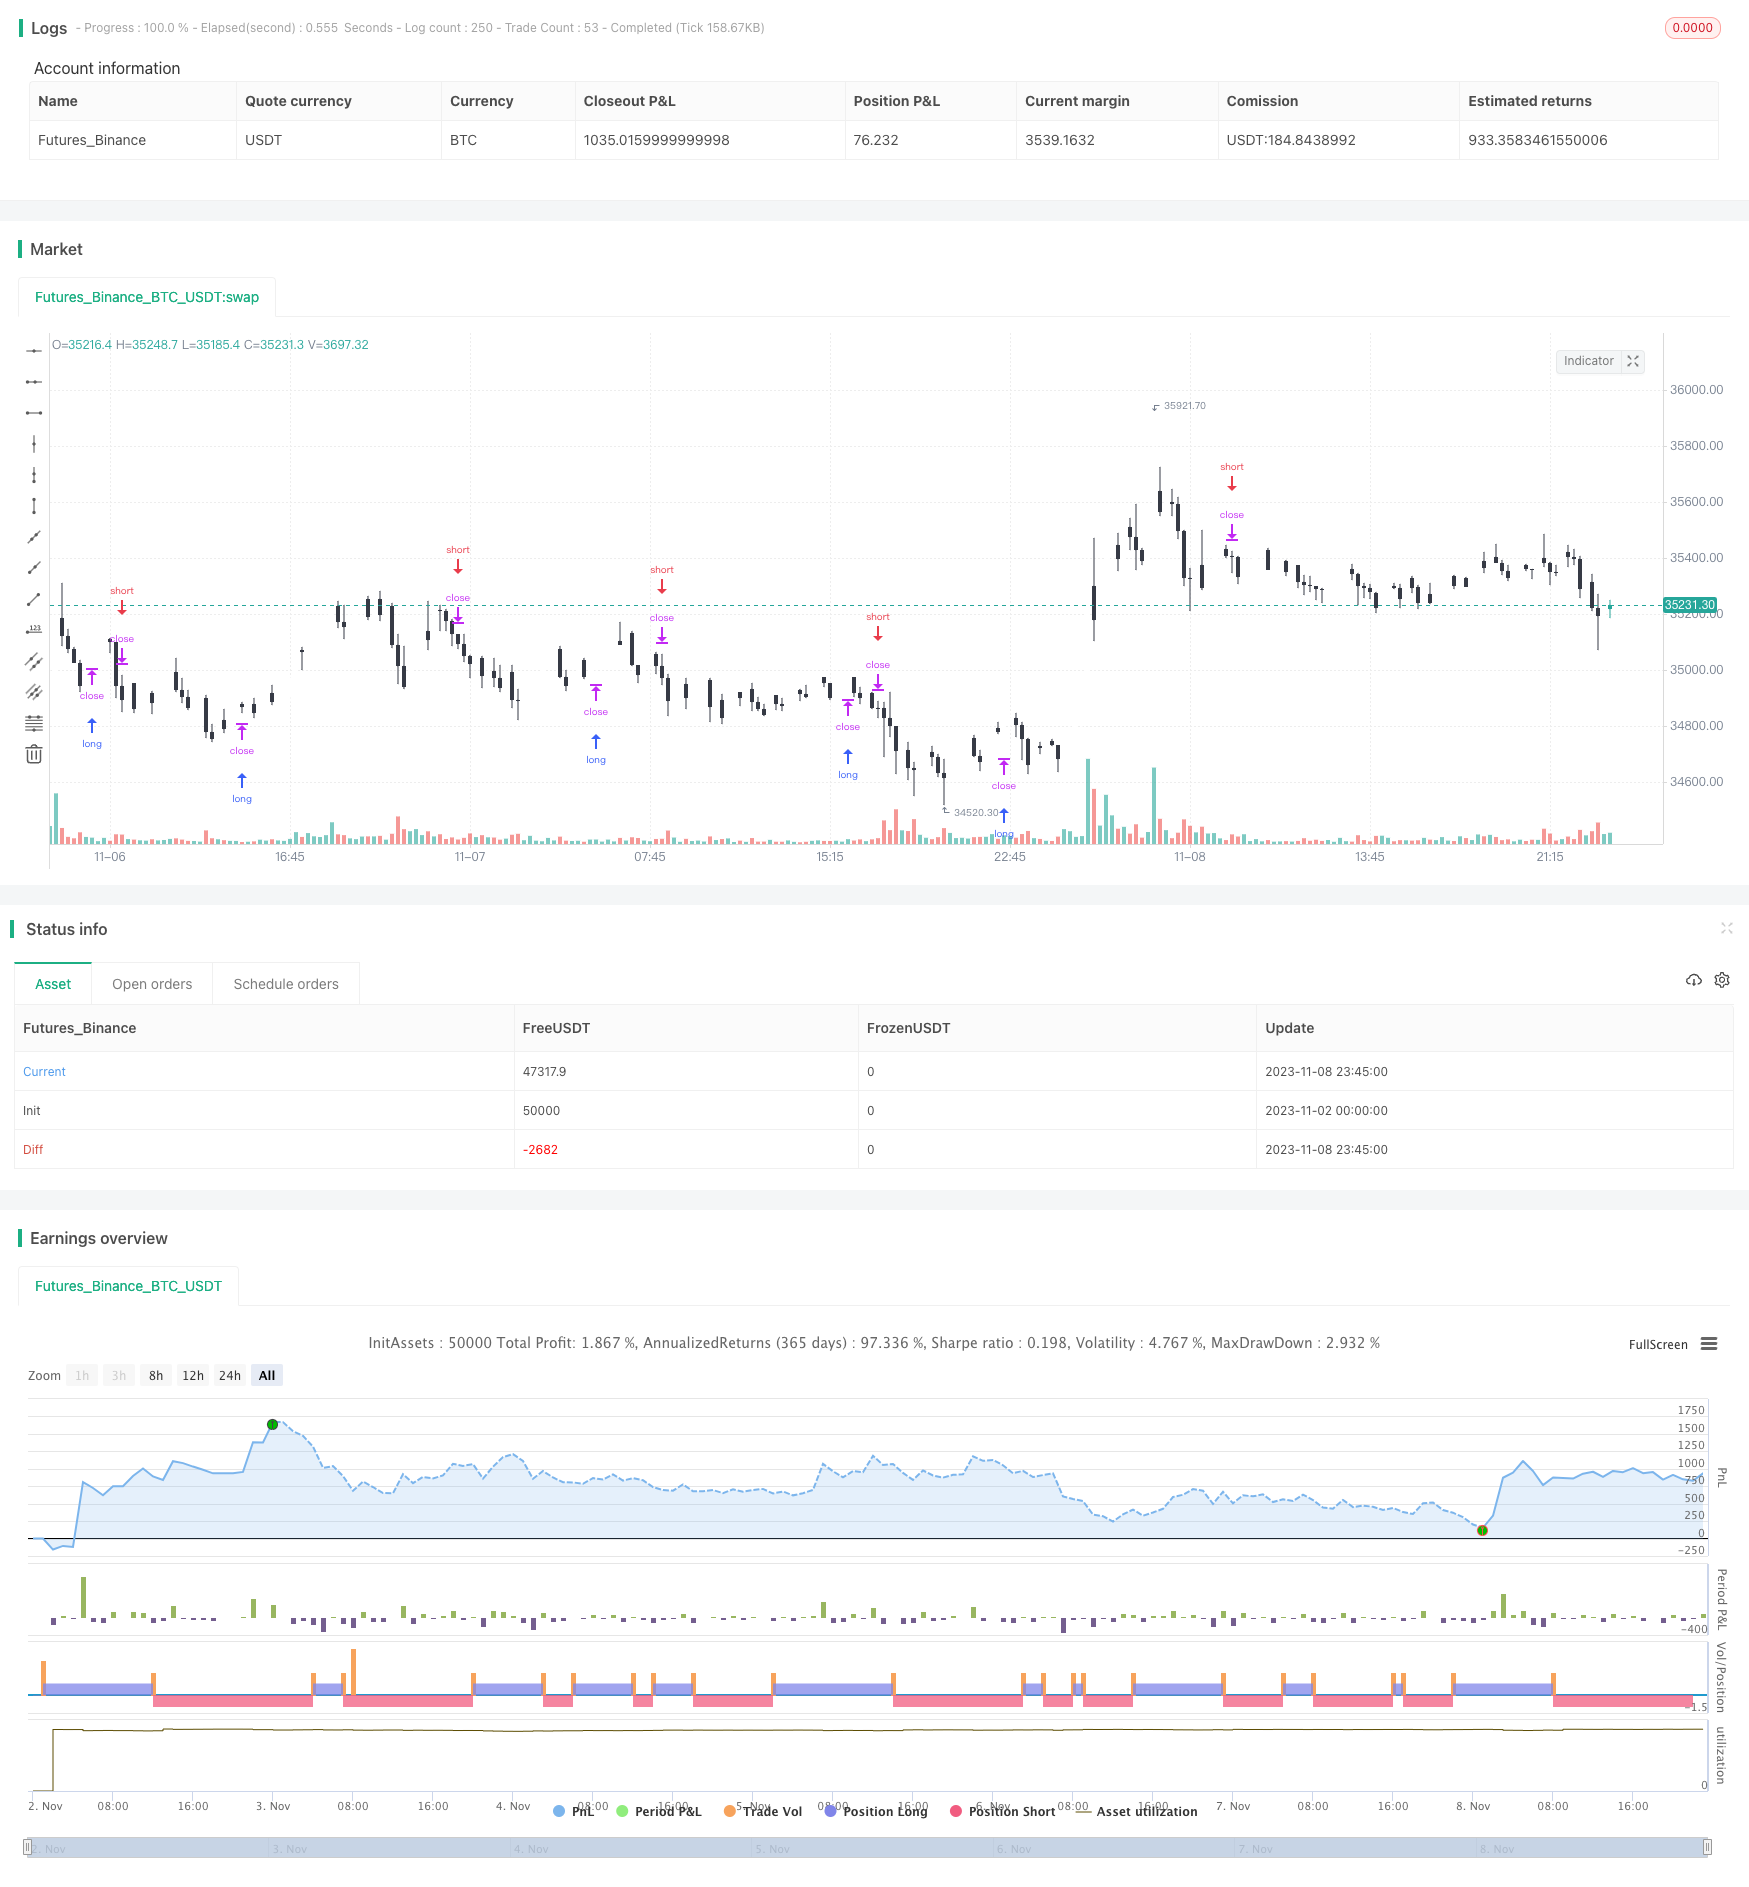 [trans]
概述
本策略基于动量指标,结合移动平均线,实现追踪市场趋势的目的。当价格上涨势头较大时做多,当价格下跌势头较大时做空,属于趋势跟踪类策略。
策略原理
-
计算价格的动量值momentum,公式为:(当前价格-N周期前价格)/N周期前价格
-
计算价格的移动平均线mid,参数为N周期移动平均
-
将动量值归一化处理normalize,将其映射到0-1区间
-
当归一化后的动量值大于0.5且价格高于移动平均线时,做多
-
当归一化后的动量值小于0.5且价格低于移动平均线时,做空
-
采用移动止损机制,设定合理的止损位置
以上就是策略的基本交易逻辑。当市场处于趋势状态时,价格会连续涨跌,从而产生较大的动量值。策略会根据动量值的大小来判断趋势的力度,并结合移动平均线的方向来决定入市。此外,止损设置也非常重要,可以有效控制风险。
优势分析
这种策略具有以下几点优势:
-
追踪市场趋势,收益潜力较大
-
动量指标对价格变化敏感,可以快速响应趋势
-
移动平均线滤除随机波动,与动量指标组合使用效果好
-
采用止损策略,可以限制个别交易的损失
-
交易逻辑简单清晰,容易实现与回测
-
可灵活调整参数,适应不同周期和市场环境
总体来说,这是一个非常适合跟踪趋势市场的策略,在一些具有明显方向性行情中,其获利能力会非常强劲。
风险分析
尽管具有诸多优势,这种策略也存在一些风险需要注意:
-
多头行情中,存在突破上轨后再度回落的风险,移动止损可能被秒杀
-
空头行情中,存在跌破下轨后反弹的风险,移动止损同样存在被套的可能
-
当市场震荡环绕移动平均线时,会产生多次不必要的交易信号
-
参数设置不当时,动量值和移动平均线可能发出错误信号
-
本策略更依赖趋势,在震荡横盘市场中表现不佳
-
须严格控制止损比例和移动幅度,防止止损过小或过快被突破
针对这些风险,需要优化止损策略,宽松参数过滤不必要信号,调整参数配适不同周期,并控制仓位规模等。
优化方向
本策略还有以下几点可以进一步优化的方向:
-
可以测试不同参数对回测结果的影响,选择最佳参数组合
-
可以加入海龟交易法则,当亏损达到2N时清仓,获利达到1N时清仓
-
可以结合波动率指标优化止损位置,根据市场波动率调整止损幅度
-
可以添加仓位管理模块,根据回撤、时间等因素调整仓位大小
-
可以试验不同的动量计算方式,如指数平滑移动平均动量指标
-
可以加入candlestick图形筛选,过滤一些鲁棒的交易信号
-
可以尝试机器学习算法进行参数优化、特征选择等
-
可以引入一定的人工经验,在关键点辅助策略决策
通过以上办法,可以期望进一步增强策略的稳定性、适应性与SUFFIX性。但任何优化都需要严格统计验证,避免过度优化。
总结
动量追踪策略是一个简单实用的趋势策略。它能敏锐捕捉市场趋势,在追涨杀跌中获得丰厚收益。但也需要注意防范回测曲线过于美化,严格控制风险,保持策略稳健性。通过参数调优和功能扩展等优化,可以使策略在更多市场环境下获得稳定收益。
||
Overview
This strategy is based on momentum indicators combined with moving averages to track market trends. It goes long when there is strong upside momentum and goes short when there is strong downside momentum. It belongs to the category of trend following strategies.
Strategy Logic
-
Calculate the momentum of price as: (Current Price - Price N periods ago) / Price N periods ago
-
Calculate the moving average mid of price over N periods
-
Normalize the momentum value to the range of 0-1
-
When the normalized momentum is greater than 0.5 and price is above moving average, go long
-
When the normalized momentum is less than 0.5 and price is below moving average, go short
-
Use a moving stop loss mechanism with proper stop loss levels
The above covers the basic trading logic. When the market is trending, price will move persistently in one direction, generating large momentum values. The strategy judges the strength of the trend using the momentum and the direction using the moving average to decide on entry. Also, the stop loss is critical for controlling risks.
Advantage Analysis
This strategy has the following advantages:
-
Tracks market trends, with potentially large gains
-
Momentum is sensitive to price changes and responds quickly to trends
-
Moving averages filter out random noise and combine well with momentum
-
Stop loss mechanism limits loss on individual trades
-
Simple and clear logic, easy to implement and backtest
-
Flexible parameters can adapt to different periods and market regimes
Overall, this is a great strategy for trending markets. It can profit significantly from directional trends.
Risk Analysis
Despite the advantages, some risks need to be noted:
-
Breakout risk in uptrends when price reverses after breaking out
-
Reversal risk in downtrends when price bounces after breaking down
-
Whipsaw signals when price oscillates around moving average
-
Wrong signals if parameters are not properly set
-
Underperforms in rangebound choppy markets
-
Strict stop loss and movement required to prevent premature exit
To address these risks, stop loss strategy needs optimization, filter unnecessary signals with loose parameters, adjust parameters for different periods, and control position sizing.
Optimization Directions
Here are some ways the strategy can be further optimized:
-
Test different parameter combinations for best backtest results
-
Incorporate the Turtle Trading rules of exiting at 2N loss and 1N profit
-
Optimize stop loss with volatility indicators for adaptive stop loss
-
Add position sizing rules based on drawdown, time, etc
-
Test different momentum calculation methods like exponential moving average momentum
-
Add candlestick pattern filters for more robust signals
-
Utilize machine learning for parameter optimization, feature selection, etc
-
Incorporate some discretionary human input at key points
With these enhancements, the strategy may achieve better stability, adaptability, and profitability. But any optimization needs strict statistical validation to avoid overfitting.
Conclusion
The momentum tracking strategy is a simple and practical trend following approach. It can nimbly capture market trends and profit from riding bubbles and crashes. But curve fitting risks need to be managed with disciplined risk controls to maintain robustness. With parameter tuning and functionality extensions, the strategy can yield steady profits in more market regimes.
[/trans]
Strategy Arguments
| Argument | Default | Description |
|---|---|---|
| v_input_1_close | 0 | src: close |
| v_input_2 | 20 | lookback |
| v_input_3 | 0 | Bar color scheme: 1 |
Source (PineScript)
/*backtest
start: 2023-11-02 00:00:00
end: 2023-11-09 00:00:00
period: 15m
basePeriod: 5m
exchanges: [{"eid":"Futures_Binance","currency":"BTC_USDT"}]
*/

//@version=3
strategy("Momentum Strategy, rev.2", overlay=true)

//
// Data
//
src = input(close)
lookback = input(20)
cscheme=input(1, title="Bar color scheme", options=[1,2])

//
// Functions
//
momentum(ts, p) => (ts - ts[p]) / ts[p]

normalize(src, len) =>
    hi  = highest(src, len)
    lo  = lowest(src, len)
    res = (src - lo)/(hi - lo)

//
// Main
//
price = close
mid = sma(src, lookback)
mom = normalize(momentum(price, lookback),100)

//
// Bar Colors
//
clr1 = cscheme==1?black: red
clr2 = cscheme==1?white: green
barcolor(close < open ? clr1 : clr2)

//
// Strategy
//
if (mom > .5 and price > mid )
    strategy.entry("MomLE", strategy.long, stop=high+syminfo.mintick, comment="MomLE")
else
    strategy.cancel("MomLE")

if (mom < .5 and price < mid )
    strategy.entry("MomSE", strategy.short, stop=low-syminfo.mintick, comment="MomSE")
else
    strategy.cancel("MomSE")

//plot(strategy.equity, title="equity", color=red, linewidth=2, style=areabr)
Detail
https://www.fmz.com/strategy/431672
Last Modified
2023-11-10 12:12:44