
9.0 KiB
Name
动量跟随的Schaff趋势循环策略Schaff-Trend-Cycle-Momentum-Following-Strategy
Author
ChaoZhang
Strategy Description
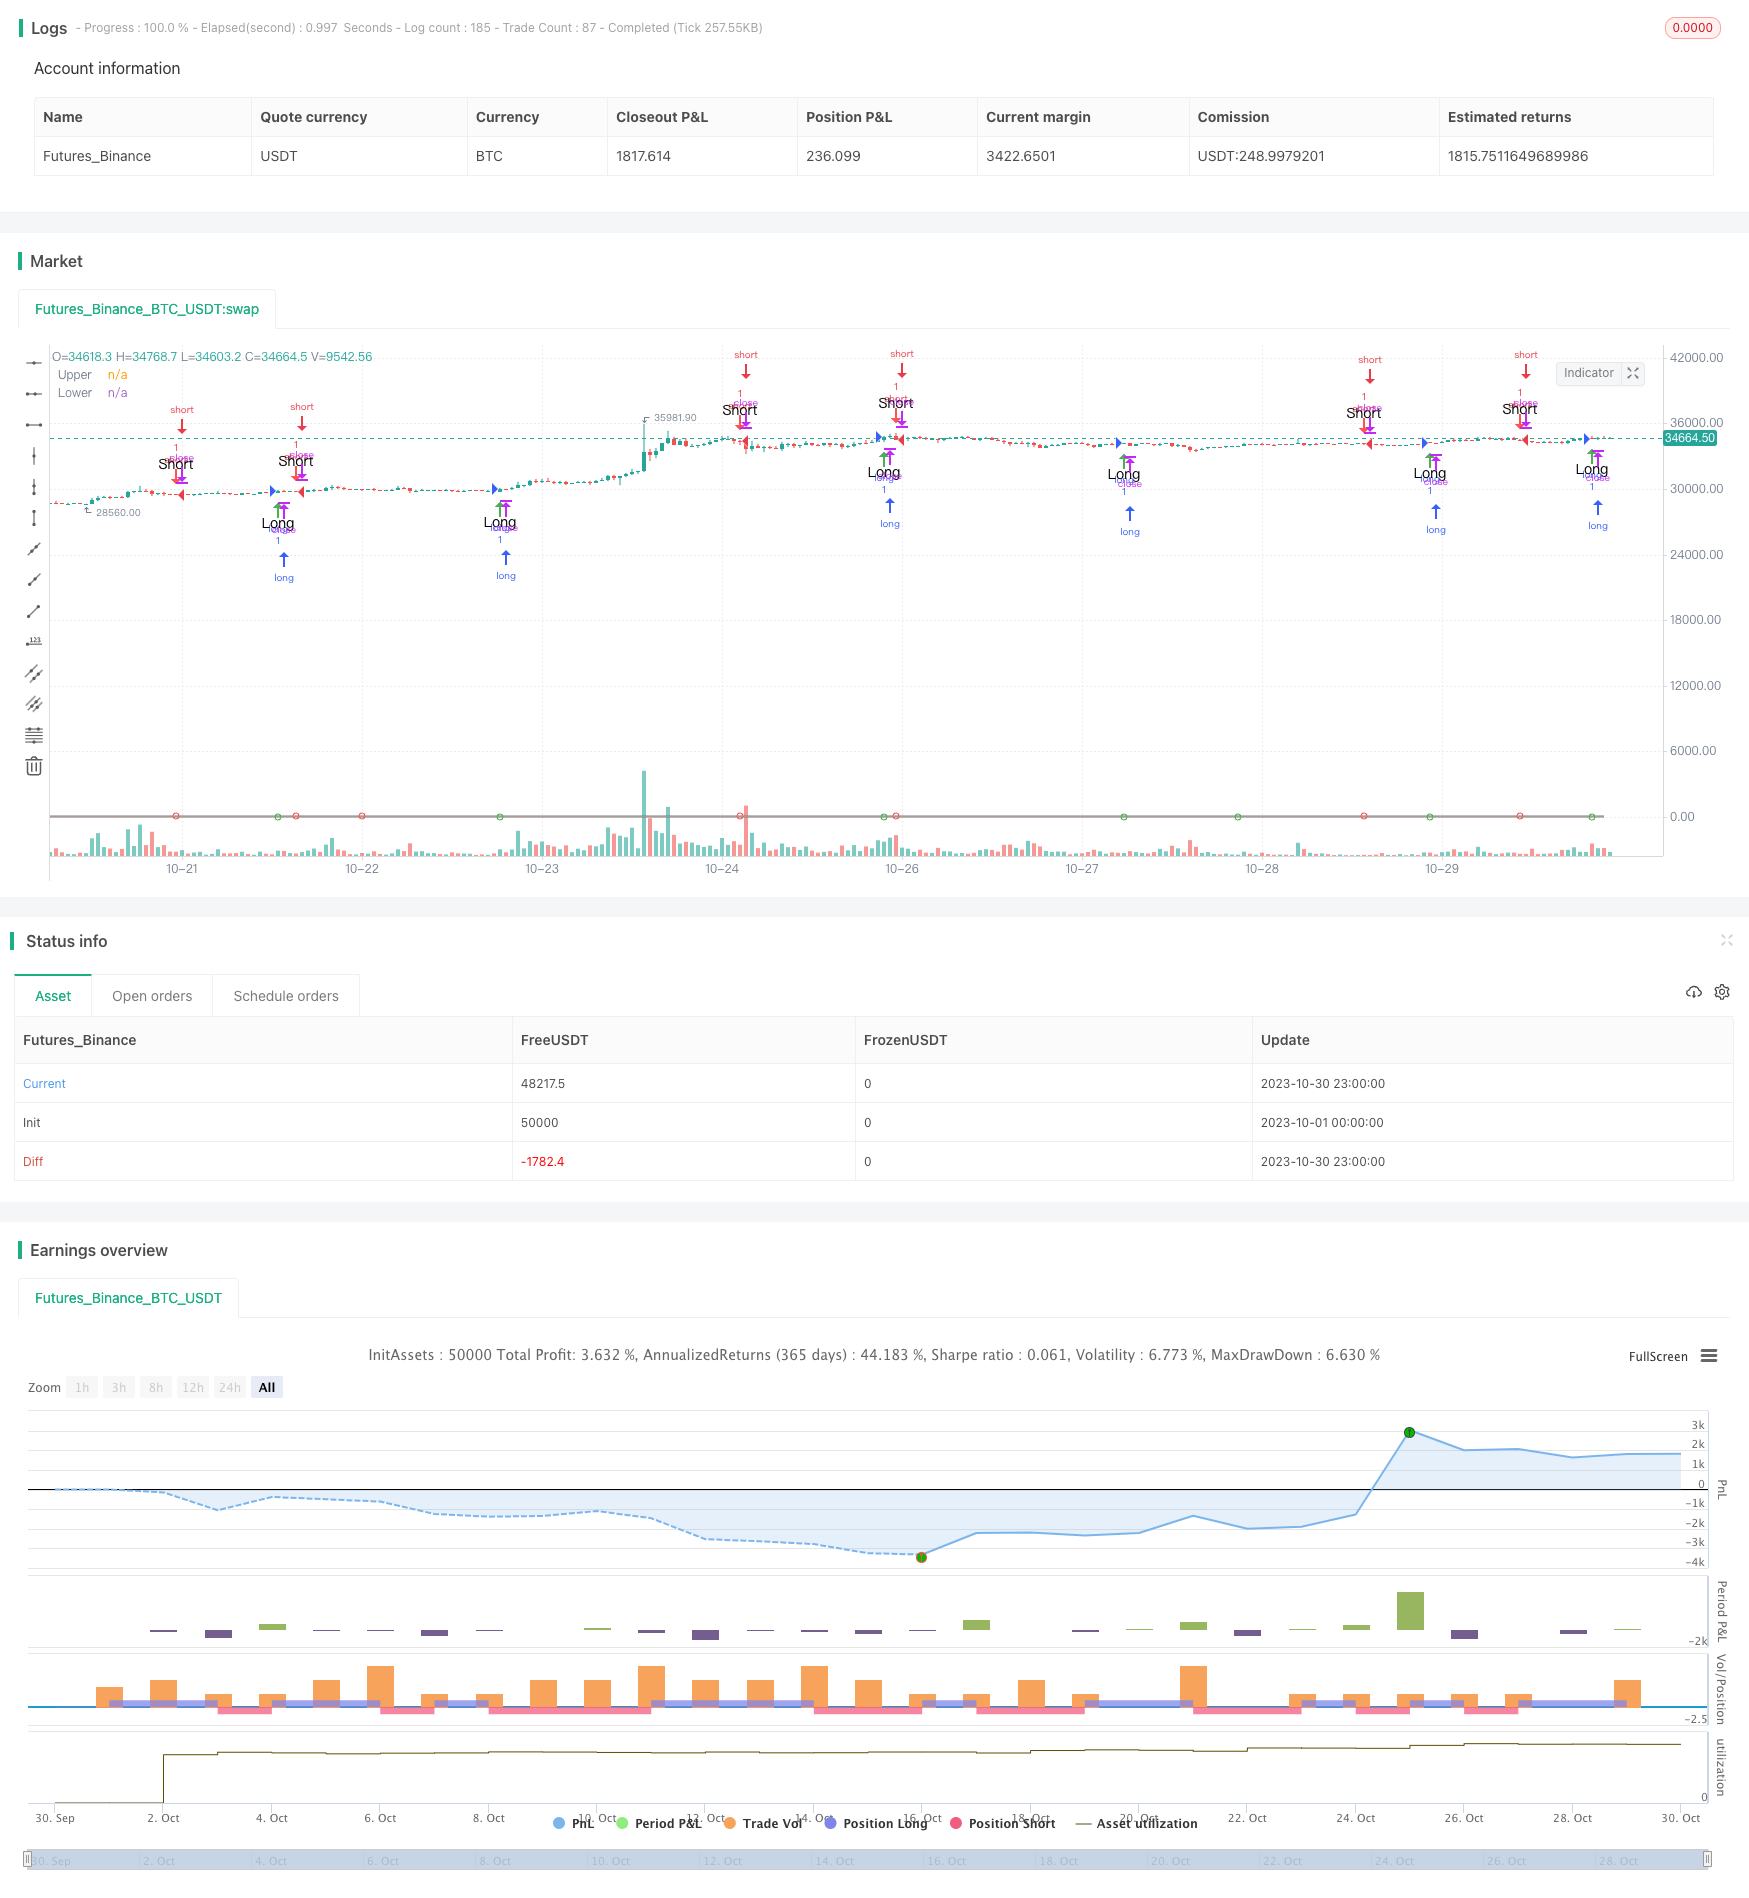 [trans]
概述
本策略基于Schaff趋势循环指标,结合Stoch RSI的超买超卖原理,通过动量指标实现趋势的判断和跟随。当价格从超卖区突破进入超买区时,做多;当价格从超买区跌破进入超卖区时,做空。该策略通过捕捉价格趋势的变化点,动态调整仓位,追踪价格走势。
策略原理
-
- 计算MACD,其中Fast Length默认值为23,Slow Length默认值为50。MACD反映短期和长期移动平均线的差值,用来判断价格动量。
-
- 对MACD进行Stoch RSI处理,形成K值,其中Cycle Length默认值为10,反映MACD的动量指标的超买超卖。
-
- 对K值加权移动平均,形成D值,其中1st %D Length默认值为3,去除K值中的噪音。
-
- 对D值再次进行Stoch RSI处理,形成初始的STC值,其中2nd %D Length默认值为3,形成精确的超买超卖信号。
-
- 对初始STC值加权移动平均,得到最终的STC值,范围0-100。STC高于75为超买区,低于25为超卖区。
-
- 当STC从下向上突破25时,做多;当STC从上向下突破75时,做空。
策略优势
-
- STC指标结合Stoch RSI的设计,可以清晰识别超买超卖区域,形成较强的趋势信号。
-
- 通过双重Stoch RSI滤波,可以有效过滤假突破。
-
- STC形成0-100标准化的范围,可以便于形成机械化的交易信号。
-
- 该策略回测实现了可视化的突破标记和文本弹窗报警,可以清晰直观地捕捉交易机会。
-
- 策略采用了优化的参数组合,可以有效控制无谓交易,避免过于敏感。
策略风险
-
- STC指标对参数敏感,不同币种和时间周期需要调整参数组合,以适应市场特点。
-
- 突破交易策略容易被套,需要设置止损以控制风险。
-
- 低流动性市场的假突破可能触发错误信号,需要结合成交量等指标进行过滤。
-
- 该策略仅基于STC指标,可结合其它因素判断趋势确认,避免被反转止损。
-
- 需要关注关键支撑阻力位,避免在该区域出现错误信号。
策略优化方向
-
- 优化MACD的参数组合,以适应不同周期和币种。
-
- 优化Stoch RSI的K值和D值参数,平滑STC曲线。
-
- 结合成交量指标,避免低流动性市场的假突破。
-
- 增加其它指标判断,确认趋势信号,例如布林带。
-
- 增加止损机制,例如移动止损或ATR止损。
-
- 调整进入位置,例如突破后回调进入,确保趋势确认。
总结
Schaff趋势循环策略通过动量指标判定超买超卖区域,并以此判断价格中短期趋势的变化。该策略简单明了,可根据不同市场调整参数,但也存在被套风险。可以通过辅助指标判断和止损来优化,在强势趋势中发挥较好效果。
||
Overview
This strategy is based on the Schaff Trend Cycle indicator, combined with the overbought and oversold principles of the Stoch RSI, to determine and follow trends using momentum metrics. It goes long when the price breaks out of the oversold region into the overbought region, and goes short when the price breaks down from the overbought region into the oversold region. The strategy dynamically adjusts positions by capturing changes in price trends.
Strategy Logic
-
- Calculate the MACD, where the default Fast Length is 23 and Slow Length is 50. MACD reflects the difference between short and long term moving averages to judge price momentum.
-
- Apply Stoch RSI to the MACD to form the K value, where the default Cycle Length is 10, reflecting overbought/oversold levels of the MACD momentum metric.
-
- Take the weighted moving average of K to form D, where the default 1st %D Length is 3, to remove noise from K.
-
- Apply Stoch RSI again to D to form the initial STC value, where the default 2nd %D Length is 3, to create precise overbought/oversold signals.
-
- Take the weighted moving average of the initial STC to get the final STC value, ranging from 0-100. STC above 75 is overbought, below 25 oversold.
-
- Go long when STC crosses above 25 upwards, and short when STC crosses downwards past 75.
Advantages
-
- STC's design combining Stoch RSI clearly identifies overbought/oversold regions, forming strong trend signals.
-
- The double Stoch RSI filtering effectively removes false breakouts.
-
- STC's standardized 0-100 range allows straightforward mechanized trade signals.
-
- The backtest implements visual breakout markings and text popup alerts for clear and intuitive signal capturing.
-
- Optimized default parameters avoid oversensitive signals and needless trades.
Risks
-
- STC is parameter sensitive. Different coins and timeframes require parameter tuning to suit market characteristics.
-
- Breakout strategies are prone to traps, requiring stops to control risk.
-
- Low liquidity false breakouts may generate bad signals, needing volume filter.
-
- STC alone risks reversals. Confirmation using other factors is needed.
-
- Key support/resistance levels should be watched to avoid bad signals.
Enhancement Opportunities
-
- Optimize MACD parameters for different periods and coins.
-
- Refine Stoch RSI K and D values to smooth STC curve.
-
- Add volume filter to avoid low liquidity false breakouts.
-
- Incorporate additional indicators to confirm signals, e.g. Bollinger Bands.
-
- Add stop mechanisms like moving/ATR stops.
-
- Adjust entry, e.g. enter on pullback after breakout for trend confirmation.
Conclusion
The Schaff Trend Cycle strategy identifies overbought/oversold via momentum metrics to determine short-term price trend changes. Though simple and adjustable, it risks traps. Confirmation and stops aid optimization for strong trends.
[/trans]
Strategy Arguments
| Argument | Default | Description |
|---|---|---|
| v_input_1 | 23 | MACD Fast Length |
| v_input_2 | 50 | MACD Slow Length |
| v_input_3 | 10 | Cycle Length |
| v_input_4 | 3 | 1st %D Length |
| v_input_5 | 3 | 2nd %D Length |
| v_input_6_close | 0 | Source: close |
| v_input_7 | true | Highlight Breakouts ? |
| v_input_8 | 75 | upper |
| v_input_9 | 25 | lower |
Source (PineScript)
/*backtest
start: 2023-10-01 00:00:00
end: 2023-10-31 00:00:00
period: 1h
basePeriod: 15m
exchanges: [{"eid":"Futures_Binance","currency":"BTC_USDT"}]
*/

//@version=3
// Copyright (c) 2018-present, Alex Orekhov (everget)
// Schaff Trend Cycle script may be freely distributed under the MIT license.
strategy("Schaff Trend Cycle", shorttitle="STC Backtest", overlay=true)

fastLength = input(title="MACD Fast Length",  defval=23)
slowLength = input(title="MACD Slow Length",  defval=50)
cycleLength = input(title="Cycle Length",  defval=10)
d1Length = input(title="1st %D Length",  defval=3)
d2Length = input(title="2nd %D Length",  defval=3)
src = input(title="Source",  defval=close)
highlightBreakouts = input(title="Highlight Breakouts ?", type=bool, defval=true)

macd = ema(src, fastLength) - ema(src, slowLength)

k = nz(fixnan(stoch(macd, macd, macd, cycleLength)))

d = ema(k, d1Length)

kd = nz(fixnan(stoch(d, d, d, cycleLength)))

stc = ema(kd, d2Length)
stc := 	stc > 100 ? 100 : stc < 0 ? 0 : stc

//stcColor = not highlightBreakouts ? (stc > stc[1] ? green : red) : #ff3013
//stcPlot = plot(stc, title="STC", color=stcColor, transp=0)

upper = input(75, defval=75)
lower = input(25, defval=25)

transparent = color(white, 100)

upperLevel = plot(upper, title="Upper", color=gray)
// hline(50, title="Middle", linestyle=dotted)
lowerLevel = plot(lower, title="Lower", color=gray)

fill(upperLevel, lowerLevel, color=#f9cb9c, transp=90)

upperFillColor = stc > upper and highlightBreakouts ? green : transparent
lowerFillColor = stc < lower and highlightBreakouts ? red : transparent

//fill(upperLevel, stcPlot, color=upperFillColor, transp=80)
//fill(lowerLevel, stcPlot, color=lowerFillColor, transp=80)

long =  crossover(stc, lower) ? lower : na
short = crossunder(stc, upper) ? upper : na

long_filt = long and not short
short_filt = short and not long

prev = 0
prev := long_filt ? 1 : short_filt ? -1 : prev[1]

long_final = long_filt and prev[1] == -1
short_final = short_filt and prev[1] == 1

strategy.entry("long", strategy.long, when = long )
strategy.entry("short", strategy.short, when = short)

plotshape(crossover(stc, lower) ? lower : na, title="Crossover", location=location.absolute, style=shape.circle, size=size.tiny, color=green, transp=0)
plotshape(crossunder(stc, upper) ? upper : na, title="Crossunder", location=location.absolute, style=shape.circle, size=size.tiny, color=red, transp=0)

alertcondition(long_final, "Long", message="Long")
alertcondition(short_final,"Short", message="Short")

plotshape(long_final, style=shape.arrowup, text="Long", color=green, location=location.belowbar)
plotshape(short_final, style=shape.arrowdown, text="Short", color=red, location=location.abovebar)
Detail
https://www.fmz.com/strategy/430757
Last Modified
2023-11-01 16:08:35