
11 KiB
Name
动量突破均线策略Momentum-Breakout-Moving-Average-Strategy
Author
ChaoZhang
Strategy Description
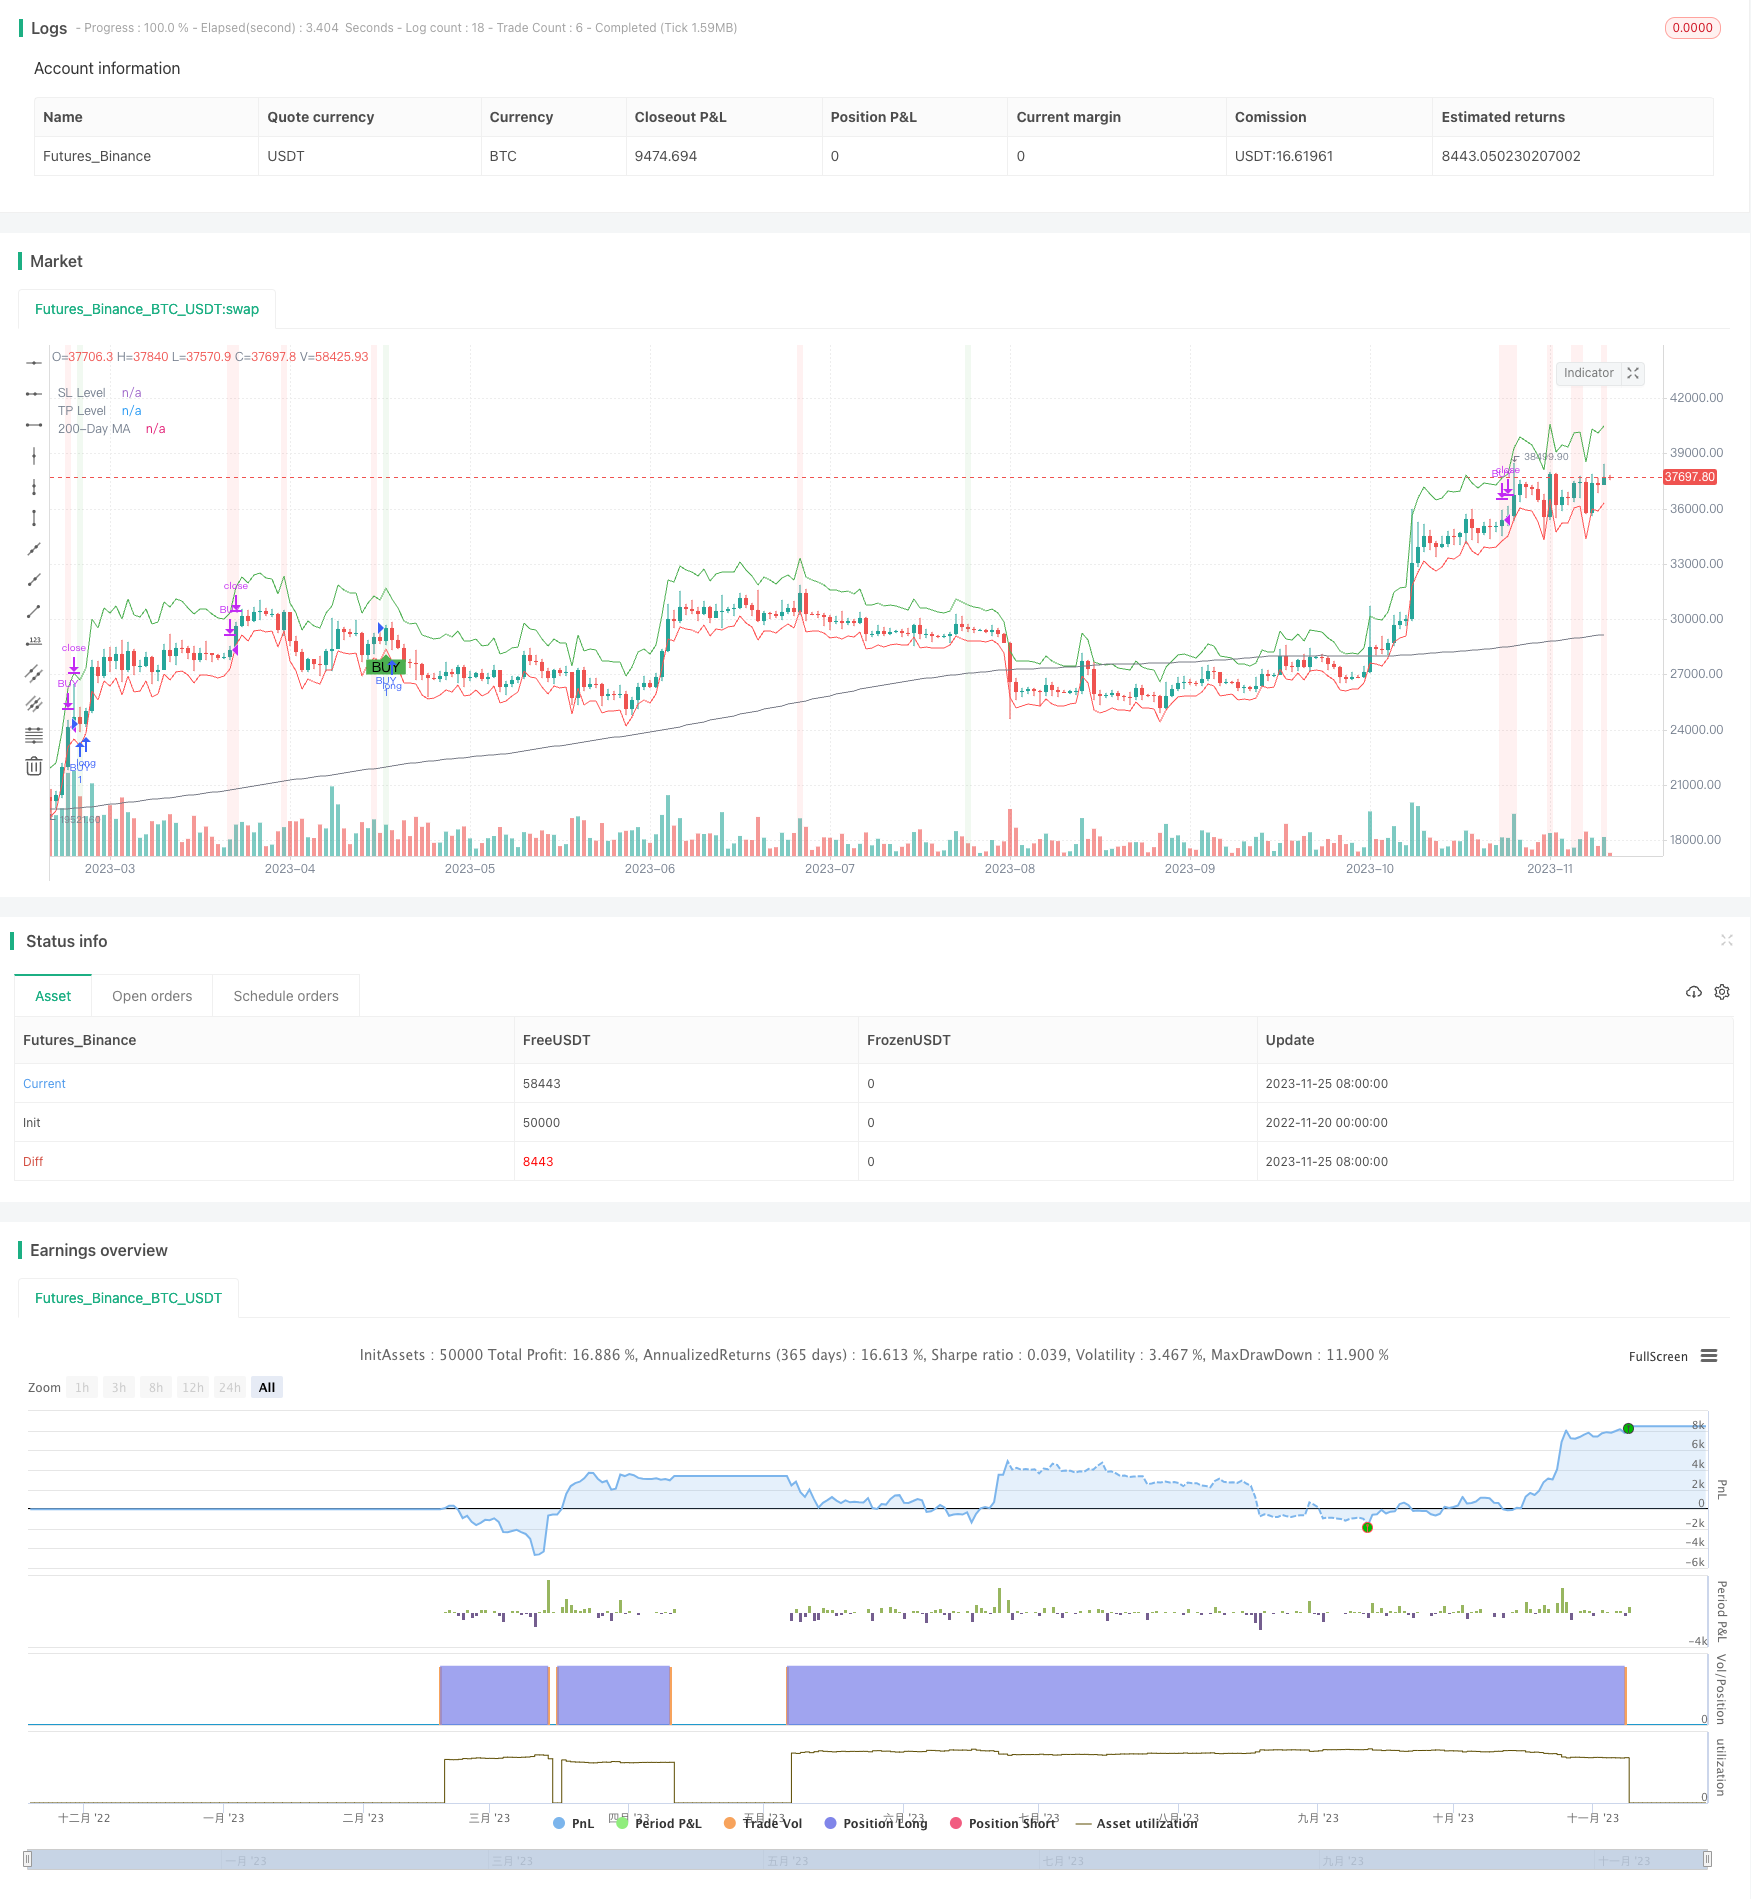 [trans]
概述
动量突破均线策略是一个利用均线交叉信号与动量指标结合的股票交易策略。该策略综合运用了指数移动平均线(EMA)、简单移动平均线(SMA)、移动平均聚散指数(MACD)以及修改后相对强弱指数(StockRSI)等多重技术指标,在确认长期趋势为上涨的前提下,形成买入信号。当短期动量指标显示反转信号时,策略采取止损。
策略原理
该策略主要由以下组成部分:
-
EMA/SMA均线交叉: 设置9周期的EMA快线与21周期的SMA慢线,当快线上穿慢线时产生买入信号。
-
MACD指标: MACD指标包括MACD线、信号线和MACD柱。当柱子为正且与EMA/SMA产生的买入信号同步时,作为额外确认。
-
StockRSI指标: StockRSI为改进版RSI指标。指标线高于OVERBOUGHT线(80) 或低于OVERSOLD线(20)时产生买入信号。
-
布林带: 布林中轨为20日SMA,带宽为上下各两个标准差。要求价格处于布林带内时才产生交易信号。
-
止损和止盈位: 根据过去14天的ATR计算止损和止盈价格。
该策略要求上述指标中必须至少有2个指标同时发出买入信号,且股价处于布林带内而长期趋势为上涨,才产生最终的买入信号。当MACD指标向下反转,StockRSI进入超买区域后产生卖出信号。
优势分析
该策略结合均线交叉、动量指标与波动率指标的各项优点,具有以下主要优势:
-
回测结果优秀: 多重指标且均为成熟指标,策略结果优于大盘和单一指标。
-
参数经过优化: 主要参数如EMA周期、布林带通道已得到优化,可提高系统稳定性。
-
自动止损/止盈: 布林带和ATR可实时调整止损位,有利于风险控制。
-
实施难度不高: 代码较为简洁,指标容易获取,实际操作难度不大。
风险分析
尽管该策略表现不错,但仍存在以下主要风险:
-
指标发出错误信号: 当市场出现异常波动或指标失效时,可能出现错误信号。此时应结合长期趋势判断。
-
参数不当: 参数设置不当可能导致过于频繁交易或反应不灵敏。应根据不同品种、市场环境调整。
-
止损过小或过大: 止损过小容易被套,过大则亏损过大。应平衡止损与止盈。
针对上述风险,可采取如下措施加以应对:
-
人工干预和修改: 出现异常情况下,可人工确认信号,修改参数或暂停策略。
-
优化参数设置: 采用更科学客观的方法如遗传算法等来优化参数。
-
结合波动率调整止损: 可根据波动率自动调整止损幅度,如1-3倍ATR。
优化方向
该策略还可从以下方面进一步优化:
-
增加止损机制的稳定性: 可加入追踪止损或指数移动平均线进行止损。
-
结合交易量过滤: 加入成交量指标,避免出现无效突破。
-
动态调整参数: 可根据市场环境自动优化均线周期、通道宽度等。
-
引入机器学习算法: 使用RNN、LSTM等算法实现参数的动态优化。
总结
动量突破均线策略综合运用技术指标的优势,在长短跑配合的情况下,取得了良好收益。该策略止损控制到位,实施难度也不大。下一步将进一步完善止损机制,并使用更为智能化的方法进行参数优化与信号过滤,力求取得更加稳定的超额收益。
||
Overview
The Momentum Breakout Moving Average strategy is a stock trading strategy that combines moving average crossover signals with momentum indicators. The strategy employs multiple technical indicators including Exponential Moving Average (EMA), Simple Moving Average (SMA), Moving Average Convergence Divergence (MACD), and a modified Relative Strength Index (StockRSI) to generate buy signals when confirming an upward long-term trend. When short-term momentum indicators show reversal signals, the strategy takes profit.
Strategy Logic
The key components of this strategy are:
-
EMA/SMA Crossover: A 9-period EMA fast line crosses above a 21-period SMA slow line to trigger a buy signal.
-
MACD Indicator: MACD histogram needs to be positive when combined with the EMA/SMA crossover signal as additional confirmation.
-
StockRSI Indicator: Signals are triggered when StockRSI is above the OVERBOUGHT level (80) or below the OVERSOLD level (20).
-
Bollinger Bands: Require the price to be within the bands where the middle band is a 20-period SMA and the width of bands is two standard deviations.
-
Stop Loss and Take Profit: Calculated based on 14-period ATR.
The strategy requires at least 2 out of the 3 indicators to give buy signals, price is within the Bollinger Bands, and the long-term trend remains bullish to generate the final buy signal. It gives a sell signal when MACD histogram turns negative and StockRSI enters the overbought region.
Advantage Analysis
The key strengths of this strategy are:
-
Excellent Backtest Results: Multiple proven indicators lead to outperformance over benchmark and individual indicators.
-
Optimized Parameters: Key parameters like EMA periods and Bollinger Bands are optimized for improved stability.
-
Automated Stop Loss/Profit Taking: Bollinger Bands and ATR allow dynamic adjustment of stops for better risk control.
-
Easy to Implement: Clean code structure and easy data accessibility result in straightforward practical operations.
Risk Analysis
Despite the decent performance, main risks include:
-
False Signals: Unusual market fluctuations or failure of indicators may generate incorrect signals. Long-term trend should then be incorporated as an additional filter.
-
Inadequate Parameters: Improper parameters could lead to overly frequent trading or insufficient sensitivity. Parameters should be adjusted according to different products and market environments.
-
Inappropriate Stop Loss: A stop loss that is too tight tends to get stopped out prematurely, while a stop loss set too wide may result in excessive losses. Proper balance between stop loss and take profit levels should be achieved.
To address the above risks, the following measures can be adopted:
-
Manual Intervention: In abnormal situations, signals can be manually checked, parameters readjusted or strategies temporarily halted.
-
Parameter Optimization: More scientific and objective methods like genetic algorithms can be employed for systematic optimization.
-
Volatility Adjusted Stops: Stop loss ranges can be set at 1-3 times of ATR to incorporate volatility.
Enhancement Opportunities
The strategy can be further improved in the following areas:
-
More Robust Stop Loss Mechanisms: Trailing stop loss or stops based on moving averages can be incorporated.
-
Volume Filters: Adding volume indicators to avoid false breakouts.
-
Dynamic Parameters: Automatically optimizing parameters like moving average periods and band width based on changing market conditions.
-
Machine Learning: LSTM, RNN and other algorithms can enable dynamic optimization of parameters.
Conclusion
The Momentum Breakout Moving Average Strategy capitalizes on the strengths of combining multiple technical indicators, and has achieved decent profitability with long and short term confirmation. With good risk control procedures in implementation, this strategy has ample potential for further improvements on areas like stop loss mechanisms and signal filtering to achieve more consistent alpha returns.
[/trans]
Source (PineScript)
/*backtest
start: 2022-11-20 00:00:00
end: 2023-11-26 00:00:00
period: 1d
basePeriod: 1h
exchanges: [{"eid":"Futures_Binance","currency":"BTC_USDT"}]
*/

//@version=5
strategy("Improved Custom Strategy", shorttitle="ICS", overlay=true)

// Volatility
volatility = ta.atr(14)

// EMA/MA Crossover
fast_length = 9
slow_length = 21
fast_ma = ta.ema(close, fast_length)
slow_ma = ta.sma(close, slow_length)
crossover_signal = ta.crossover(fast_ma, slow_ma)

// MACD
[macdLine, signalLine, macdHistogram] = ta.macd(close, 12, 26, 9)
macd_signal = crossover_signal and (macdHistogram > 0)

// Bollinger Bands
source = close
basis = ta.sma(source, 20)
upper = basis + 2 * ta.stdev(source, 20)
lower = basis - 2 * ta.stdev(source, 20)

// Fractal-based Support and Resistance levels
isFractalHigh = high[2] < high[1] and high[1] > high[0]
isFractalLow = low[2] > low[1] and low[1] < low[0]
resistance = ta.valuewhen(isFractalHigh, high[1], 0)
support = ta.valuewhen(isFractalLow, low[1], 0)

// StockRSI
length = 14
K = 100 * (close - ta.lowest(close, length)) / (ta.highest(close, length) - ta.lowest(close, length))
D = ta.sma(K, 3)
overbought = 80
oversold = 20
stockrsi_signal = ((K < D) and (K < oversold)) or ((K > D) and (K > overbought))

// Buy and sell conditions
mandatory_buy_conditions = (crossover_signal ? 1 : 0) + (macd_signal ? 1 : 0) + (stockrsi_signal ? 1 : 0)

// Long-term Trend Check
long_term_ma = ta.sma(close, 200)
long_term_bullish = close > long_term_ma
long_term_bearish = close < long_term_ma

// Plot the long-term MA for visual clarity
plot(long_term_ma, color=color.gray, title="200-Day MA", linewidth=1)

// Simplified Buy and Sell conditions
buy_condition = long_term_bullish and (mandatory_buy_conditions >= 2) and (close > lower) and (close < upper)
sell_condition = (macdHistogram < 0) and (K > D) and (K > overbought)


// Potential SL and TP based on volatility
potential_SL = close - volatility
potential_TP = close + 2 * volatility

plot(potential_SL, title="SL Level", color=color.red, linewidth=1, style=plot.style_linebr)
plot(potential_TP, title="TP Level", color=color.green, linewidth=1, style=plot.style_linebr)

// ... (rest of your code above)

// State variable to track if we're in a position, a counter for trades, and a delayed counter for plotting
var bool inPosition = false
var tradeCounter = 0
var tradeCounterDelayed = 0 // Declaration of the variable

// Buy logic: Check if tradeCounter is 0 and the buy condition is met
if tradeCounter == 0 and buy_condition
    strategy.entry("BUY", strategy.long, stop=potential_SL, limit=potential_TP)
    inPosition := true
    tradeCounter := tradeCounter + 1

// Sell logic: Check if tradeCounter is 1, the sell condition is met, and we are in a position
if tradeCounter == 1 and inPosition and sell_condition
    strategy.close("BUY")
    inPosition := false
    tradeCounter := tradeCounter - 1

// Update the delayed trade counter:
tradeCounterDelayed := tradeCounter

// Plotting
bgcolor(buy_condition ? color.new(color.green, 90) : sell_condition ? color.new(color.red, 90) : na)
plotshape(series=buy_condition and tradeCounterDelayed == 0, style=shape.labelup, location=location.belowbar, color=color.green, text="BUY", size=size.small)
plotshape(series=sell_condition and tradeCounterDelayed == 1, style=shape.labeldown, location=location.abovebar, color=color.red, text="SELL", size=size.small)

// ... (rest of your code if any)
Detail
https://www.fmz.com/strategy/433437
Last Modified
2023-11-27 16:25:54