
8.3 KiB
Name
动量突破卡玛拉支撑策略Momentum-Breakout-Camarilla-Support-Strategy
Author
ChaoZhang
Strategy Description
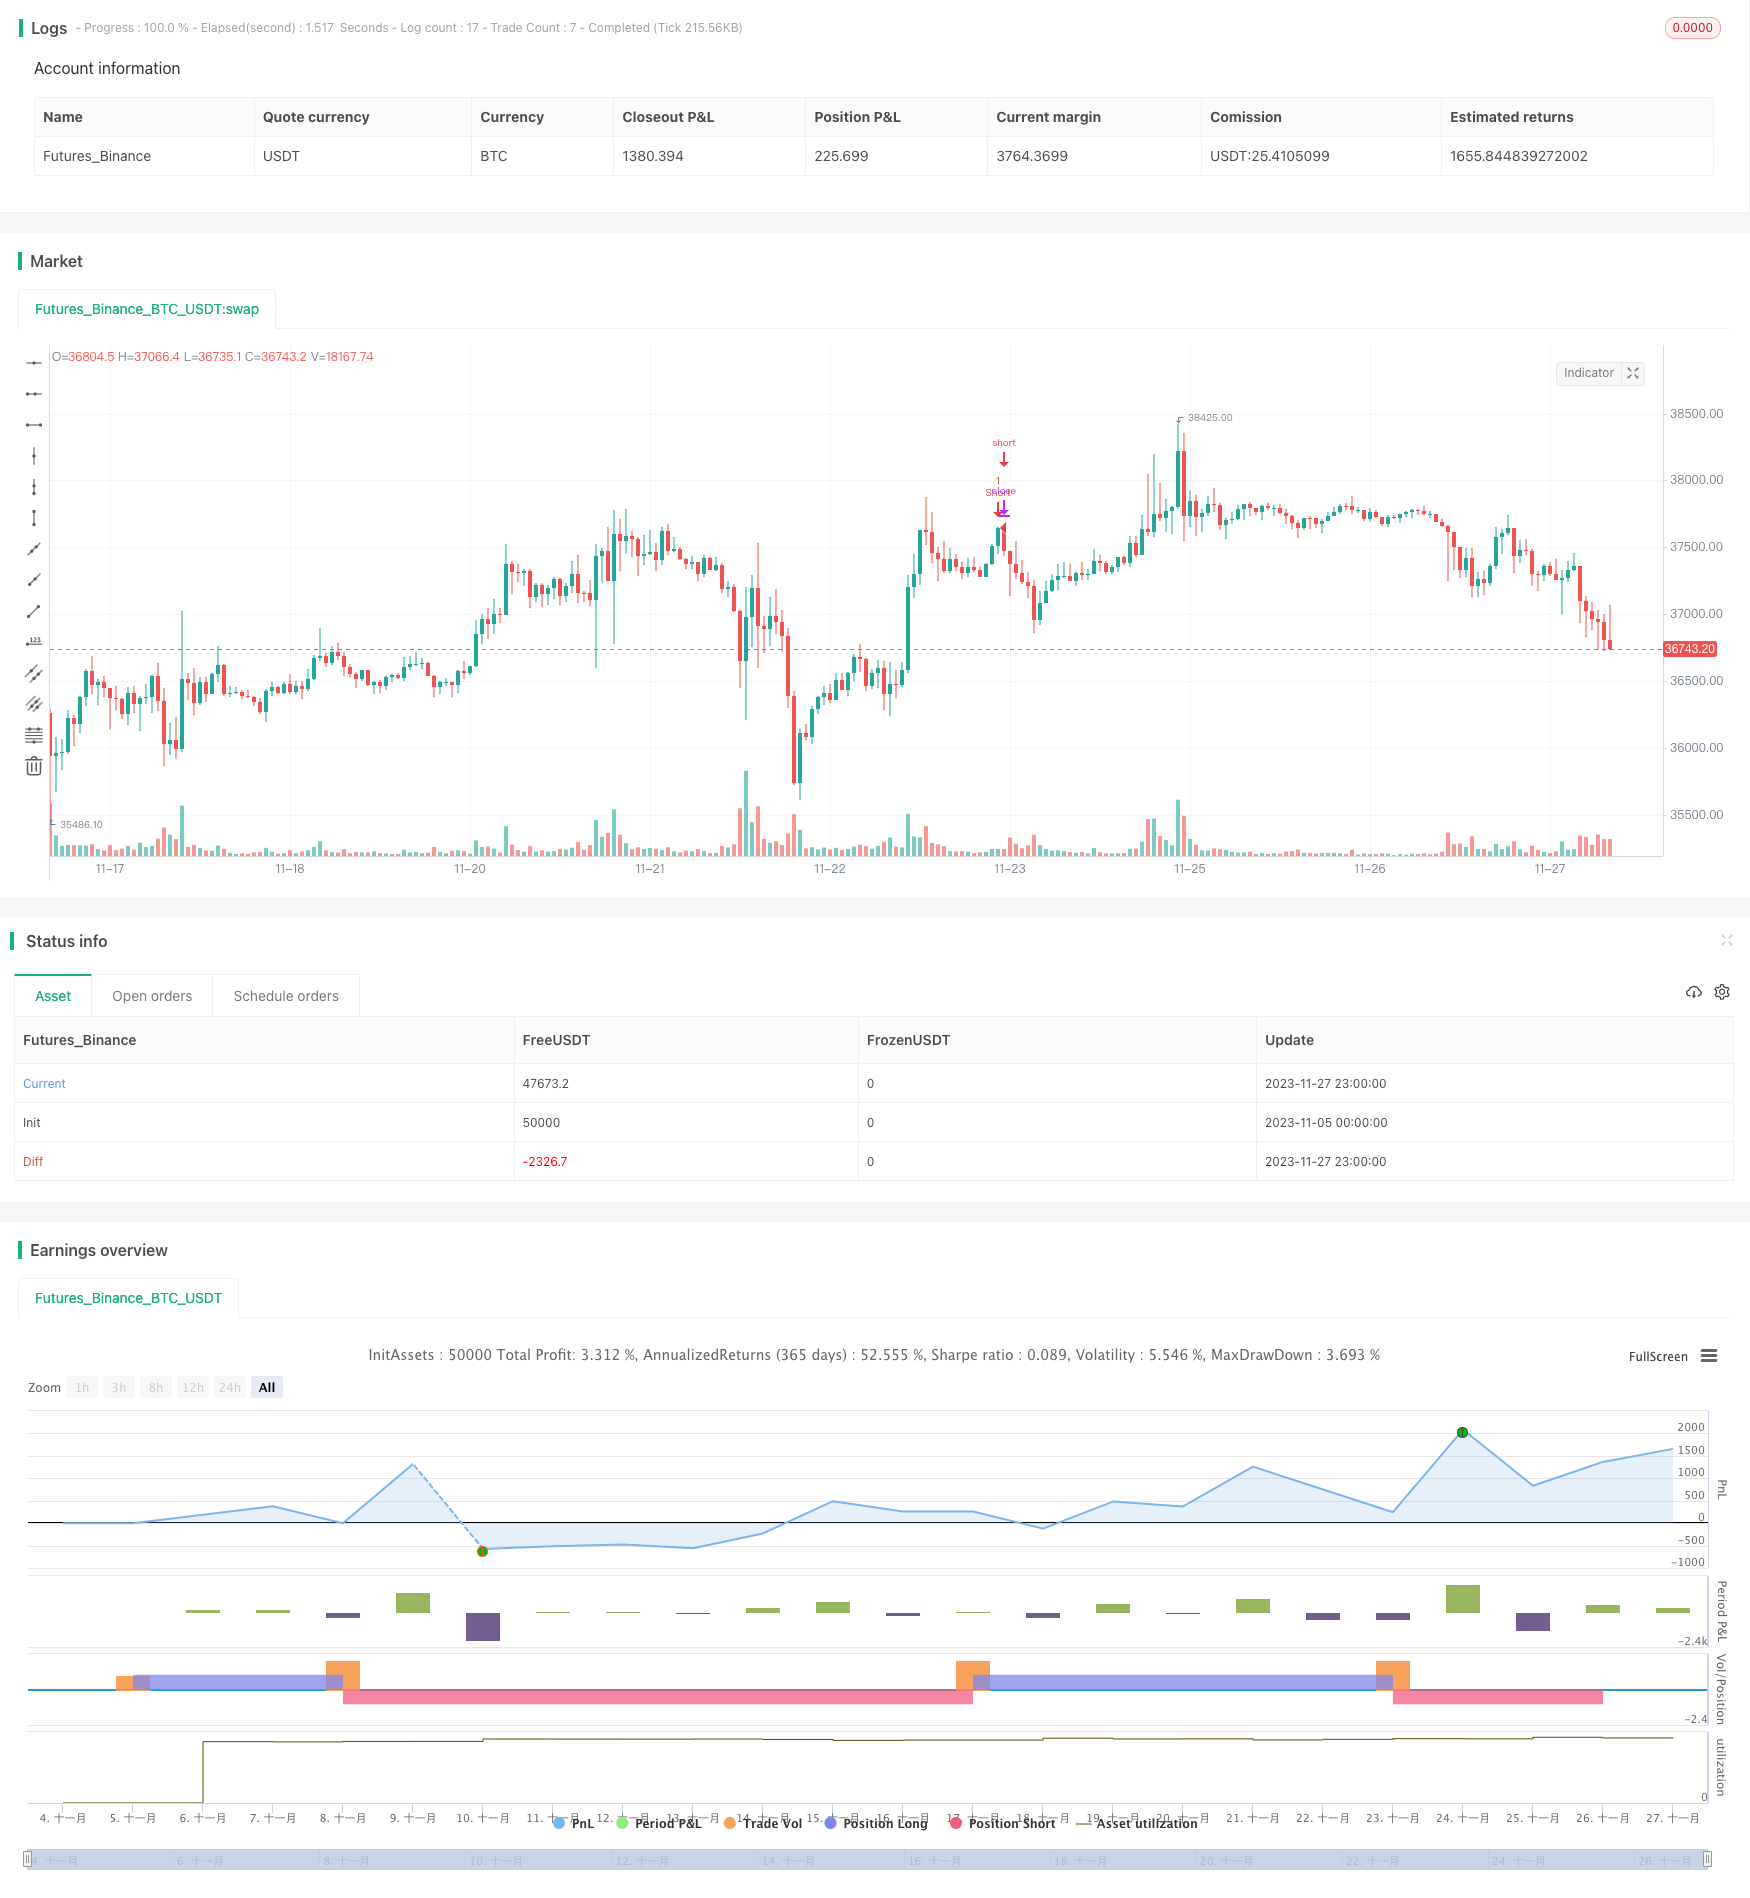
[trans]
概述
本策略是一个利用动量指标与关键支持位结合的突破交易策略。它结合了卡玛拉支撑位、移动平均线以及价格突破来产生交易信号。
策略原理
策略的核心逻辑是:当价格处于关键的卡玛拉支撑位附近且有效突破该位时,产生买入信号;当价格上涨至关键的卡玛拉阻力位时,产生卖出信号。
具体来说,策略利用卡玛拉支撑位L3作为买入信号的确认位。当价格低于L3且低于L3与L2的中点时会触发买入条件。这表示价格接近关键支撑,有望得到支撑反弹。为过滤假突破,策略还设置了进场条件:收盘价要大于开盘价。
策略的止损方式则是设定了动态止损位。当价格超过卡玛拉阻力位H1与H2的中点时,会触发止损卖出。这个动态止损位能够根据市场波动幅度来 trailing stop loss。
优势分析
这是一个结合趋势和支持位的可靠策略。它的优势有:
- 利用关键卡玛拉位,这是经过反复验证的重要价格位。
- 结合趋势过滤器,能减少被套。当EMA多头时才做多,EMA空头时才做空。
- 动态止损策略,根据市场波动调整止损位,容错性强。
风险分析
该策略也存在一些风险:
- 卡玛拉位可能失效。市场结构变化时,这些关键位可能不再适用。
- 止损过于激进,小止损可能被预先击出。
- 买入信号可能出现在下跌过程中的误导性反弹上,存在亏损风险。
对策是:调整卡玛拉位的参数,使之更符合目前市场波动范围;适当放宽止损幅度,防止过早止损;在趋势下跌时只做空仓,避免做多被套。
优化方向
该策略还可进一步优化的方向有:
- 增加附加过滤条件,如量能指标、弹性指标等,避免误入错误方向。
- 优化卡玛拉参数,使支撑阻力位更符合当前波动范围。
- 尝试不同的移动平均线参数,寻找最佳参数组合。
- 根据不同品种特点,调整止损激进程度。
总结
本策略综合运用了趋势、支撑位、突破等多个维度来制定入场和止损规则,是一种较为稳健的突破交易策略。它结合卡玛拉重要位的验证效果与动量指标的趋势判断,旨在在高概率区域捕捉趋势交易机会。同时设置动态止损来控制风险。该策略可为我们的策略库增加一种有效的趋势突破策略。
||
Overview
This is a breakout trading strategy that combines momentum indicators and key support levels. It utilizes Camarilla pivots, moving average and price breakout to generate trading signals.
Strategy Logic
The core logic of the strategy is: when the price is near the key Camarilla support level and effectively breaks through that level, a buy signal is generated; when the price rises to the key Camarilla resistance level, a sell signal is generated.
Specifically, the strategy uses Camarilla support level L3 as the confirmation level for the buy signal. When the price is below L3 and below the midpoint of L3 and L2, the buy condition will be triggered. This indicates that the price is close to critical support and is likely to rebound. To filter out false breakouts, the strategy also sets the entry criteria that the closing price must be greater than the opening price.
The stop loss method of the strategy is to set a dynamic stop loss level. When the price exceeds the midpoint of the Camarilla resistance levels H1 and H2, the stop loss sell will be triggered. This dynamic stop loss level can trail stop loss based on market volatility.
Advantage Analysis
This is a reliable strategy that combines trends and support levels. Its advantages are:
- Use of key Camarilla levels that are proven important price levels.
- Combining trend filter to reduce being caught in trends. Only go long when EMA is bullish and only go short when EMA is bearish.
- Dynamic stop loss strategy adjusts stop level based on market volatility, with strong fault tolerance.
Risk Analysis
The strategy also has some risks:
- Camarilla levels may fail. These key levels may no longer apply when market structure changes.
- Stop loss is too aggressive. Small stops may be prematurely hit.
- Buy signals may appear on misleading pullbacks in downtrends, with risk of losses.
The counter measures are: adjust Camarilla parameters to better fit current market volatility range; appropriately widen stop loss range to prevent premature stop out; only short when in downtrend to avoid long trap.
Optimization Directions
Further optimization directions for this strategy include:
- Add additional filter conditions such as volume or elasticity indicators to avoid wrong direction entry.
- Optimize Camarilla parameters to make support/resistance levels fit better with current fluctuation range.
- Try different moving average parameters to find best parameter combination.
- Adjust aggressiveness of stops based on characteristics of different products.
Conclusion
This strategy comprehensively utilizes multiple dimensions like trend, support level, breakout to formulate entry and stop rules. It is a relatively robust breakout trading strategy. It combines the verification effectiveness of important Camarilla levels and the trend judgment of momentum indicators. This is aimed to capture trend trading opportunities in high probability areas. Meanwhile, dynamic stops are set to control risks. This strategy can increase our strategy library by an effective trend breakout strategy.
[/trans]
Source (PineScript)
/*backtest
start: 2023-11-05 00:00:00
end: 2023-11-28 00:00:00
period: 1h
basePeriod: 15m
exchanges: [{"eid":"Futures_Binance","currency":"BTC_USDT"}]
*/

//@version=2
//Created by CristianD
strategy(title="CamarillaStrategyVhaouri", shorttitle="CD_Camarilla_StrategyV1", overlay=true)
//sd = input(true, title="Show Daily Pivots?")
EMA = ema(close,8)
hh ="X"
//Camarilla
pivot = (high + low + close ) / 3.0
range = high - low
h5 = (high/low) * close
h4 = close + (high - low) * 1.1 / 2.0
h3 = close + (high - low) * 1.1 / 4.0
h2 = close + (high - low) * 1.1 / 6.0
h1 = close + (high - low) * 1.1 / 12.0
l1 = close - (high - low) * 1.1 / 12.0
l2 = close - (high - low) * 1.1 / 6.0
l3 = close - (high - low) * 1.1 / 4.0
l4 = close - (high - low) * 1.1 / 2.0
h6 = h5 + 1.168 * (h5 - h4)
l5 = close - (h5 - close)
l6 = close - (h6 - close)

// Daily line breaks
//sopen = request.security(syminfo.tickerid, "D", open [1])
//shigh = request.security(syminfo.tickerid, "D", high [1])
//slow = request.security(syminfo.tickerid, "D", low [1])
//sclose = request.security(syminfo.tickerid, "D", close [1])
//
// Color
//dcolor=sopen != sopen[1] ? na : black
//dcolor1=sopen != sopen[1] ? na : red
//dcolor2=sopen != sopen[1] ? na : green

//Daily Pivots
dtime_pivot = request.security(syminfo.tickerid, 'W', pivot[1])
dtime_h6 = request.security(syminfo.tickerid, 'W', h6[1])
dtime_h5 = request.security(syminfo.tickerid, 'W', h5[1])
dtime_h4 = request.security(syminfo.tickerid, 'W', h4[1])
dtime_h3 = request.security(syminfo.tickerid, 'W', h3[1])
dtime_h2 = request.security(syminfo.tickerid, 'W', h2[1])
dtime_h1 = request.security(syminfo.tickerid, 'W', h1[1])
dtime_l1 = request.security(syminfo.tickerid, 'W', l1[1])
dtime_l2 = request.security(syminfo.tickerid, 'W', l2[1])
dtime_l3 = request.security(syminfo.tickerid, 'W', l3[1])
dtime_l4 = request.security(syminfo.tickerid, 'W', l4[1])
dtime_l5 = request.security(syminfo.tickerid, 'W', l5[1])
dtime_l6 = request.security(syminfo.tickerid, 'W', l6[1])

men = (dtime_l1-dtime_l2)/7
//plot(sd and dtime_l5 ? dtime_l5 : na, title="Daily L5",color=dcolor2, linewidth=2)
//plot(sd and dtime_l6 ? dtime_l6 : na, title="Daily L6",color=dcolor2, linewidth=2)

longCondition = close <=dtime_l3 and close  <= (dtime_l3-men)//close >dtime_h4 and open < dtime_h4 and EMA < close
if (longCondition)
    strategy.entry("Long12", strategy.long)
    strategy.exit ("Exit Long","Longl2")
if (high >= (dtime_h1-men))
    strategy.entry("Short", strategy.short)
    strategy.exit ("Exit Short","Short")
Detail
https://www.fmz.com/strategy/434487
Last Modified
2023-12-06 18:09:06