
9.0 KiB
Name
动量突破交易策略Momentum-Breakout-Strategy
Author
ChaoZhang
Strategy Description
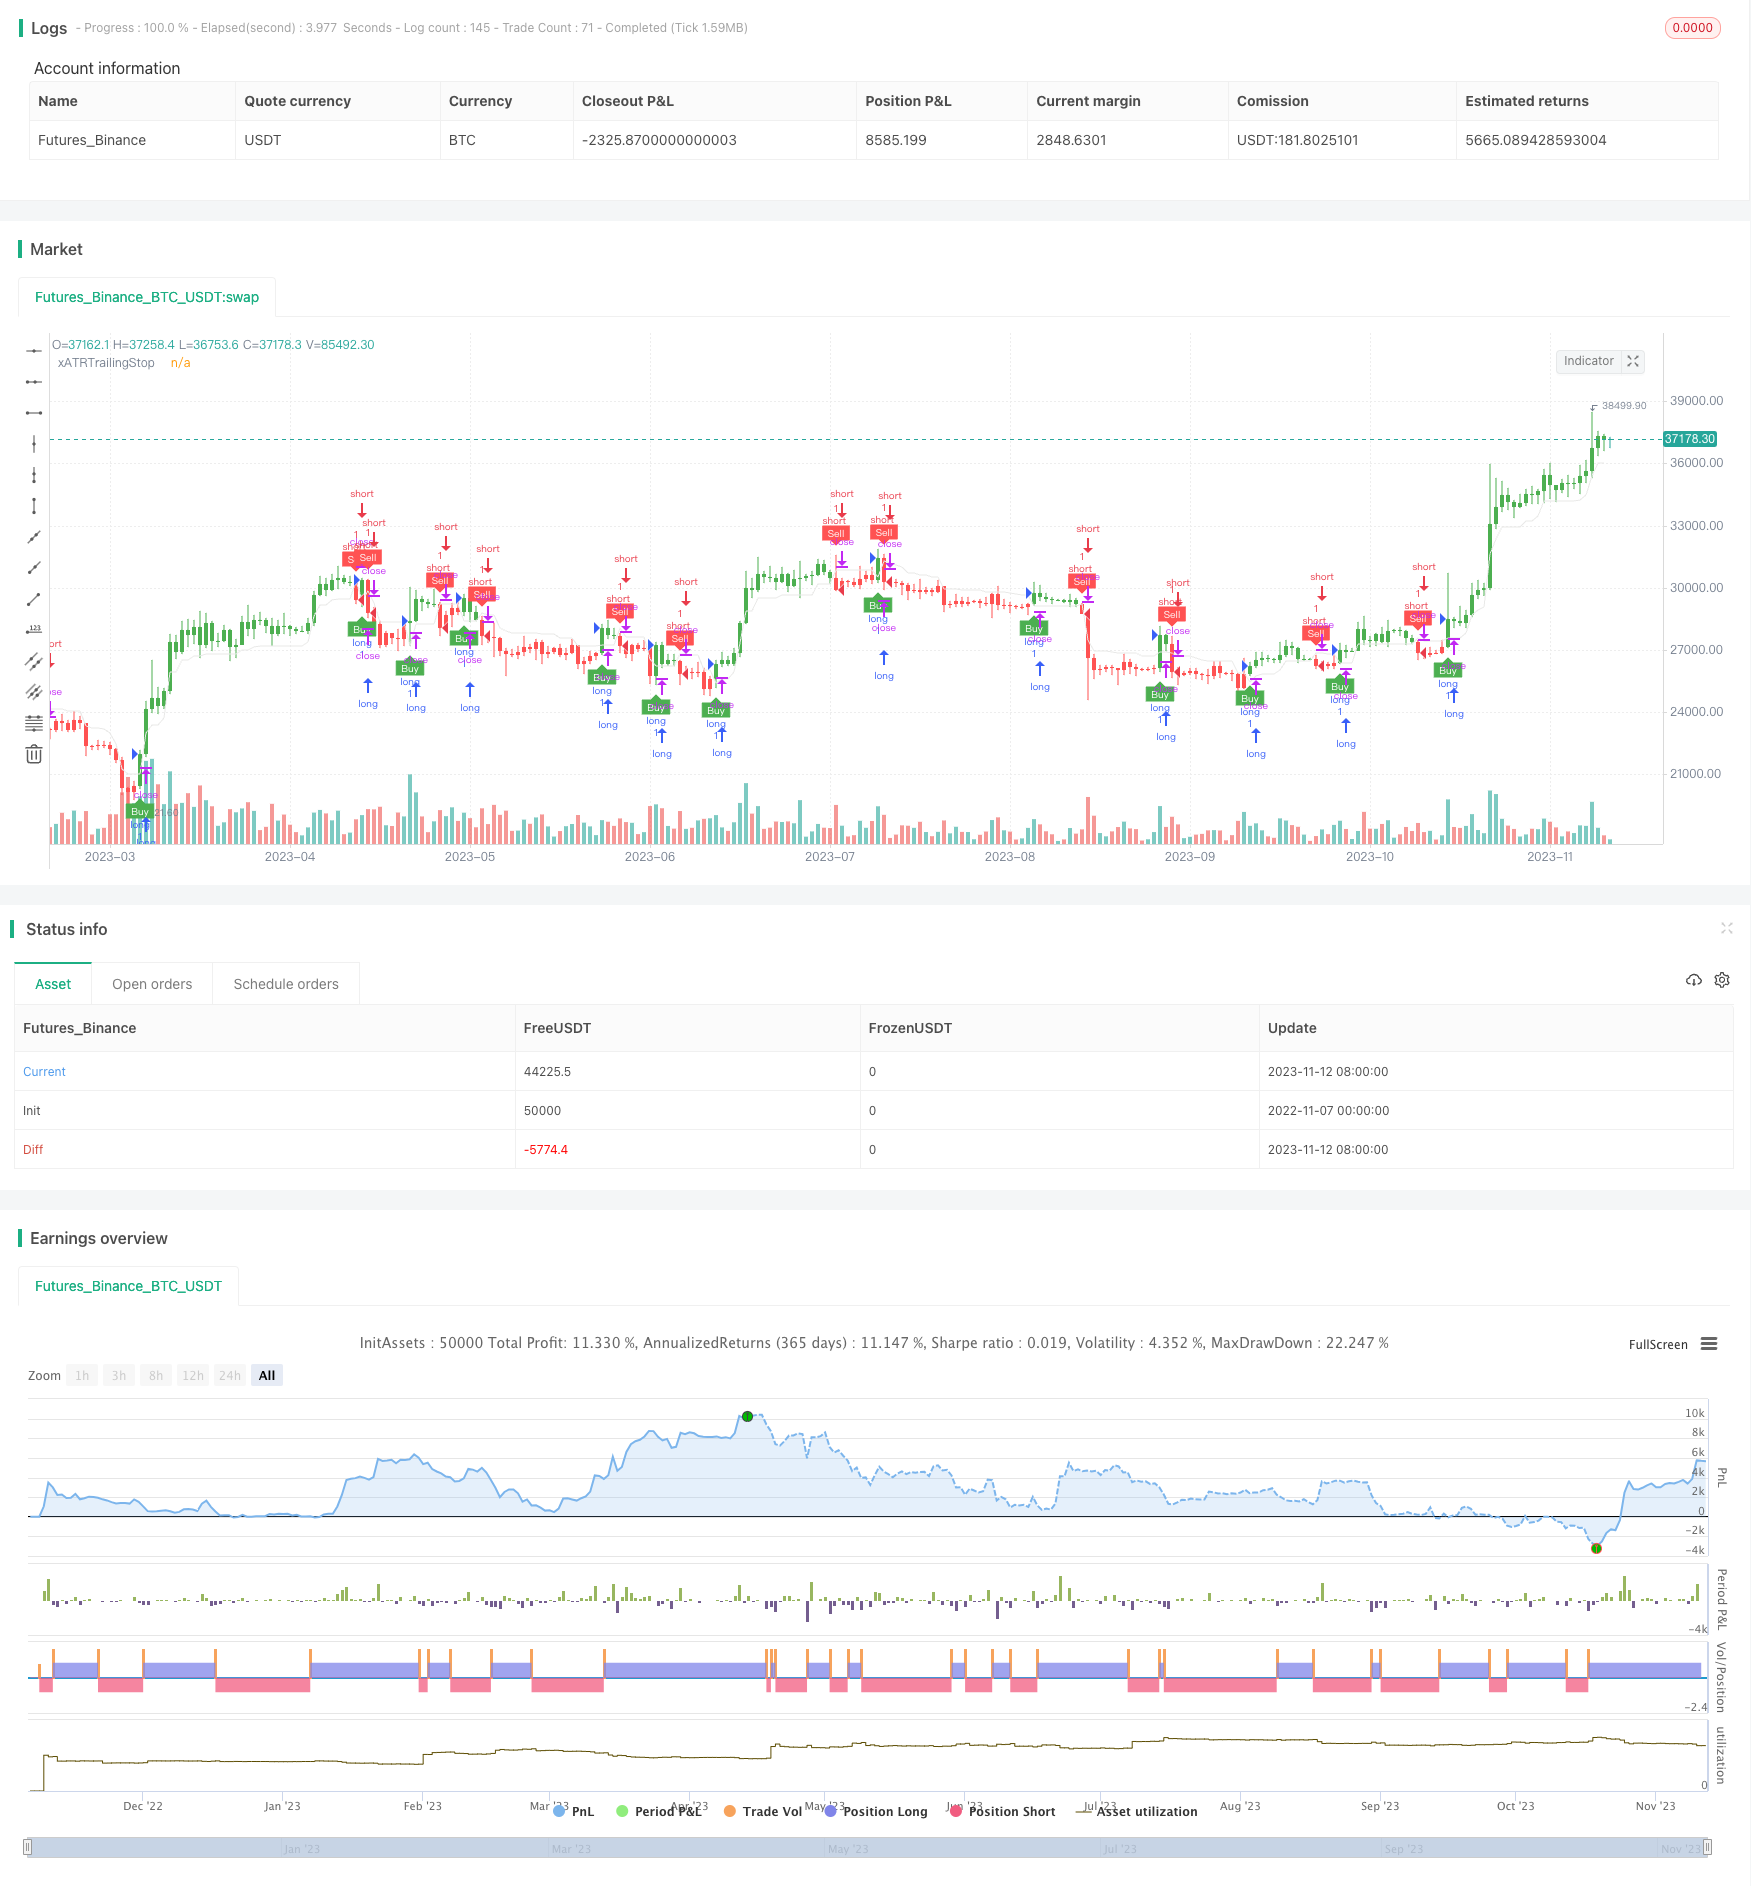 [trans]
概述
该策略利用布林线与ATR指标结合EMA均线进行判断,形成动量突破交易策略。当价格向上突破布林上轨且快速突破EMA均线时,产生买入信号;当价格向下突破布林下轨且快速跌破EMA均线时,产生卖出信号。同时利用ATR指标进行止损。
策略原理
-
计算布林线的中线、上轨和下轨。中线为n周期的SMA均线,上轨是中线+mn周期标准差,下轨是中线-mn周期标准差。
-
计算ATR指标,用于跟踪止损。
-
计算1周期和n周期的EMA均线,用于判断价格动量。
-
当价格上穿布林上轨,且快速上穿n周期EMA均线时,产生买入信号。
-
当价格下穿布林下轨,且快速下穿n周期EMA均线时,产生卖出信号。
-
ATR指标用于设置止损点,追踪价格突破方向,避免被套。
优势分析
-
布林线结合ATR止损,可以有效控制风险。
-
EMA快慢均线判断动量方向,避免虚假突破。
-
策略参数可调整,适用于不同市场环境。
-
买卖信号明确,交易频率较高,适合短线交易。
-
利用ATR指标追踪止损,可以及时止损。
风险分析
-
布林线范围过窄时,可能出现更多噪音交易。
-
ATR参数设置过小,可能造成止损距离太近被套。
-
EMA参数需要调整周期,不同周期效果不同。
-
震荡区间市可能产生更多交易,需谨慎。
-
追踪止损有时会过于激进,可能造成损失扩大。
优化方向
-
可以结合其他指标过滤交易信号。例如RSI指标判断超买超卖,KDJ指标判断背离等。
-
可以考虑根据ATR动态调整布林线参数,让布林线更贴合价格波动。
-
可以测试不同EMA周期参数的效果,找到最佳参数组合。
-
可以根据波动率智能调整ATR参数,避免止损过于激进。
-
可以考虑加入深度学习模型辅助判断买卖时机。
总结
本策略整体思路清晰,利用布林线捕捉价格突破,ATR设定止损范围,EMA判断动量方向,对突破动量进行全方位判断,可以有效捕捉短线价格趋势。同时结合多种指标进行综合判断,可以提高信号的质量。但也存在一些可优化的方向,通过参数调整、指标组合等方法可以进一步完善该策略,使其更稳定、更具弹性。
||
Overview
This strategy uses Bollinger Bands combined with ATR indicator and EMA lines to determine signals. It generates buy signals when price breaks through the Bollinger upper band and crosses above EMA line quickly. It generates sell signals when price breaks through the Bollinger lower band and crosses below EMA line quickly. ATR indicator is used to set stop loss.
Strategy Logic
-
Calculate Bollinger midline, upper band and lower band. Midline is n-period SMA, upper band is midline + mn-period standard deviation, lower band is midline - mn-period standard deviation.
-
Calculate ATR indicator to track stop loss.
-
Calculate 1-period and n-period EMA lines to determine price momentum.
-
When price crosses above Bollinger upper band and EMA line quickly, a buy signal is generated.
-
When price crosses below Bollinger lower band and EMA line quickly, a sell signal is generated.
-
ATR indicator sets stop loss points, tracking price breakout direction to avoid being trapped.
Advantage Analysis
-
Bollinger Bands combined with ATR stop loss can effectively control risk.
-
EMA fast and slow lines determine momentum direction, avoiding false breakout.
-
Adjustable parameters suit different market environments.
-
Clear buy/sell signals with high trading frequency, suitable for short-term trading.
-
ATR indicator tracks stop loss in a timely manner.
Risk Analysis
-
Narrow Bollinger Bands range may cause more noisy trades.
-
ATR parameter set too small may cause stop loss too close resulting in being trapped.
-
EMA parameters need adjustment for different cycle effects.
-
Oscillating market may generate more trades, need caution.
-
Tracking stop loss may sometimes be too aggressive, causing loss expansion.
Optimization
-
Combine with other indicators to filter trading signals, e.g. RSI for overbought/oversold, KDJ for divergence etc.
-
Consider dynamically adjusting Bollinger parameters based on ATR to fit price fluctuation.
-
Test different EMA cycle parameters for best parameter combination.
-
Intelligently adjust ATR parameters based on volatility to avoid aggressive stop loss.
-
Consider incorporating deep learning models to assist timing buy/sell decisions.
Summary
This strategy has clear logic utilizing Bollinger Bands to capture price breakout, ATR to set stop loss range, EMA to determine momentum direction for comprehensive judgment of momentum breakout, which can effectively capture short-term price trends. Combining multiple indicators for comprehensive judgment can improve signal quality. There is still room for optimization via parameter tuning, indicator combinations etc. to further refine this strategy for more stability and elasticity.
[/trans]
Strategy Arguments
| Argument | Default | Description |
|---|---|---|
| v_input_1 | true | Key Vaule. 'This changes the sensitivity' |
| v_input_2 | 10 | ATR Period |
| v_input_3 | false | Signals from Heikin Ashi Candles |
| v_input_4 | 20 | length |
| v_input_5 | 2 | StdDev |
Source (PineScript)
/*backtest
start: 2022-11-07 00:00:00
end: 2023-11-13 00:00:00
period: 1d
basePeriod: 1h
exchanges: [{"eid":"Futures_Binance","currency":"BTC_USDT"}]
*/

//@version=4
strategy(title="UT Bot Strategy", overlay = true)
//CREDITS to HPotter for the orginal code. The guy trying to sell this as his own is a scammer lol.
// Inputs
a = input(1,     title = "Key Vaule. 'This changes the sensitivity'")
c = input(10,    title = "ATR Period")
h = input(false, title = "Signals from Heikin Ashi Candles")

src = h ? security(heikinashi(syminfo.tickerid), timeframe.period, close, lookahead = false) : close

length = input(20, minval=1)
mult = input(2.0, minval=0.001, maxval=50, title="StdDev")
basis = sma(src, length)
dev = mult * stdev(src, length)
upper = basis + dev
lower = basis - dev
bbr = (src - lower)/(upper - lower)
// plot(bbr, "Bollinger Bands %B", color=#26A69A)
// band1 = hline(1, "Overbought", color=#787B86, linestyle=hline.style_dashed)
// hline(0.5, "Middle Band", color=color.new(#787B86, 50))
// band0 = hline(0, "Oversold", color=#787B86, linestyle=hline.style_dashed)
// fill(band1, band0, color=color.rgb(38, 166, 154, 90), title="Background")


xATR  = atr(c)
nLoss = a * xATR


xATRTrailingStop = 0.0
xATRTrailingStop := iff(src > nz(xATRTrailingStop[1], 0) and src[1] > nz(xATRTrailingStop[1], 0), max(nz(xATRTrailingStop[1]), src - nLoss),
   iff(src < nz(xATRTrailingStop[1], 0) and src[1] < nz(xATRTrailingStop[1], 0), min(nz(xATRTrailingStop[1]), src + nLoss),
   iff(src > nz(xATRTrailingStop[1], 0), src - nLoss, src + nLoss)))

pos = 0
pos :=	iff(src[1] < nz(xATRTrailingStop[1], 0) and src > nz(xATRTrailingStop[1], 0), 1,
   iff(src[1] > nz(xATRTrailingStop[1], 0) and src < nz(xATRTrailingStop[1], 0), -1, nz(pos[1], 0)))

xcolor = pos == -1 ? color.red: pos == 1 ? color.green : color.blue

ema   = ema(src,1)
emaFast   = ema(src,144)
emaSlow   = ema(src,576)
sma       =  sma(src, c)

above = crossover(ema, xATRTrailingStop)
below = crossover(xATRTrailingStop, ema)

smaabove = crossover(src, sma)
smabelow = crossover(sma, src)


buy  = src > xATRTrailingStop and above and (bbr>20  or bbr<80)
sell = src < xATRTrailingStop and below  and  (bbr>20  or bbr<80)

// buy  = src > xATRTrailingStop
// sell = src < xATRTrailingStop


barbuy  = src > xATRTrailingStop
barsell = src < xATRTrailingStop

// plot(emaFast , color = color.rgb(243, 206, 127), title="emaFast")

plot(xATRTrailingStop, color = color.rgb(233, 233, 232), title="xATRTrailingStop")

plotshape(buy,  title = "Buy",  text = 'Buy',  style = shape.labelup,   location = location.belowbar, color= color.green, textcolor = color.white, transp = 0, size = size.tiny)
plotshape(sell, title = "Sell", text = 'Sell', style = shape.labeldown, location = location.abovebar, color= color.red,   textcolor = color.white, transp = 0, size = size.tiny)


// plotshape(buy,  title = "Sell",  text = 'Sell',  style = shape.labelup,   location = location.belowbar, color= color.green, textcolor = color.white, transp = 0, size = size.tiny)
// plotshape(sell, title = "buy", text = 'buy', style = shape.labeldown, location = location.abovebar, color= color.red,   textcolor = color.white, transp = 0, size = size.tiny)

barcolor(barbuy  ? color.green : na)
barcolor(barsell ? color.red   : na)

// strategy.entry("short",   false, when = buy)
// strategy.entry("long ", true, when = sell)


strategy.entry("long",   true, when = buy)
strategy.entry("short ", false, when = sell)
Detail
https://www.fmz.com/strategy/432076
Last Modified
2023-11-14 11:19:05