
8.8 KiB
Name
动量套利策略回测分析Momentum-Arbitrage-Strategy-Backtest-Analysis
Author
ChaoZhang
Strategy Description
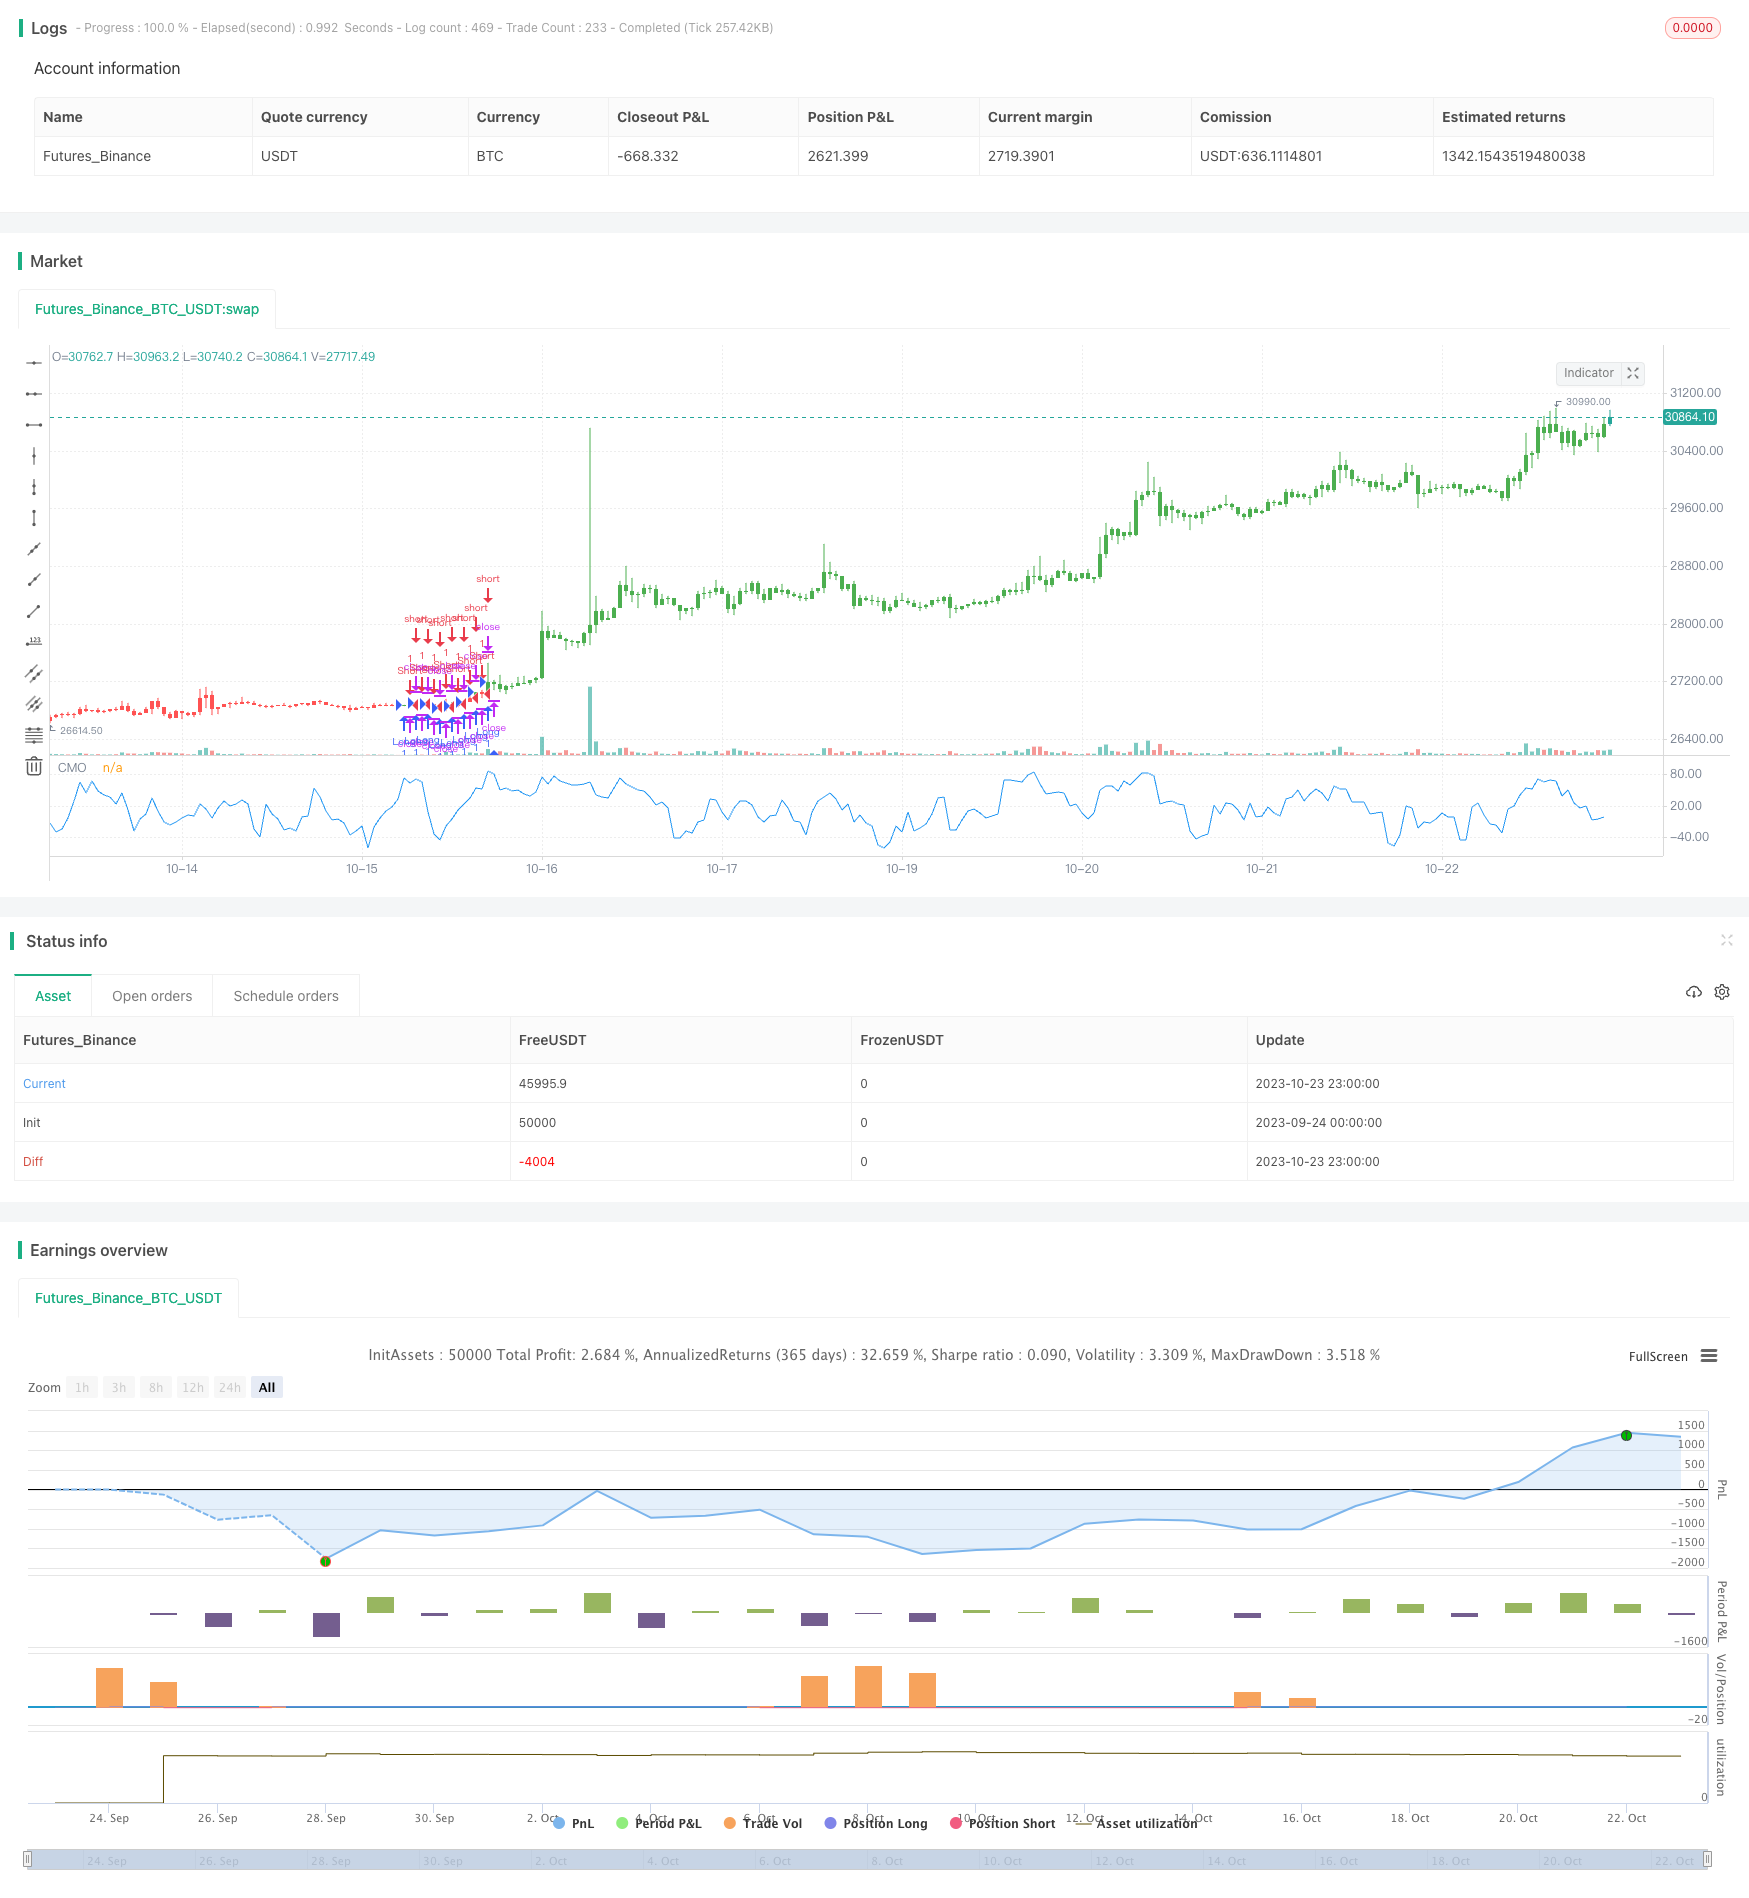
[trans]
一、策略名称
根据该策略的主要特征,我将其命名为“动量套利策略”。
二、策略概述
该策略通过计算Chande 动量震荡指标,并设定上下阈值构建多空信号,形成套利机会,实现获利。
三、策略原理
代码首先设置参数Length、TopBand、LowBand,Length代表计算动量的天数周期,TopBand和LowBand代表设置的上下阈值。
然后计算最近Length天的绝对动量xMom,再计算xMom的Length日简单移动平均xSMA_mom。
随后计算Length天内的累计动量xMomLength。
接着计算动量震荡指标nRes,等于xMomLength除以xSMA_mom再乘以Length,放大100倍。
根据nRes与上下阈值的大小关系判断多空方向,存入pos。
最后根据是否启用反向交易修正pos,生成交易信号possig,产生多空entries。
四、策略优势
- 使用动量指标识别趋势潜在转折点,利于捕捉趋势
- 结合阈值过滤形成明确的多空信号,避免错误交易
- 应用反向交易思路,能够获取反转机会
- 参数可调节空间大,可以针对不同品种、周期进行优化
- 可视化参数直观,便于掌握交易逻辑
五、策略风险
- 仅考虑动量因素,可能错过其他技术指标形成的交易机会
- 动量突破不一定代表趋势转折,存在误判风险
- 反向交易虽有获利空间,但亦可能加剧亏损
- 参数优化不当可能导致过于频繁交易或错过最佳点位
- 需适当过滤突发事件导致的短期动量失真情况
可通过结合趋势、波动率等其他技术指标来确定动量信号的可靠性,调整参数降低交易频率,适当宽松止损点位等方式来控制风险。
六、策略优化方向
1.加入其他技术指标过滤,提高交易信号准确率
可以在动量信号触发前,判断收盘价是否处于均线系统之上,或波动率是否处于正常范围内,避免被误导。
2.根据品种特性优化参数
对于波动率较高的品种可以适当拉宽动量波动的正常阈值范围,降低交易频率。
3.根据不同时间周期进行多时间框架优化
在日内可以采用较小周期Length,做超短线交易;按照周线或月线来调整参数,侧重中长线趋势。
4.设置底背离条件
在看涨信号触发时,需加上价格高于之前波谷的条件,避免趋势反转的假信号。
七、总结
该策略主要通过动量指标识别短期趋势反转机会,结合参数过滤生成交易信号,兼顾趋势跟踪和反转捕捉,风险可控。通过多 timeframe 优化及组合其他技术指标,可以提升策略交易效果,值得进一步研究与应用。
||
I. Strategy Name
Based on the key features of this strategy, I name it "Momentum Arbitrage Strategy".
II. Strategy Overview
This strategy generates trading signals by calculating the Chande Momentum Oscillator and setting upper and lower thresholds, forming arbitrage opportunities for profits.
III. Strategy Logic
The code first sets parameters Length, TopBand and LowBand, where Length represents the number of days for momentum calculation, and TopBand and LowBand represent the upper and lower thresholds.
It then calculates the absolute momentum xMom over the past Length days, and the simple moving average of xMom over Length days, xSMA_mom.
After that, it calculates the cumulative momentum over Length days, xMomLength.
Next, it calculates the momentum oscillator nRes, which equals xMomLength divided by xSMA_mom then multiplied by Length, amplified by 100.
Based on the comparison between nRes and the thresholds, it determines long or short direction and stores it in pos.
Finally, it adjusts pos based on whether reverse trading is enabled, generates trading signal possig, and creates long/short entries.
IV. Strategy Strengths
-
Identify potential trend turning points using momentum indicator, benefiting trend catching.
-
Form clear long/short signals combined with threshold filtering, avoiding wrong trades.
-
Apply reverse trading logic to obtain reversal opportunities.
-
Large tunable parameter space, can be optimized for different products and timeframes.
-
Visualized parameters are intuitive, easy to grasp trading logic.
V. Strategy Risks
-
Only consider momentum, may miss opportunities formed by other technical indicators.
-
Momentum breakout does not necessarily represent trend reversal, wrong judgement risk exists.
-
Although reverse trading has profit potential, it may also amplify losses.
-
Improper parameter optimization may lead to over-trading or missing best entry points.
-
Need to filter out short-term momentum distortions caused by sudden events.
Risks can be controlled by combining other indicators like trend and volatility to confirm signal reliability, adjusting parameters to lower trade frequency, relaxing stop loss properly, etc.
VI. Strategy Optimization Directions
- Add other technical indicator filters to improve signal accuracy.
Confirm close price is above moving average system, or volatility is within normal range, before triggered momentum signals.
- Optimize parameters according to product characteristics.
For more volatile products, relax the normal threshold range to lower trade frequency.
- Multi-timeframe optimization based on different time periods.
Use smaller period Length for intraday ultra-short term trading. Adjust parameters based on weekly or monthly charts for medium-long term trends.
- Set bottom divergence condition.
For buy signals, require price to be above previous trough to avoid fake reversal signals.
VII. Conclusion
The strategy mainly identifies short-term trend reversals through momentum indicator, with parameter filtering to generate trade signals, balancing trend following and reversal capturing. The risks are controllable. Further research and application with multi-timeframe optimization and combining other technical indicators can improve strategy performance.
[/trans]
Strategy Arguments
| Argument | Default | Description |
|---|---|---|
| v_input_1 | 9 | Length |
| v_input_2 | 70 | TopBand |
| v_input_3 | -70 | LowBand |
| v_input_4 | false | Trade reverse |
Source (PineScript)
/*backtest
start: 2023-09-24 00:00:00
end: 2023-10-24 00:00:00
period: 1h
basePeriod: 15m
exchanges: [{"eid":"Futures_Binance","currency":"BTC_USDT"}]
*/

//@version=2
////////////////////////////////////////////////////////////
//  Copyright by HPotter v1.0 07/02/2017
//    This indicator plots Chande Momentum Oscillator. This indicator was
//    developed by Tushar Chande. A scientist, an inventor, and a respected
//    trading system developer, Mr. Chande developed the CMO to capture what
//    he calls "pure momentum". For more definitive information on the CMO and
//    other indicators we recommend the book The New Technical Trader by Tushar
//    Chande and Stanley Kroll.
//    The CMO is closely related to, yet unique from, other momentum oriented
//    indicators such as Relative Strength Index, Stochastic, Rate-of-Change,
//    etc. It is most closely related to Welles Wilder`s RSI, yet it differs
//    in several ways:
//        - It uses data for both up days and down days in the numerator, thereby
//          directly measuring momentum;
//        - The calculations are applied on unsmoothed data. Therefore, short-term
//          extreme movements in price are not hidden. Once calculated, smoothing
//          can be applied to the CMO, if desired;
//        - The scale is bounded between +100 and -100, thereby allowing you to
//          clearly see changes in net momentum using the 0 level. The bounded scale
//          also allows you to conveniently compare values across different securities.
////////////////////////////////////////////////////////////
strategy(title="CMO (Chande Momentum Oscillator)", shorttitle="CMO")
Length = input(9, minval=1)
TopBand = input(70, minval=1)
LowBand = input(-70, maxval=-1)
reverse = input(false, title="Trade reverse")
// hline(0, color=gray, linestyle=dashed)
// hline(TopBand, color=red, linestyle=line)
// hline(LowBand, color=green, linestyle=line)
xMom = abs(close - close[1])
xSMA_mom = sma(xMom, Length)
xMomLength = close - close[Length]
nRes = 100 * (xMomLength / (xSMA_mom * Length))
pos = iff(nRes > TopBand, 1,
	   iff(nRes <= LowBand, -1, nz(pos[1], 0)))
possig = iff(reverse and pos == 1, -1,
         iff(reverse and pos == -1, 1, pos))
if (possig == 1)
    strategy.entry("Long", strategy.long)
if (possig == -1)
    strategy.entry("Short", strategy.short)
barcolor(possig == -1 ? red: possig == 1 ? green : blue)
plot(nRes, color=blue, title="CMO")
Detail
https://www.fmz.com/strategy/430117
Last Modified
2023-10-25 11:10:59